Executive Summary
This story is built on the analysis in DataClinic Report #42. The subject is 30VNFoods — a Kaggle dataset of 30 Vietnamese dishes, 17,581 images in all. Compared with a Korean food dataset of around 150,000 images, it is roughly one-eighth the size. It is easy to assume that smaller means cleaner, but looking through DataClinic's L2 and L3 lenses, the cracks specific to a small dataset stood out all the more sharply.
The most striking finding is that the same photo carries two different labels. One image in the Banh gio folder and one in the Banh beo folder are the same photo down to the pixel, yet they wear two different ground-truth labels. This pair was flagged as each other's nearest neighbor across all 17,581 images, and it remained so even after the optimization that reduced 1,280 dimensions down to 61. That means it is not a model problem — it is an integrity problem in the data itself.
The other two cracks are photos where the food isn't the subject (a banh chung held by a baby, a banh mi with a dog in the background), and a banh trang nuong that was always the same scene (a collection skewed toward one night-stall grill composition). All three illustrate the classic risk of AI training data: "plenty of numbers, but thin on information."
※ DataClinic #42 does not expose an overall score or grade through its public API, so this story centers on a structural, qualitative diagnosis rather than asserting a number. No Pebbloscope snapshot was generated for this report either, so the "why" behind each cluster is explained through the per-class density plots instead.
30 Flavors of the Vietnamese Street
30VNFoods gathers 30 of Vietnam's signature dishes for image classification — from the rice noodle soup pho, to the baguette sandwich banh mi, to the Hue-style beef noodle soup bun bo Hue. Most photos were taken at street stalls and home dining tables, and the dataset is openly available on Kaggle, where it is often used in food-recognition AI research. We start with a collage to take in the dataset as a whole.
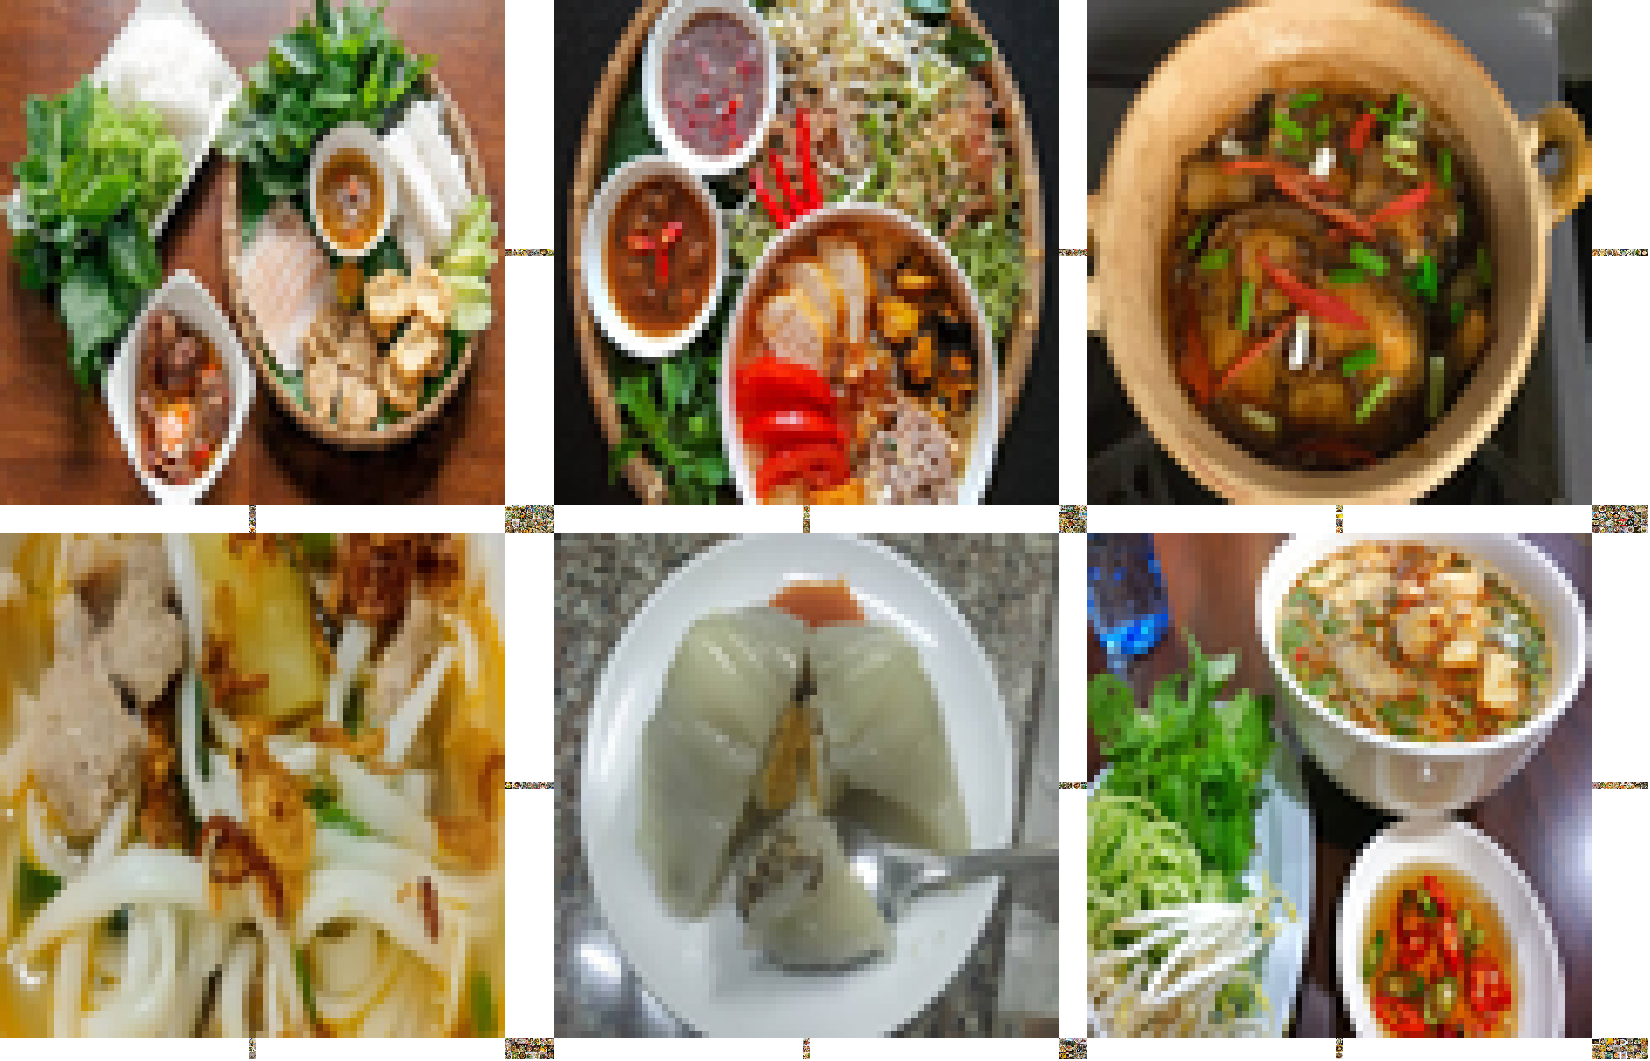
▲ 30VNFoods collage (DataClinic L1) — color, plating, and shooting conditions differ from class to class.
Translating that visual impression into numbers reveals the dataset's skeleton. Across 30 classes, 17,581 images average 586 per class — but with a standard deviation of 176, that single average hides a fair amount of skew. The two cards below summarize the dataset's basic specs (left) and the clearest form of that skew, the class imbalance (right).
📊 Dataset specs
- 17,581 images · 30 classes
- Average 586 per class (std. dev. 176)
- Image size 100×83 – 7,360×4,912px (wide variance)
- Channels all RGB, no missing values
- Source: Kaggle — quandang/vietnamese-foods
⚖️ Class imbalance (3.5×)
The largest class has 3.5× as many images as the smallest.
DataClinic diagnoses data through three lenses. L1 checks basic integrity — image size, channels, missing values, class balance. L2 examines the latent structure within a general-purpose neural network's feature space (Wolfram ImageIdentify Net V2, 1,280 dimensions). L3 re-examines the data through a specialized lens that keeps only the 61 of those 1,280 dimensions that preserve class discriminability. Change the lens, and the same dataset reveals different cracks.
L1 — What the Mean Image Says
On the L1 diagnosis, 30VNFoods has solid fundamentals. There are no label-format issues, every image is unified to RGB channels, and there are no missing values. Image sizes do range widely, from 100 pixels to 7,360 pixels, so a resize step is needed before training.
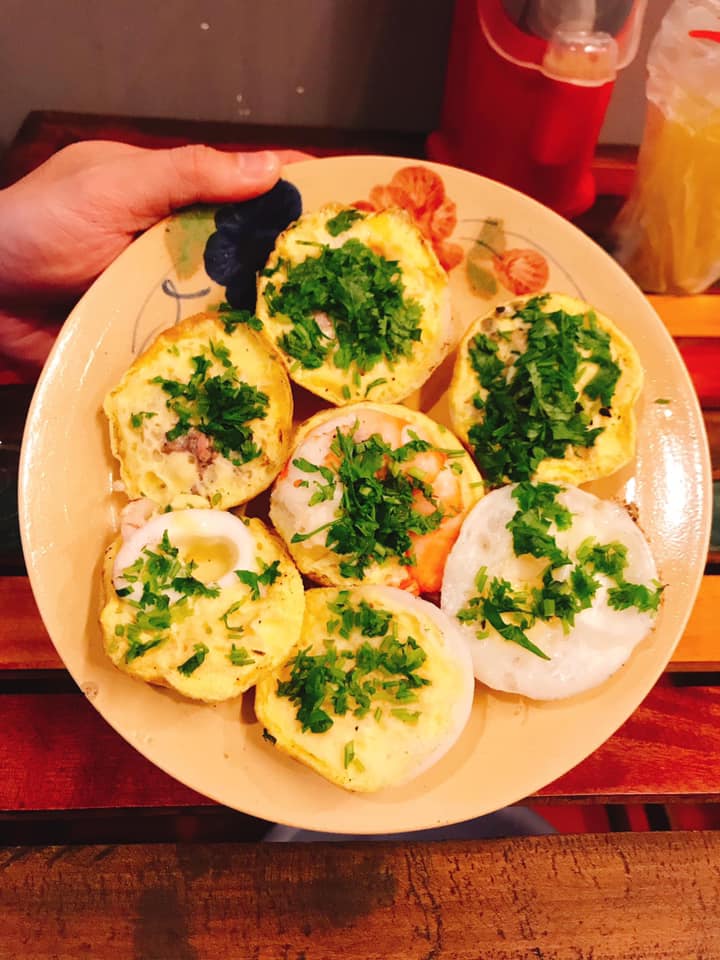
What's interesting here is the class mean image. Average all of a class's photos pixel by pixel, and you can see at a glance how uniform that class is. A crisp mean means a similar composition was repeated; a blurry, smeared mean means a wide variety of photos were mixed in. Below, six classes are shown with their actual sample (left) next to their mean image (right).
 Actual
 Mean
Mean
 Actual
 Mean
Mean
 Actual
 Mean
Mean
 Actual
 Mean
Mean
 Actual
 Mean
Mean
 Actual
 Mean
Mean
▲ Left of each card: the class's representative (actual) sample / Right: the mean image (DataClinic L1)
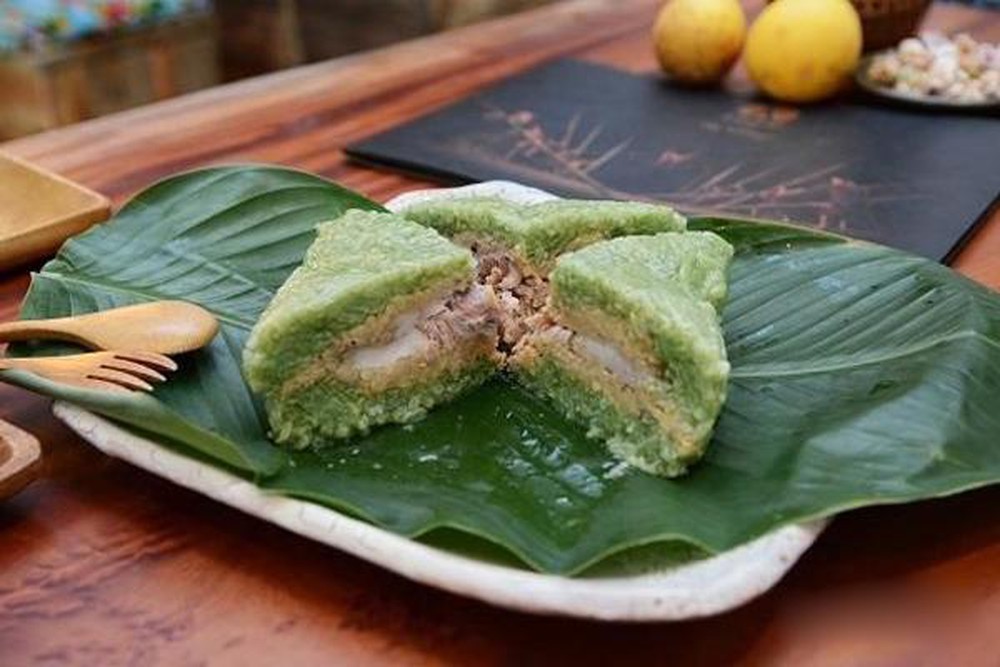
The mean image for banh trang nuong is quite sharp — a sign that the same composition (a round rice paper over a night grill) was repeated. The mean for banh chung, by contrast, is smeared past recognition, because too many different photos were mixed together: some wrapped in leaves, some cut open to show the filling, some held in a person's hands. The L1 mean image is, in effect, a trailer for the "uniform vs. diverse" story that plays out in full at L2 and L3.
L2 — Food Seen in 1,280 Dimensions
L2 views the data in the 1,280-dimensional feature space extracted by a general-purpose neural network (Wolfram ImageIdentify Net V2). First, the overall distribution projected onto two dimensions via PCA. Rather than splitting into 30 distinct islands, the classes overlap into one large mass at the center. Food photos share similar plates, backgrounds, and lighting, so the boundaries between classes are blurry — the classic fine-grained classification problem.
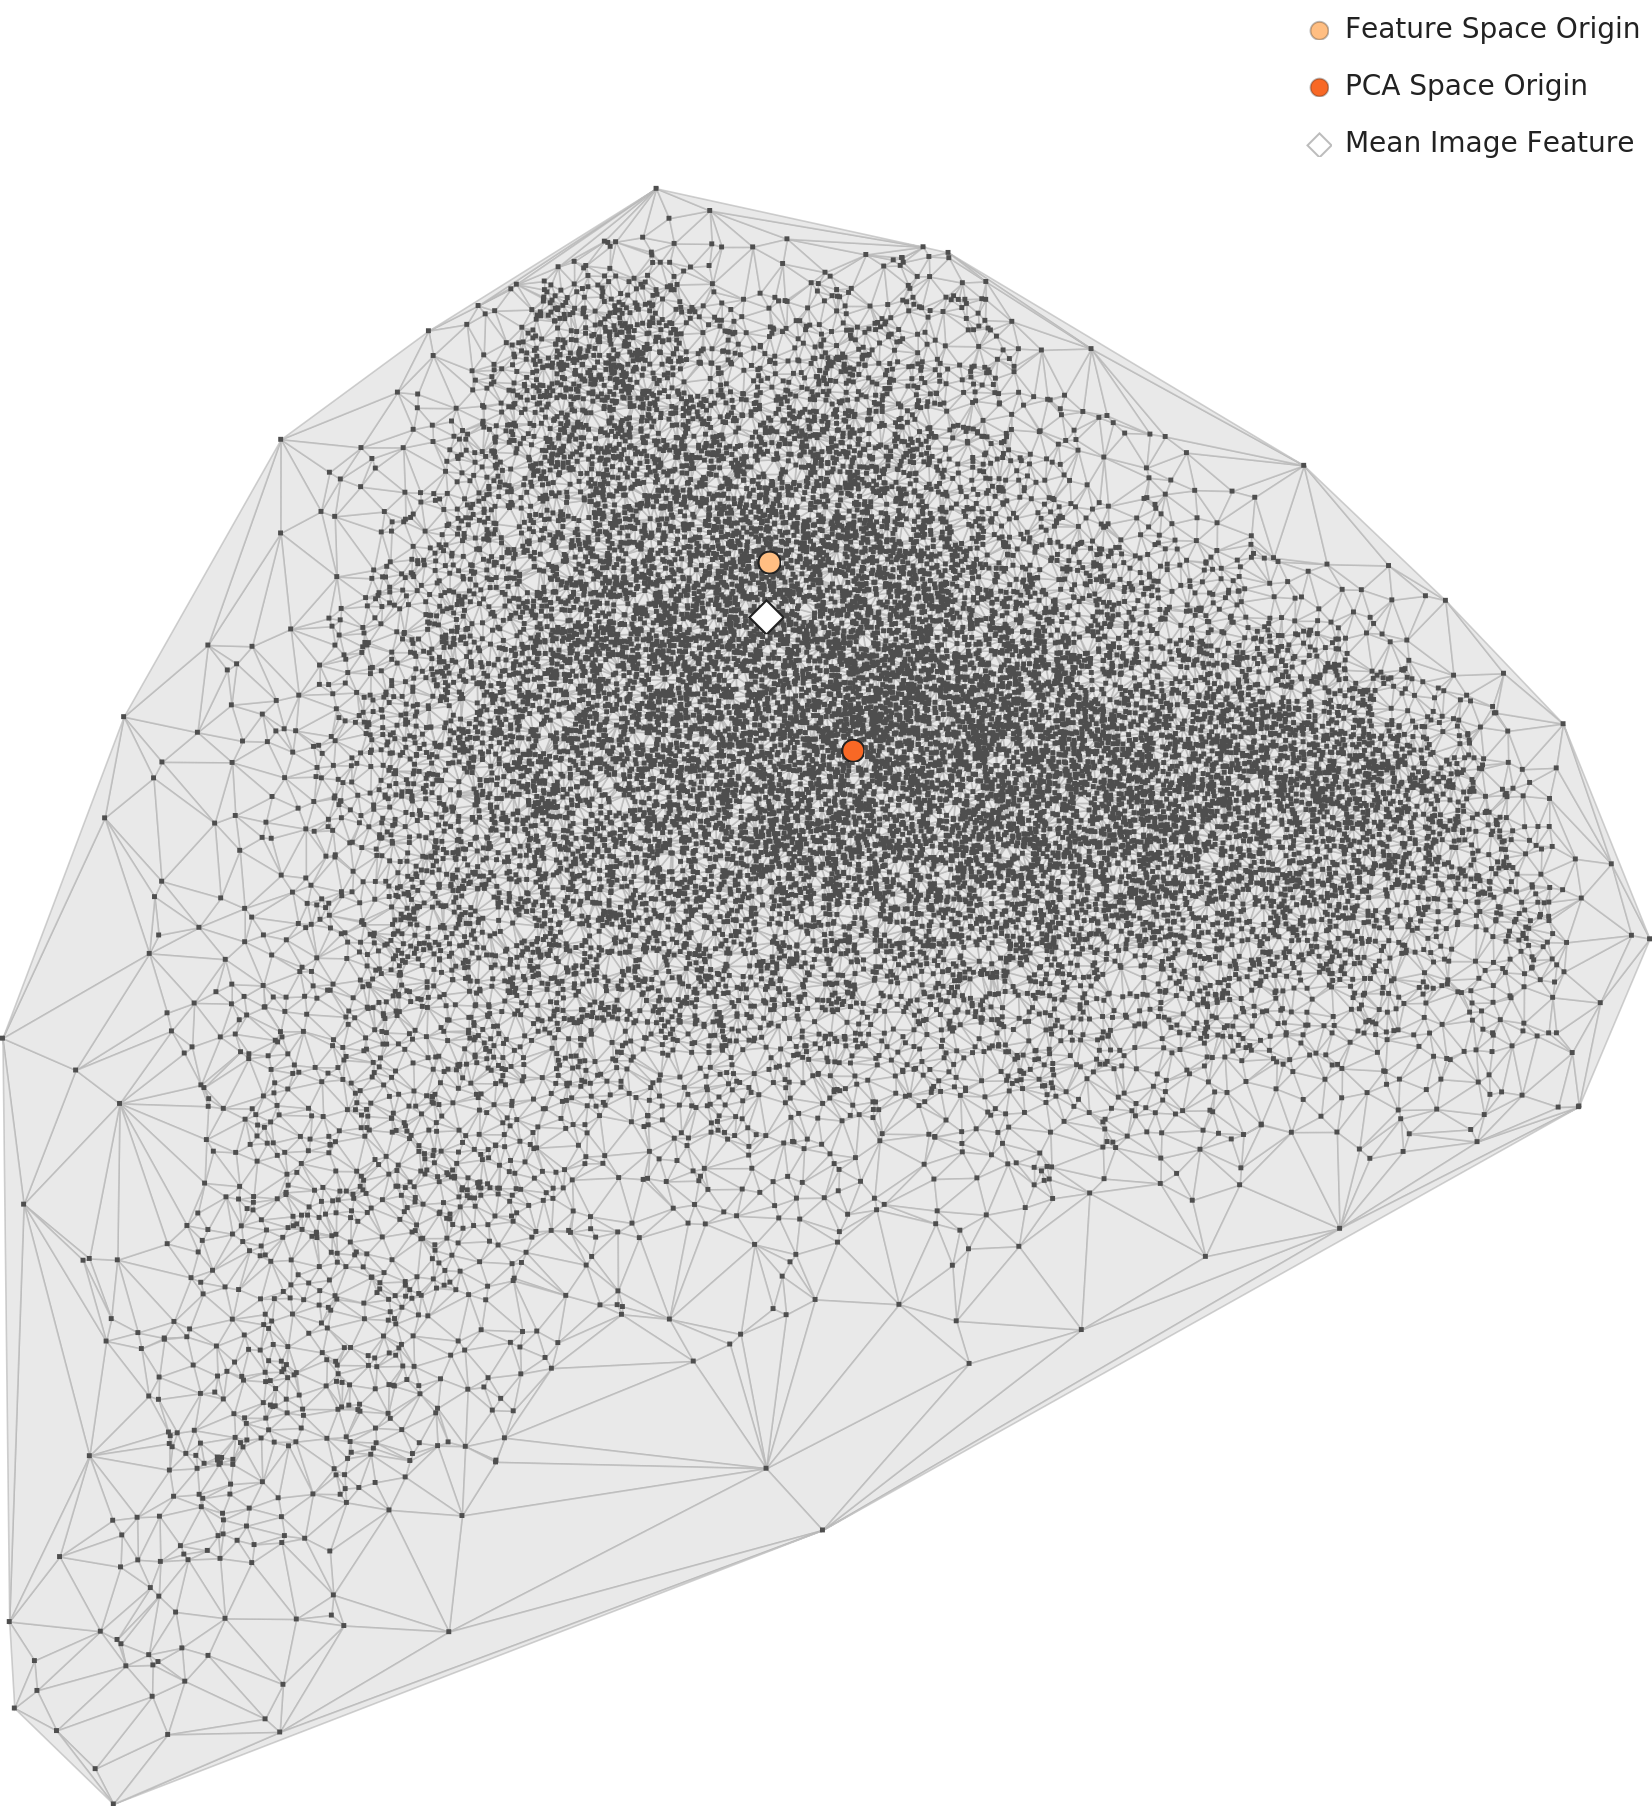
▲ L2 PCA overall distribution (Wolfram 1,280-dimensional lens).
※ The points in this PCA plot are rendered in a single color, with no per-class coloring. So you should read only the shape of the distribution — "everything overlaps into one mass" — not "which class sits where."
To see the differences between classes, density plots are clearer. DataClinic assigns each class a density value for how tightly it clusters in the feature space. High density means similar photos are concentrated in one spot; low density means they are spread widely. At L2, the two extremes are banh trang nuong and banh chung.
 Density
Actual
Density
Actual
 Density
Actual
Density
Actual
▲ L2 density plot (left) + representative image (right). Banh trang nuong clusters into a narrow core; banh chung spreads wide.
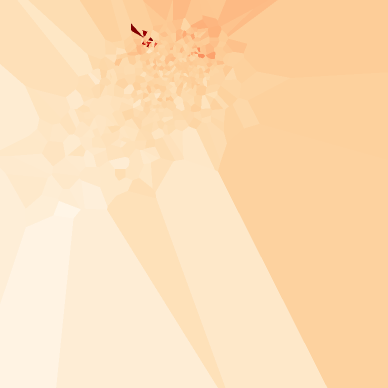
On the overall density landscape (below), the L2 stage is broadly pale and evenly spread. Through a general-purpose lens, the dishes are buried under the larger commonality of being "food photos," so the outlier signal is still only weakly visible. That signal only sharpens at L3, once the dimensions are reduced.
▲ L2 density heatmap — broadly pale and uniform. Outlier contrast is weak.
L3 — A Lens Narrowed to 61 Dimensions
L3 is a specialized lens that keeps only the 61 of those 1,280 dimensions that actually contribute to distinguishing classes. Even with 95% of the dimensions stripped away, the overall topology (the data's broad outline) is preserved. What changes dramatically is the density contrast. Density values that ran 0.04–0.27 at L2 amplify to 0.75–2.60 at L3 — roughly 10×. That number does not mean the data got better. The same points simply gather into a tighter space, so the density value itself grows. What matters is not the absolute value but that, as a result, the contrast between the typical and the anomalous becomes sharp.
| Metric | L2 (1,280 dims) | L3 (61 dims) |
|---|---|---|
| Observed dimensions | 1,280 | 61 (−95.2%) |
| Density value range | 0.04 – 0.27 | 0.75 – 2.60 (~10×) |
| Density heatmap | Pale, uniform | Deep-red core + radial branches |
| Highest-density class | Banh trang nuong | Banh trang nuong (sweeps Top 5) |
| Lowest-density shift | Banh pia, etc. | Banh mi, Chao long newly enter |
| Banh gio ↔ Banh beo duplicate | Nearest pair | Still the nearest pair (unresolved) |
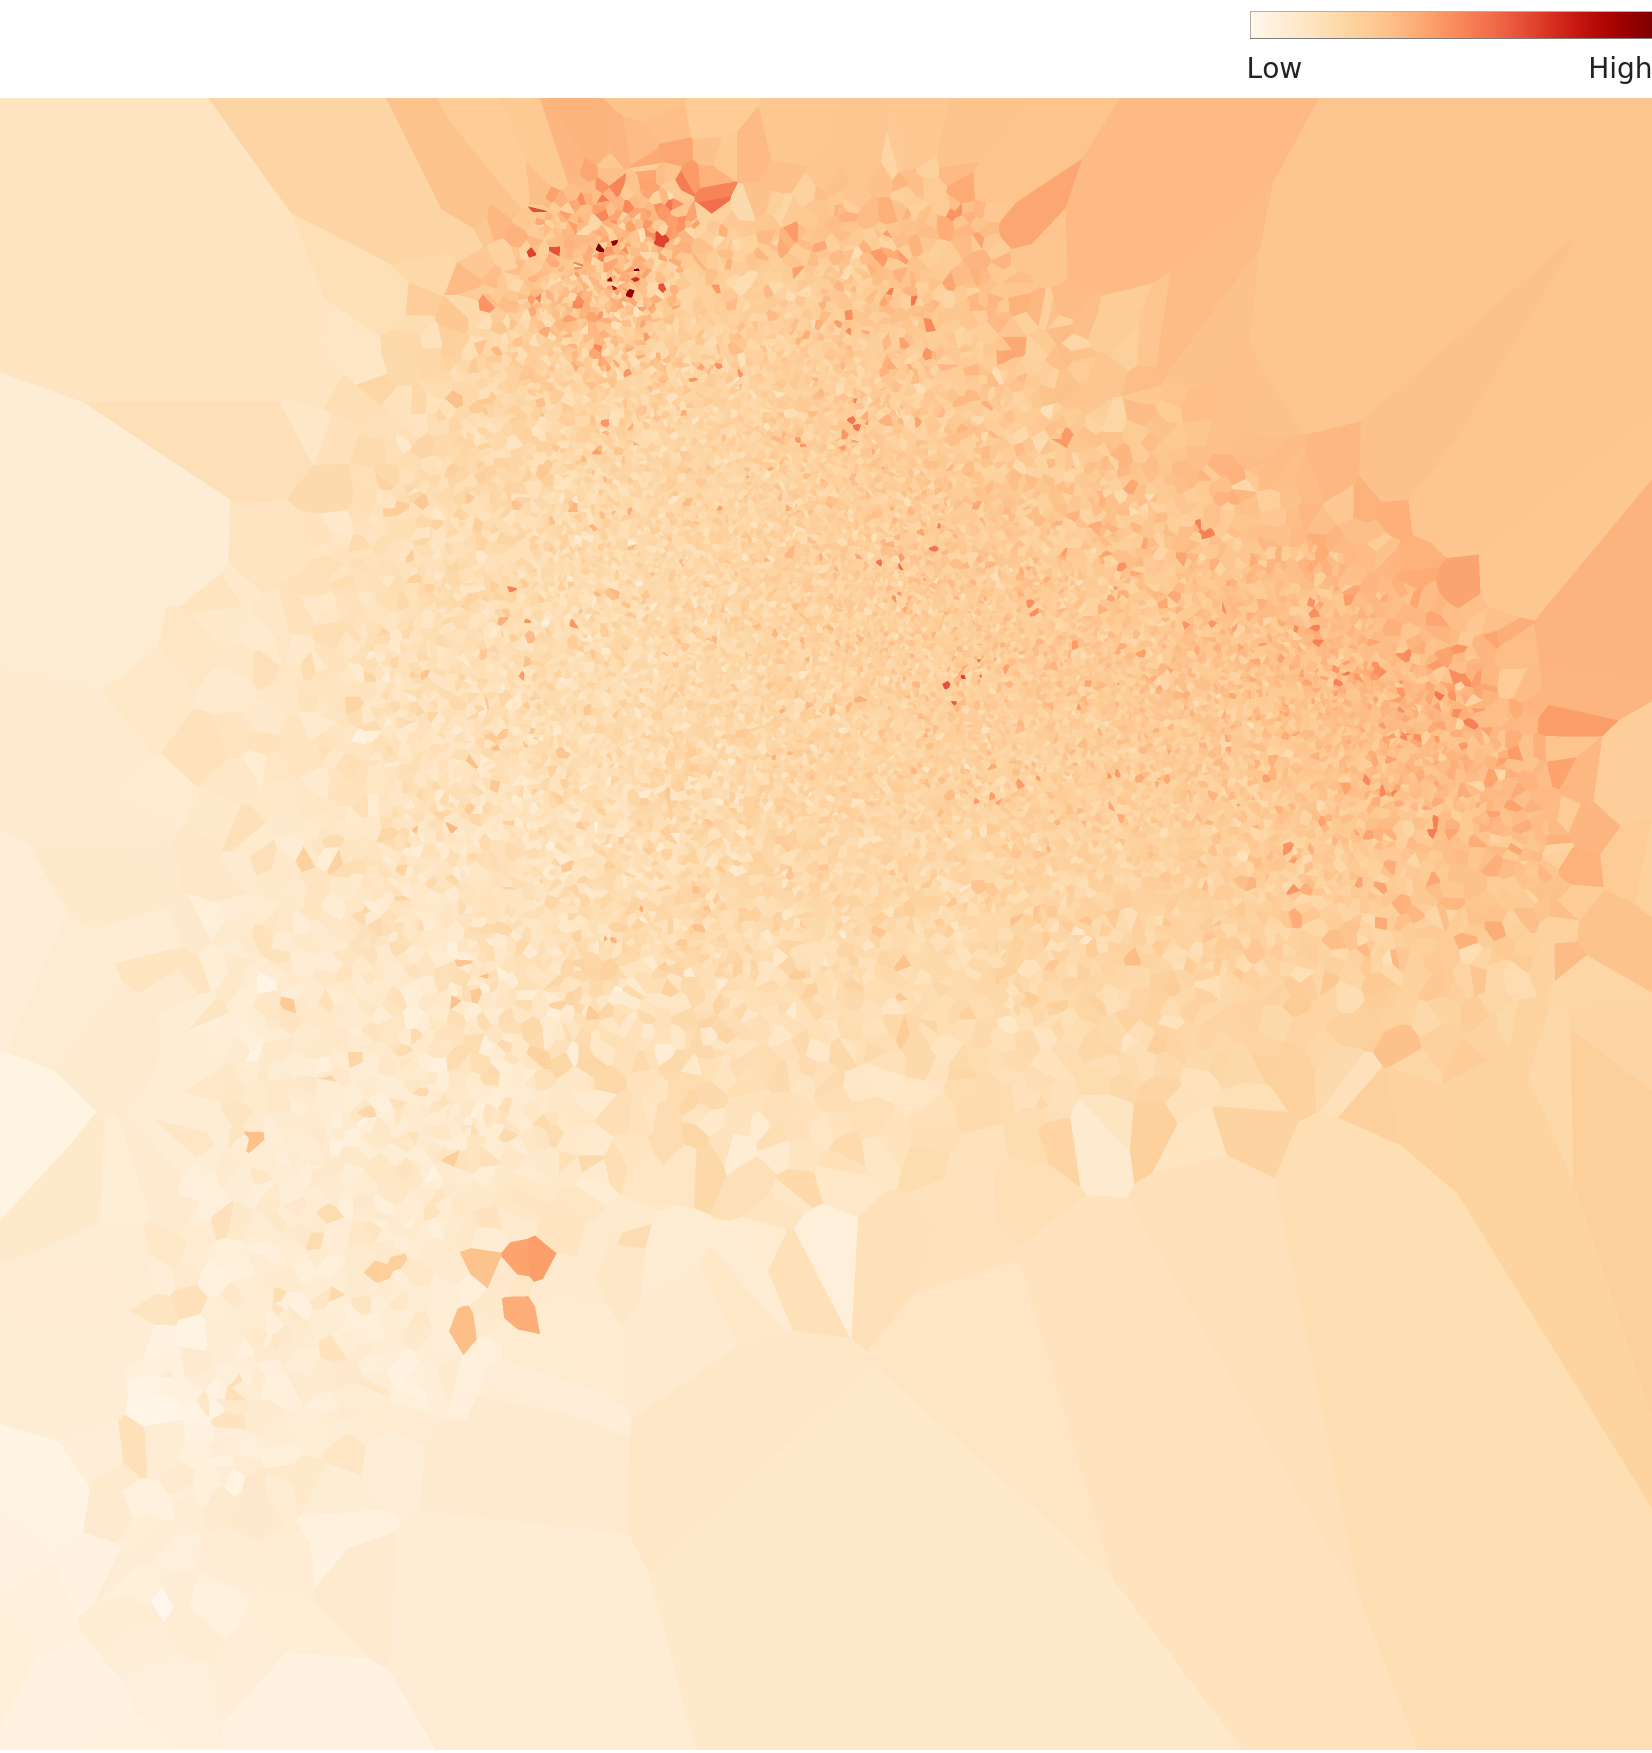
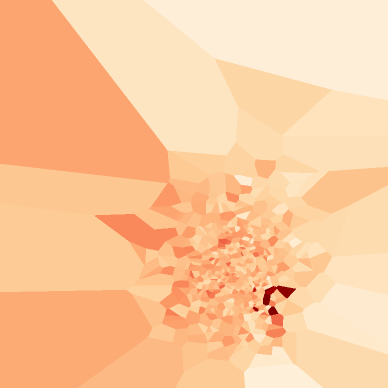
In the L3 density heatmap (below), L2's pale distribution turns into a deep-red core at the center with radial branches reaching outward. The core is the general "food photo" region where all 30 dishes overlap, and the darkest branch stretching to the upper left is the separate high-density stalk that banh trang nuong forms. The pale triangular cells along the edges are the low-density outliers — the photos where the food isn't the subject.
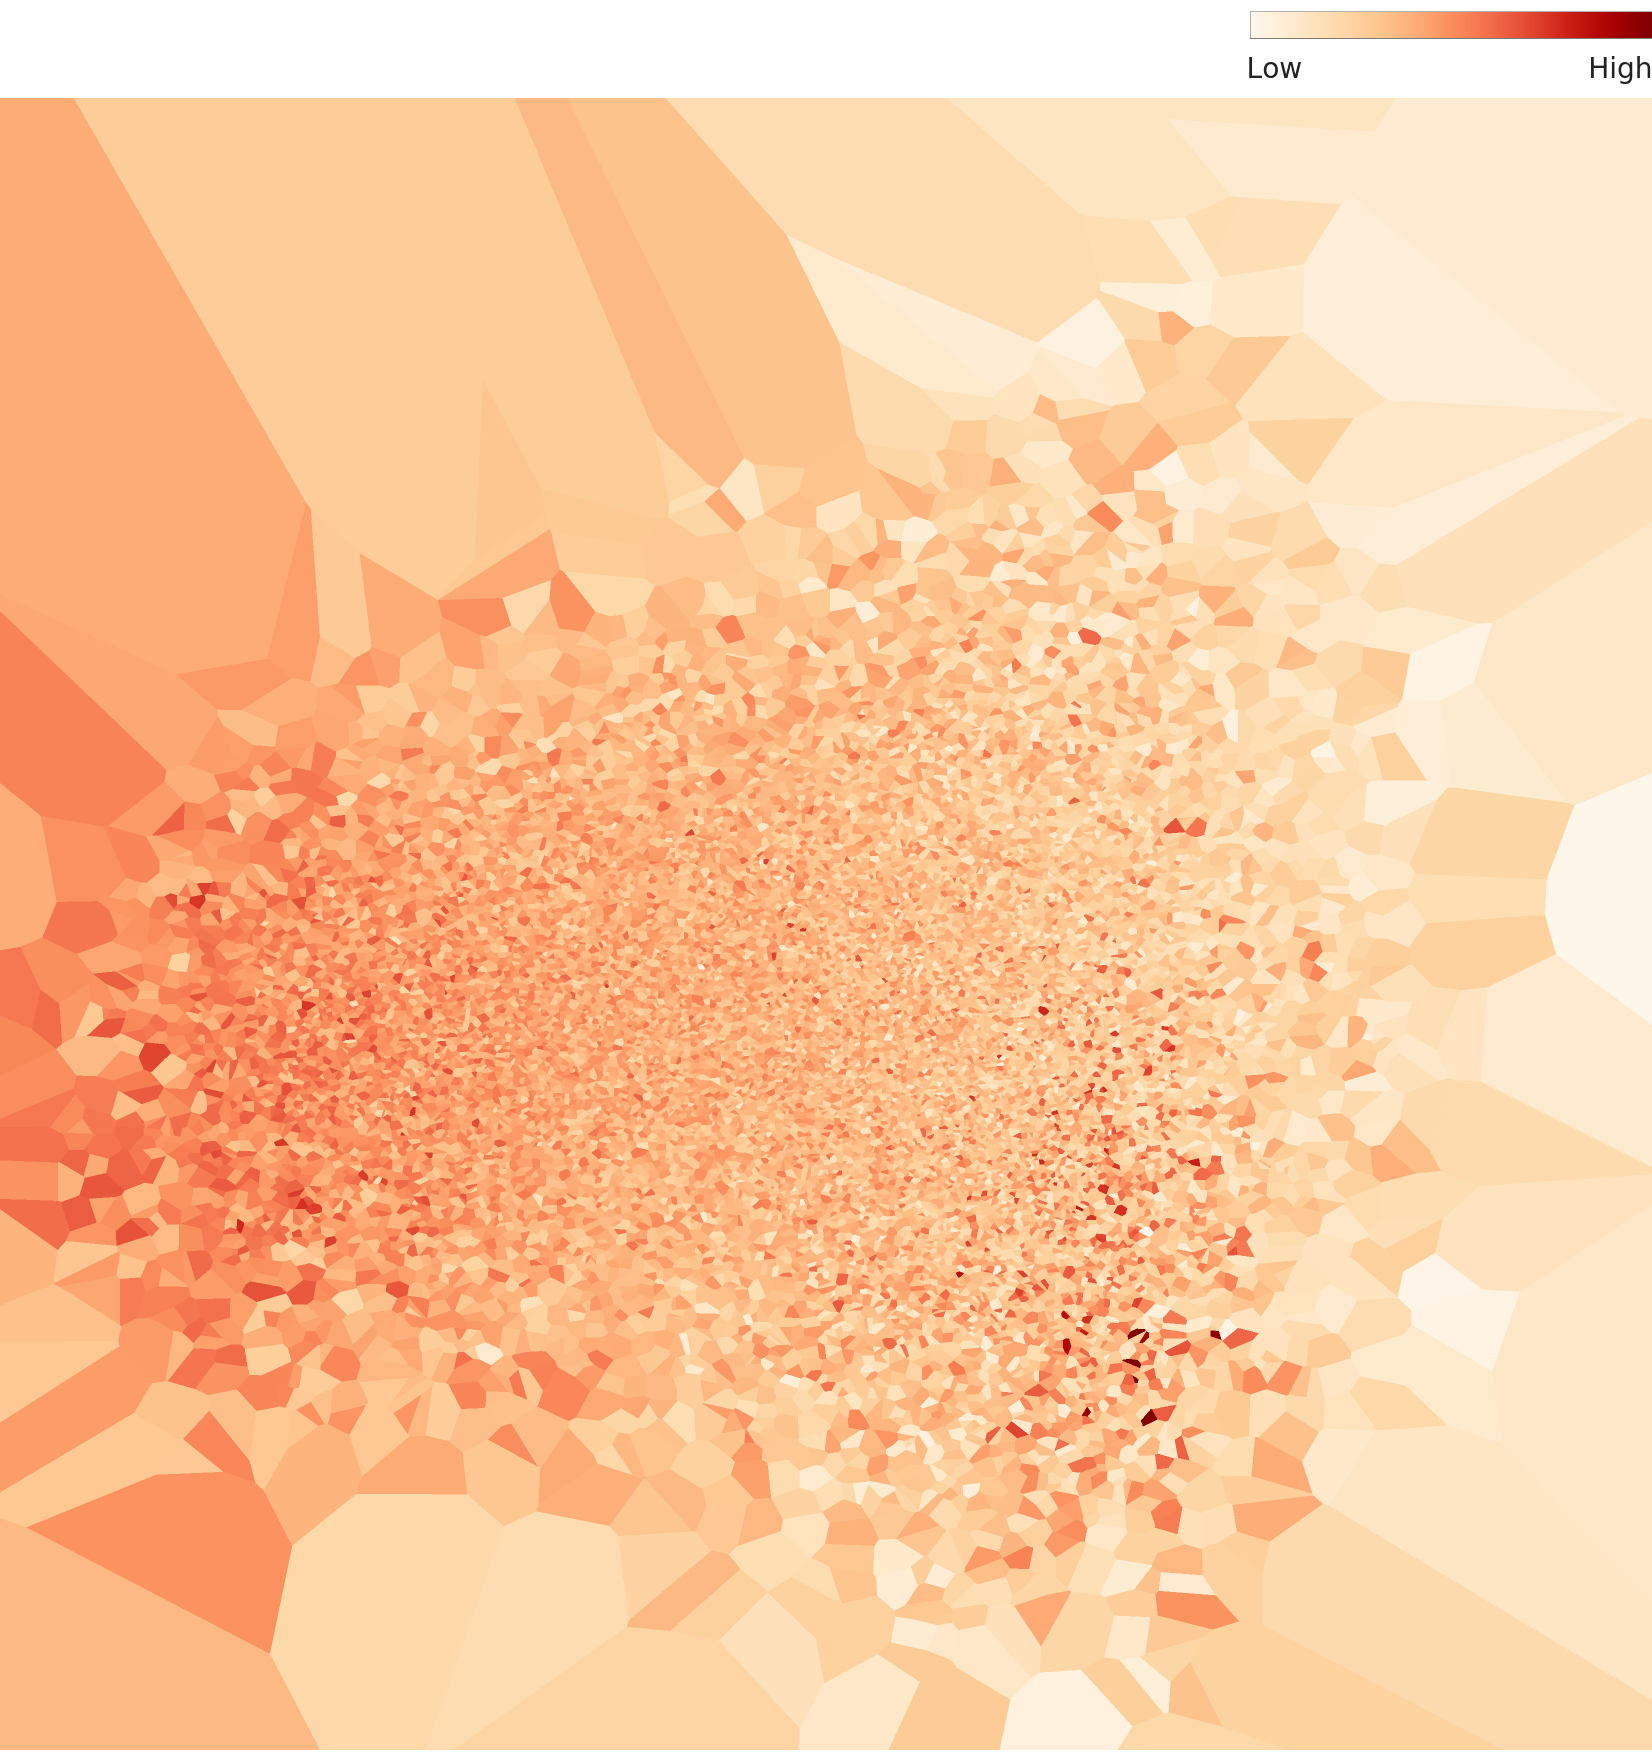
▲ L3 density heatmap — cutting dimensions by 95% sharpens the density contrast. (Same data as L2, a different lens.)
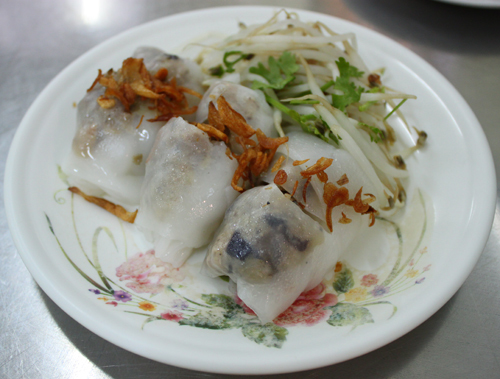
In the per-class density plots, the one to watch most is banh gio. Its main body is faintly spread out, but set apart from it sits a small, dark point, like an isolated island. That isolated node is exactly the image that is effectively the same photo as a banh beo — examined in detail in the next section. Banh trang nuong still shows the narrowest, darkest core, while banh chung shows the widest spread.
 Density
Actual
Density
Actual
 Density
 Actual
▲ L3 per-class density plots. Banh gio's node, set apart from its main body, is the visual evidence of the duplicate label.
Cutting 95% of the dimensions preserves the topology while sharpening the signal. So a uniform class like banh trang nuong is pushed further to the extreme, while diverse classes like banh chung and banh tet stay spread wide. But the banh gio–banh beo duplicate remains, at L2 and at L3 alike. That it isn't resolved by dimensional optimization is the strongest evidence that this is not a problem of the lens (the model) but a problem baked into the data itself.
Real-World Impact — Three Cracks
Let's translate the diagnosis into "so what actually happens if you train an AI on this data." 30VNFoods has three cracks, in order of how strongly they show up.
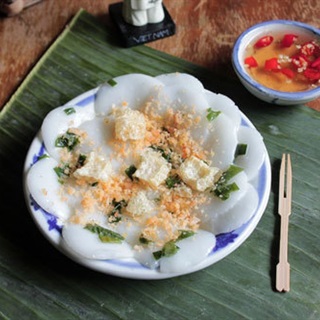
Crack ① One plate, two labels
Place Banh gio_427 from the banh gio folder next to Banh beo_434 from the banh beo folder, and the two are effectively the same photo. The same blue floral plate, the same banana-leaf liner, the same red sauce bowl on the right, the same wooden fork on the left, even the "VIETNAM" sign in the background — all match. Yet one is labeled banh gio and the other banh beo, two different ground truths. One of them is wrong.

So what: a classifier is supposed to learn "the boundary that separates banh gio from banh beo," but when the very same photo sits in both classes at once, it cannot learn that boundary. The model learns "banh gio = banh beo," and the accuracy of both classes falls together. A noise label like this can destabilize a class's training with just a single pair; if several such pairs are hidden in the data, they erode the trustworthiness of the whole dataset.
Crack ② Photos where the food isn't the subject
Open the lowest-density images at L3 and the common thread is clear. The labels are correct, but the food isn't the subject of the frame. The 61-dimensional specialized lens is more sensitive to this kind of context contamination than L2, so banh mi and chao long newly appeared on the low-density list.

A baby in pink fills 70–80% of the frame. The banh chung is a small prop in hand.
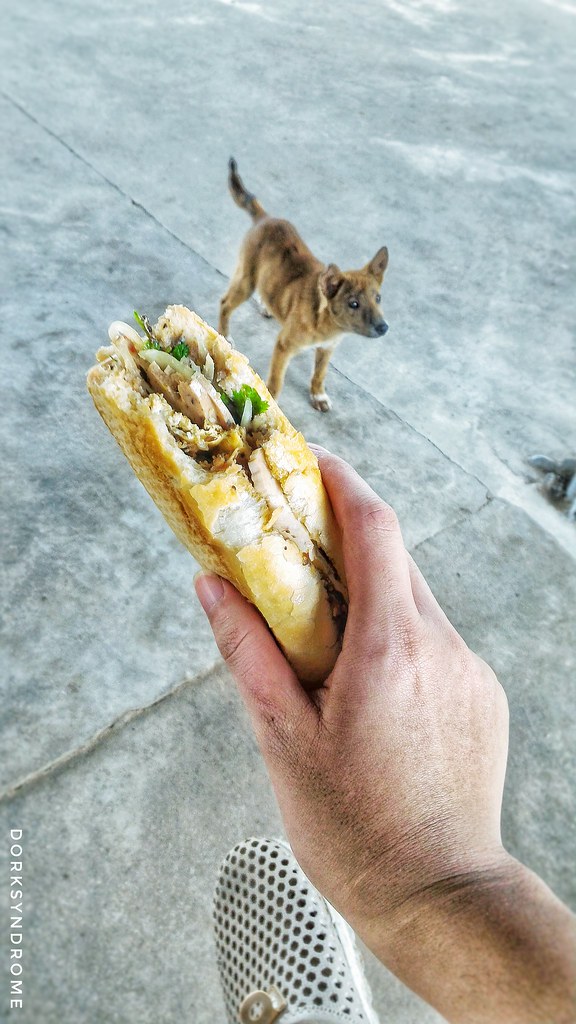
Behind the banh mi in hand, a dog and concrete floor take up 60%. A street lifestyle shot.
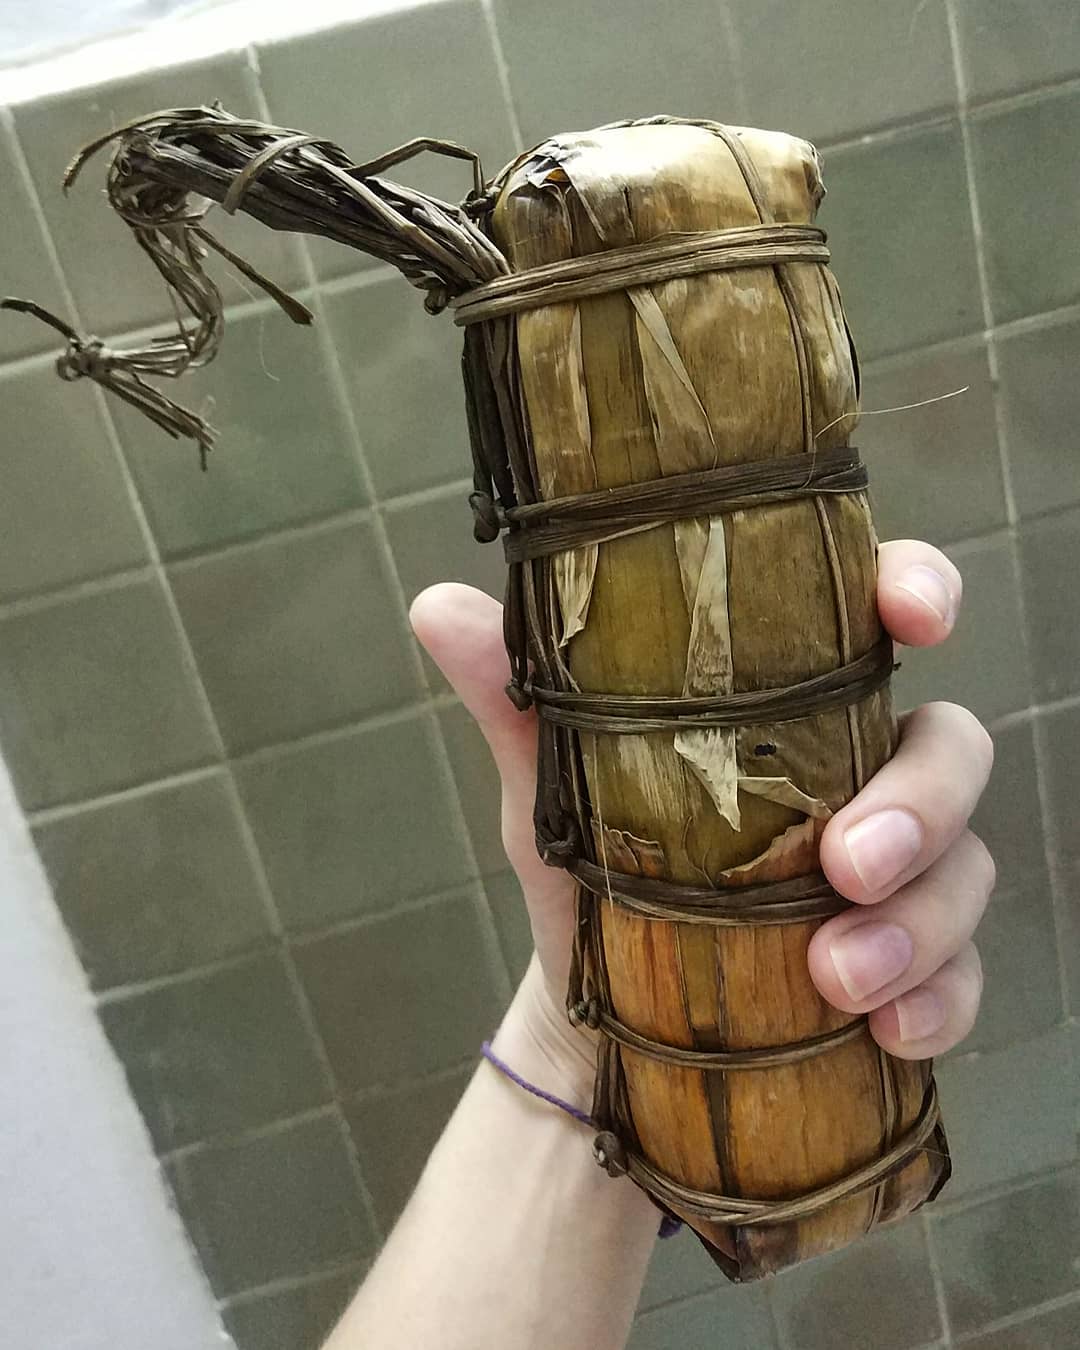
Wrapped whole in leaves and tied with string, against a tiled wall. The food itself is invisible.
▲ Three lowest-density L3 outliers. The labels are right, but the food is not the visual subject.
So what: train on photos like these and the model learns spurious associations such as "baby's face → banh chung" or "dog and concrete → banh mi." Accuracy on clean food photos drops, and the model mistakes images dominated by a person or a background for the food in question. These images aren't necessarily ones to delete outright — they are a signal to first decide whether the label definition is "the food itself" or "a scene in which the food appears."
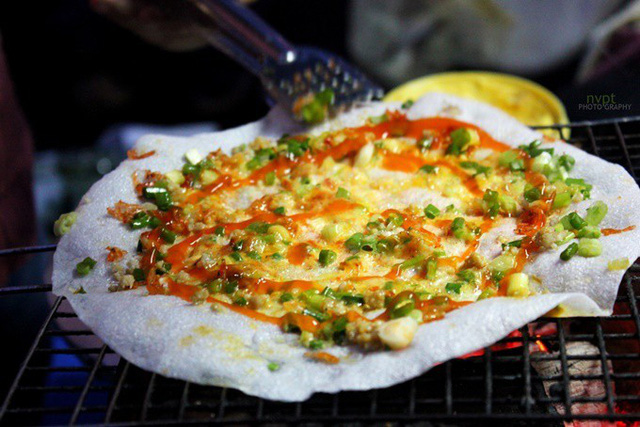
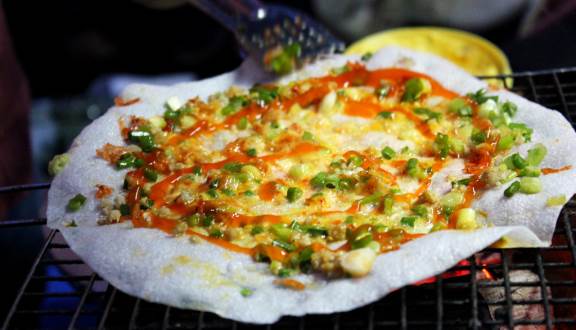
Crack ③ The banh trang nuong that was always one scene to the AI
The top 5 highest-density images at L3 are all banh trang nuong. Their density values, 2.53–2.60, far outpace every other class. Open the actual images and the reason is obvious. A charcoal grill at a night stall, a round rice paper, tongs, chili sauce, scallion topping — nearly the same composition repeats. Some photos even carry the same photographer's watermark, hinting at a collection concentrated among a few stalls and shooters.
Night grill + round rice paper + tongs
Nearly identical framing, lighting, and toppings
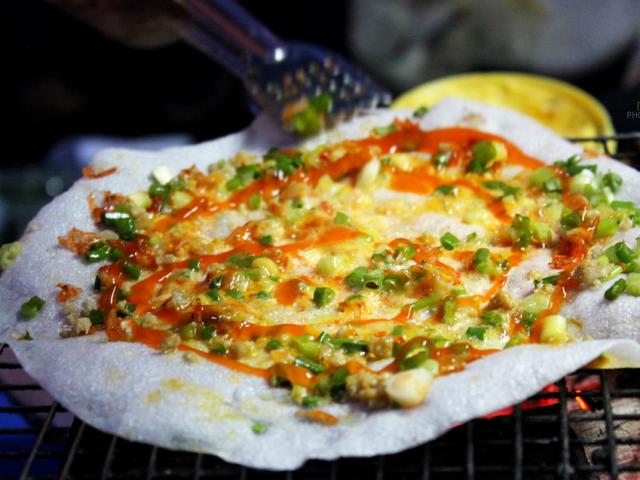
A slightly wider crop, but the same template
▲ Banh trang nuong's top high-density L3 samples. To the AI, banh trang nuong is effectively one scene.
So what: the model overfits to a single template — "a round shape over a night grill." A banh trang nuong shot in daylight, packaged, or shown in cross-section is the same food, yet the model fails to recognize it. When within-class variance is lacking, performance collapses in services that must handle the variety of real-world photos, such as automatic tagging in a delivery app or a calorie-estimation app.
Conclusion — A Small Dataset's Big Lesson
At 17,581 images, 30VNFoods is about one-eighth the size of a Korean food dataset (around 150,000 images) in the same food domain. It is easy to assume that a smaller dataset is cleaner, and indeed its L1 integrity was solid. But viewed through the L2 and L3 lenses, the cracks specific to a small dataset stood out all the more sharply. Duplicate labels, context contamination, single-source concentration — all are problems that become pronounced precisely because, when fewer images are gathered, each one carries more weight.
| Metric | 30VNFoods (#42, this story) | Korean Food (#59) |
|---|---|---|
| Classes | 30 | 150 |
| Total images | 17,581 | 150,507 |
| Avg per class | 586 | ~1,003 |
| Source | Kaggle (Vietnamese street & home food) | AI Hub (Korean food) |
| Signature cracks | Duplicate labels · context contamination · single source | See the #59 diagnostic |
※ Since #42 does not expose an overall score through its public API, we do not make a score-to-score comparison. The table above compares scale and structure. For the score distribution across DataClinic datasets, see the dataset statistics story.
From an AI-Ready data standpoint, the prescription for 30VNFoods is clear. First, find and remove cross-class duplicate images by embedding similarity (and correct the labels of pairs like banh gio ↔ banh beo); next, re-define the label scope for photos where the food isn't the subject, then reclassify or filter them; and for a class skewed toward a single scene, like banh trang nuong, reinforce diversity with photos from other times of day, compositions, and sources.
More numbers don't make good data, and fewer numbers don't make bad data. What matters is what each individual image is teaching the model. DataClinic's L1·L2·L3 lenses make that "what" something you can see with your own eyes.
References
- 1.quandang. (2023). Vietnamese Foods — 30 Vietnamese Food Categories Image Dataset (30VNFoods). Kaggle. kaggle.com/datasets/quandang/vietnamese-foods
- 2.DataClinic. (2025). DataClinic Diagnosis Report #42: 30VNFoods. DataClinic. dataclinic.ai/report/42 — Primary source for all visualizations in this article (collage, mean images, density plots, PCA).