Korean Food Story — The Broth Culture AI Discovered
"Guk-mul-do eop-da" — literally "there isn't even broth," but its real meaning is "there's absolutely nothing" or "not a single penny." In Korean culture, broth (guk-mul) represents the most basic thing one should share, the minimum unit of a meal. This single idiom captures the essence of Korean cuisine.
The traditional Korean table is built on a triangular structure of bap (rice) + guk (soup) + banchan (side dishes). Galbitang, samgyetang, doenjang-jjigae, miyeok-guk... No matter how simple the meal, at least one bowl of soup is considered proper Korean dining etiquette. It is no coincidence that a large proportion of the 150 classes in this Korean food dataset are soup-based dishes. And as we will see later, this fact is faithfully reflected in AI as well.
The global spread of K-pop and K-dramas (the Korean Wave, or Hallyu) has ignited explosive interest in Korean food. Scenes of grilling samgyeopsal with soju, or cooking a late-night bowl of ramyeon, are now familiar to fans worldwide. In an era where a single Netflix drama can multiply global search volume for a particular Korean dish by dozens of times, Korean food categories in food-recognition AI are no longer optional.
🌍 A Guide for Those New to Korean Food
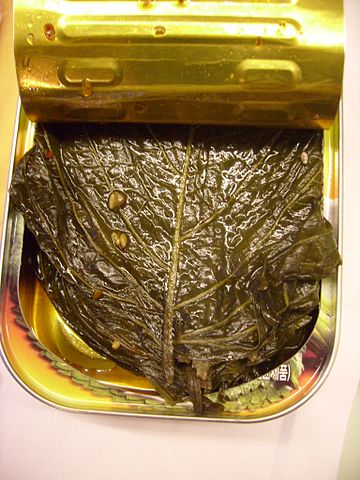
- • Banchan (Side Dishes) — Small dishes served alongside the main course, typically 3 to 10 per meal. This is why items like pickled perilla leaves (kkaennip-jangajji) may look unfamiliar when plated individually.
- • Broth Culture (Guk-mul Culture) — Soups, stews, and hot pots are essential to Korean meals. This is exactly why general-purpose AI splits Korean food into two clusters.
- • Seasonal Foods — Songpyeon is eaten only during Chuseok (Korean Thanksgiving). The repetition of half-moon shapes and pastel colors in standardized photos makes it the "most typical" food for AI.
- • Cooking State — Samgyeopsal (pork belly) includes raw (pink), grilling (smoky), and cooked (brown) images all in the same class. This is the structural reason it produces the most outliers.
🤖 For AI Researchers: Why Korean Food Data Is Fascinating
Korean food image recognition is like compressing several hard problems in computer vision into a single dataset.
- Fine-grained Classification at Its Extreme — Mul-naengmyeon (cold broth noodles) and bibim-naengmyeon (spicy mixed noodles) are both naengmyeon, but the presence or absence of broth makes their appearance completely different. Doenjang-jjigae and kimchi-jjigae share similar bowl compositions but differ in color. This is why ImageNet-level general models fall short.
- Intra-class Variance Imbalance — Songpyeon (very low intra-class variance) vs. Gimbap (very high intra-class variance): even when the number of images per class is nearly identical, learning difficulty varies dramatically. A balanced dataset does not necessarily guarantee balanced learning.
- The Power of Domain Specialization — Two clusters in the general-purpose lens (L2) merge into one under the domain-specialized lens (L3). The feature space created by a Korean-food-specific backbone has a fundamentally different structure.
Executive Summary
This post presents the key insights from the quality diagnostic report #59 of the Korean Food Image dataset, conducted using Pebblous DataClinic.
The Korean Food Image dataset is a large-scale Korean cuisine vision dataset comprising 150 classes and 150,507 images, ranging from galbitang to fried chicken. The DataClinic overall diagnosis resulted in a quality score of 71 (Fair). In terms of class balance, image counts range from a minimum of 992 to a maximum of 1,125 with a standard deviation of just 16.8 — a textbook-level distribution.
At L2 (feature space analysis) using Wolfram ImageIdentify Net V2 (1,280 dimensions), a pattern was discovered where general-purpose AI splits Korean food into two clusters: soup-based foods and dry foods. In contrast, at L3 (domain-optimized analysis, 129 dimensions), these two clusters merge into a single Korean food space.
The most "typical" food was Songpyeon, while the most heterogeneous images were found in Gimbap. Data Diet (deduplication) is recommended for classes with low visual diversity.
Dataset Overview — A World of 150 Korean Foods
The Korean Food Image dataset is a large-scale Korean cuisine vision dataset comprising 150 classes and 150,507 images, spanning from traditional Korean dishes to modern street food. Provided by AIHub with commercial use permitted, it can be immediately applied to AI-based food recognition service development.
The 150 classes faithfully capture the landscape of Korean food culture. Below is a breakdown by major categories:
Yukgaejang, Doenjang-jjigae, Muguk
Sirae-giguk, Bugeoguk, etc.
Jajangmyeon, Jjamppong
Kongnamul-gukbap, etc.
Galchi-gui, Godeungeo-gui
Dakgalbi, etc.
Mechuri-al-jangjorim, Gaji-bokkeum
Ganjang-gejang, etc.
Yeolmu-kimchi, Kkakdugi
Baechu-kimchi, etc.
Mandu, Rabokki
Fried Chicken, etc.
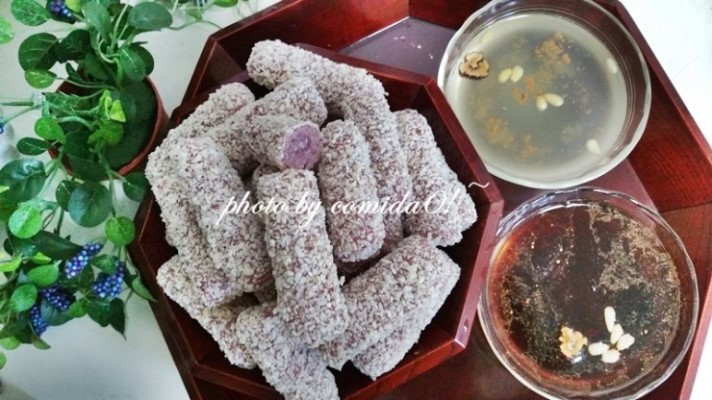
Hangwa, Yaksik
Injeolmi, etc.
Hongeo, Kkomak
Jeonbok-gui, etc.
Each food name carries the context of Korean food culture. Meongge (sea squirt) is one of the hardest foods for AI models to recognize due to its distinctive briny smell and vermilion color. Gwamegi is a winter seasonal delicacy from the Pohang region that is visually difficult to distinguish from ordinary dried fish. Fried chicken is a foreign food reinterpreted Korean-style. How these "domain-knowledge-dependent foods" affect data quality is the key point of this diagnosis.


▲ Class mean images — pixel-averaged results from approximately 1,000 images per class. The sharper the image, the higher the visual consistency. Note that Gyeongdan and Kkultteok appear sharp, while Gimbap is relatively blurry.
Overall Diagnosis — Quality Score 71 (Fair)
An overall score of 71 falls in the "Fair" grade, which ranks among the top tier of large-scale public datasets. The fundamental strength of class balance is excellent, but insufficient visual diversity in certain classes limits the score. With commercial use permitted, this is a production-ready dataset for real-world AI development.
| Diagnostic Item | Result | Notes |
|---|---|---|
| Class Balance | ✅ Good | Std. dev. 16.8 (textbook-level) |
| Missing Values | ✅ Good | 0.07% (103 / 150,610 images) |
| Channel Composition | ✅ Good | 99.42% RGB |
| Image Resolution | ⚠️ Fair | 121×91px ~ 6,048×4,032px |
| Intra-class Diversity | ⚠️ Fair | Dense duplicates in Songpyeon, Mul-naengmyeon, etc. |
| Commercial Use | ✅ Permitted | Source: AIHub |
Level 1: Basic Quality Check — A Pixel-Level Health Exam
Level 1 examines image integrity, missing values, class balance, and pixel statistics. It is the foundational health check that DataClinic runs first upon receiving raw data.
✅ Class Balance: Textbook Level
Image counts across the 150 classes range from a minimum of 992 to a maximum of 1,125, with a standard deviation of just 16.8. This is a distribution so well-balanced it appears deliberately engineered. For comparison, the WikiArt dataset has a class balance standard deviation in the thousands. This means the risk of model bias toward specific foods during training is extremely low.
However, numerical balance does not guarantee learning balance. 1,003 Songpyeon images and 1,003 Gimbap images are the same count, but nearly all Songpyeon images look alike while Gimbap looks completely different from every angle. Intra-class variance is explored in greater detail at L2/L3.
⚠️ Image Resolution: A Wide Spectrum
Image dimensions range widely from a minimum of 121×91px to a maximum of 6,048×4,032px. This reflects collection from diverse sources, from smartphone snapshots to professional DSLR photography. Preprocessing to standardize input resolution is essential for AI training. The minimum 121×91px images require upscaling for standard models like ResNet-50 (which expects 224×224px input).
✅ Channel Composition: Stable
99.42% of all images are standard 3-channel RGB. 0.33% include an alpha channel (RGBa), and 0.25% are in other formats, meaning only 0.58% of images require alpha channel removal or RGB conversion during preprocessing.
✅ Missing Values: Negligible
Out of the original 150,610 images, 103 (0.07%) were missing, leaving 150,507 images for the actual diagnosis. 0.07% is an exceptionally low rate by the standards of large-scale web-crawled datasets.
🔍 What Mean Images Reveal
Level 2: Korean Food Through a General AI's Eyes — Two Worlds
Level 2 extracts features from the entire dataset using Wolfram ImageIdentify Net V2 (1,280-dimensional feature vectors) and analyzes their distribution. This neural network is a general-purpose image recognition model not specialized in the food domain — essentially viewing the photos through the eyes of a foreigner unfamiliar with Korean cuisine.
🌊 Two Clusters: Soup vs. Dry
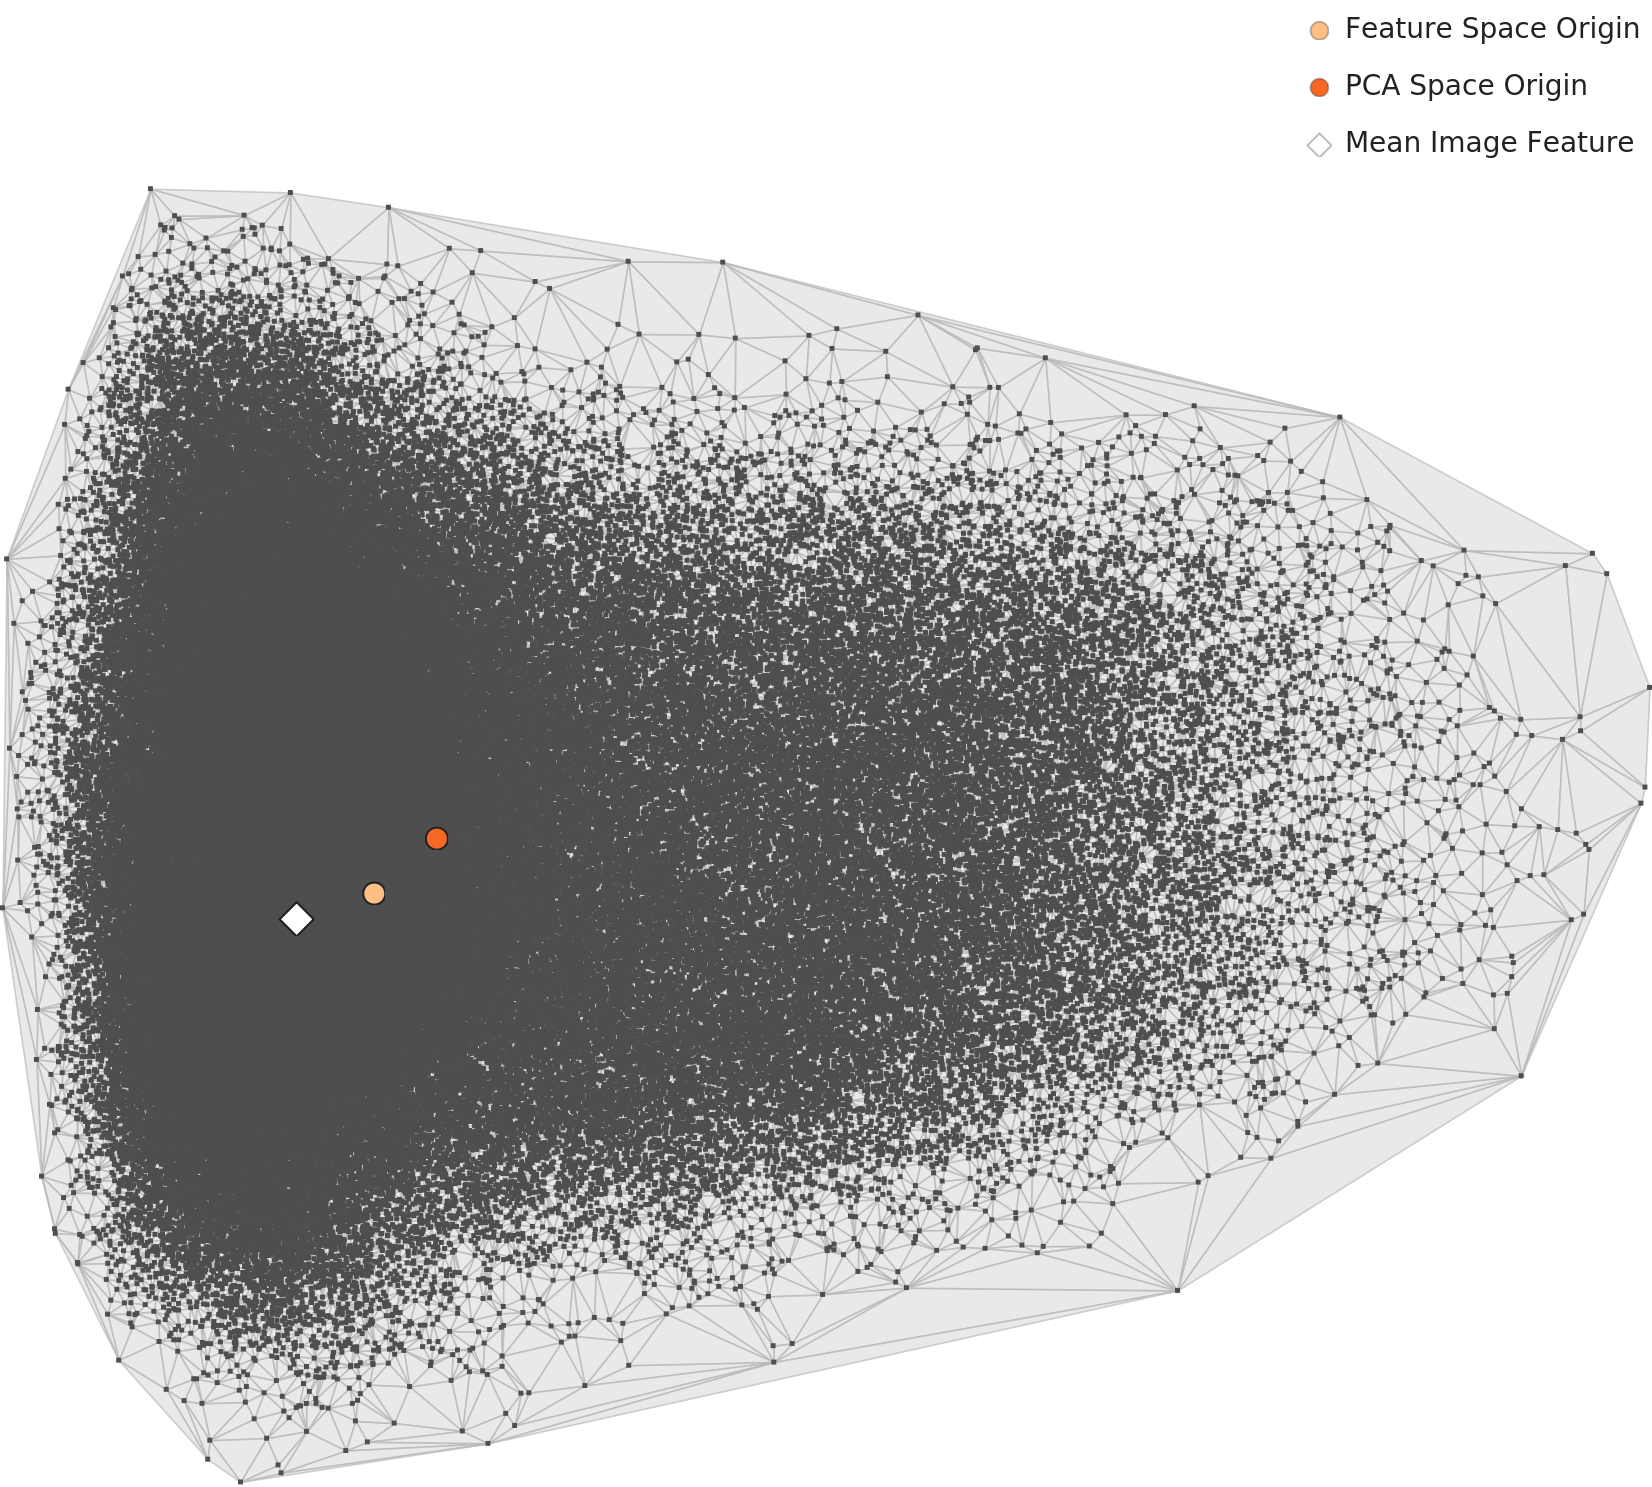
PCA and density topography analysis reveal that under a general-purpose lens, Korean food splits into two distinct clusters. Interpreted with domain knowledge:
This is direct evidence that Korea's distinctive "broth culture" is faithfully reflected in image data. Even without knowledge of recipes or ingredients, general-purpose AI naturally learns to distinguish "with broth / without broth" based purely on visual structure.
The PCA visualization below shows the distribution of per-class mean features:
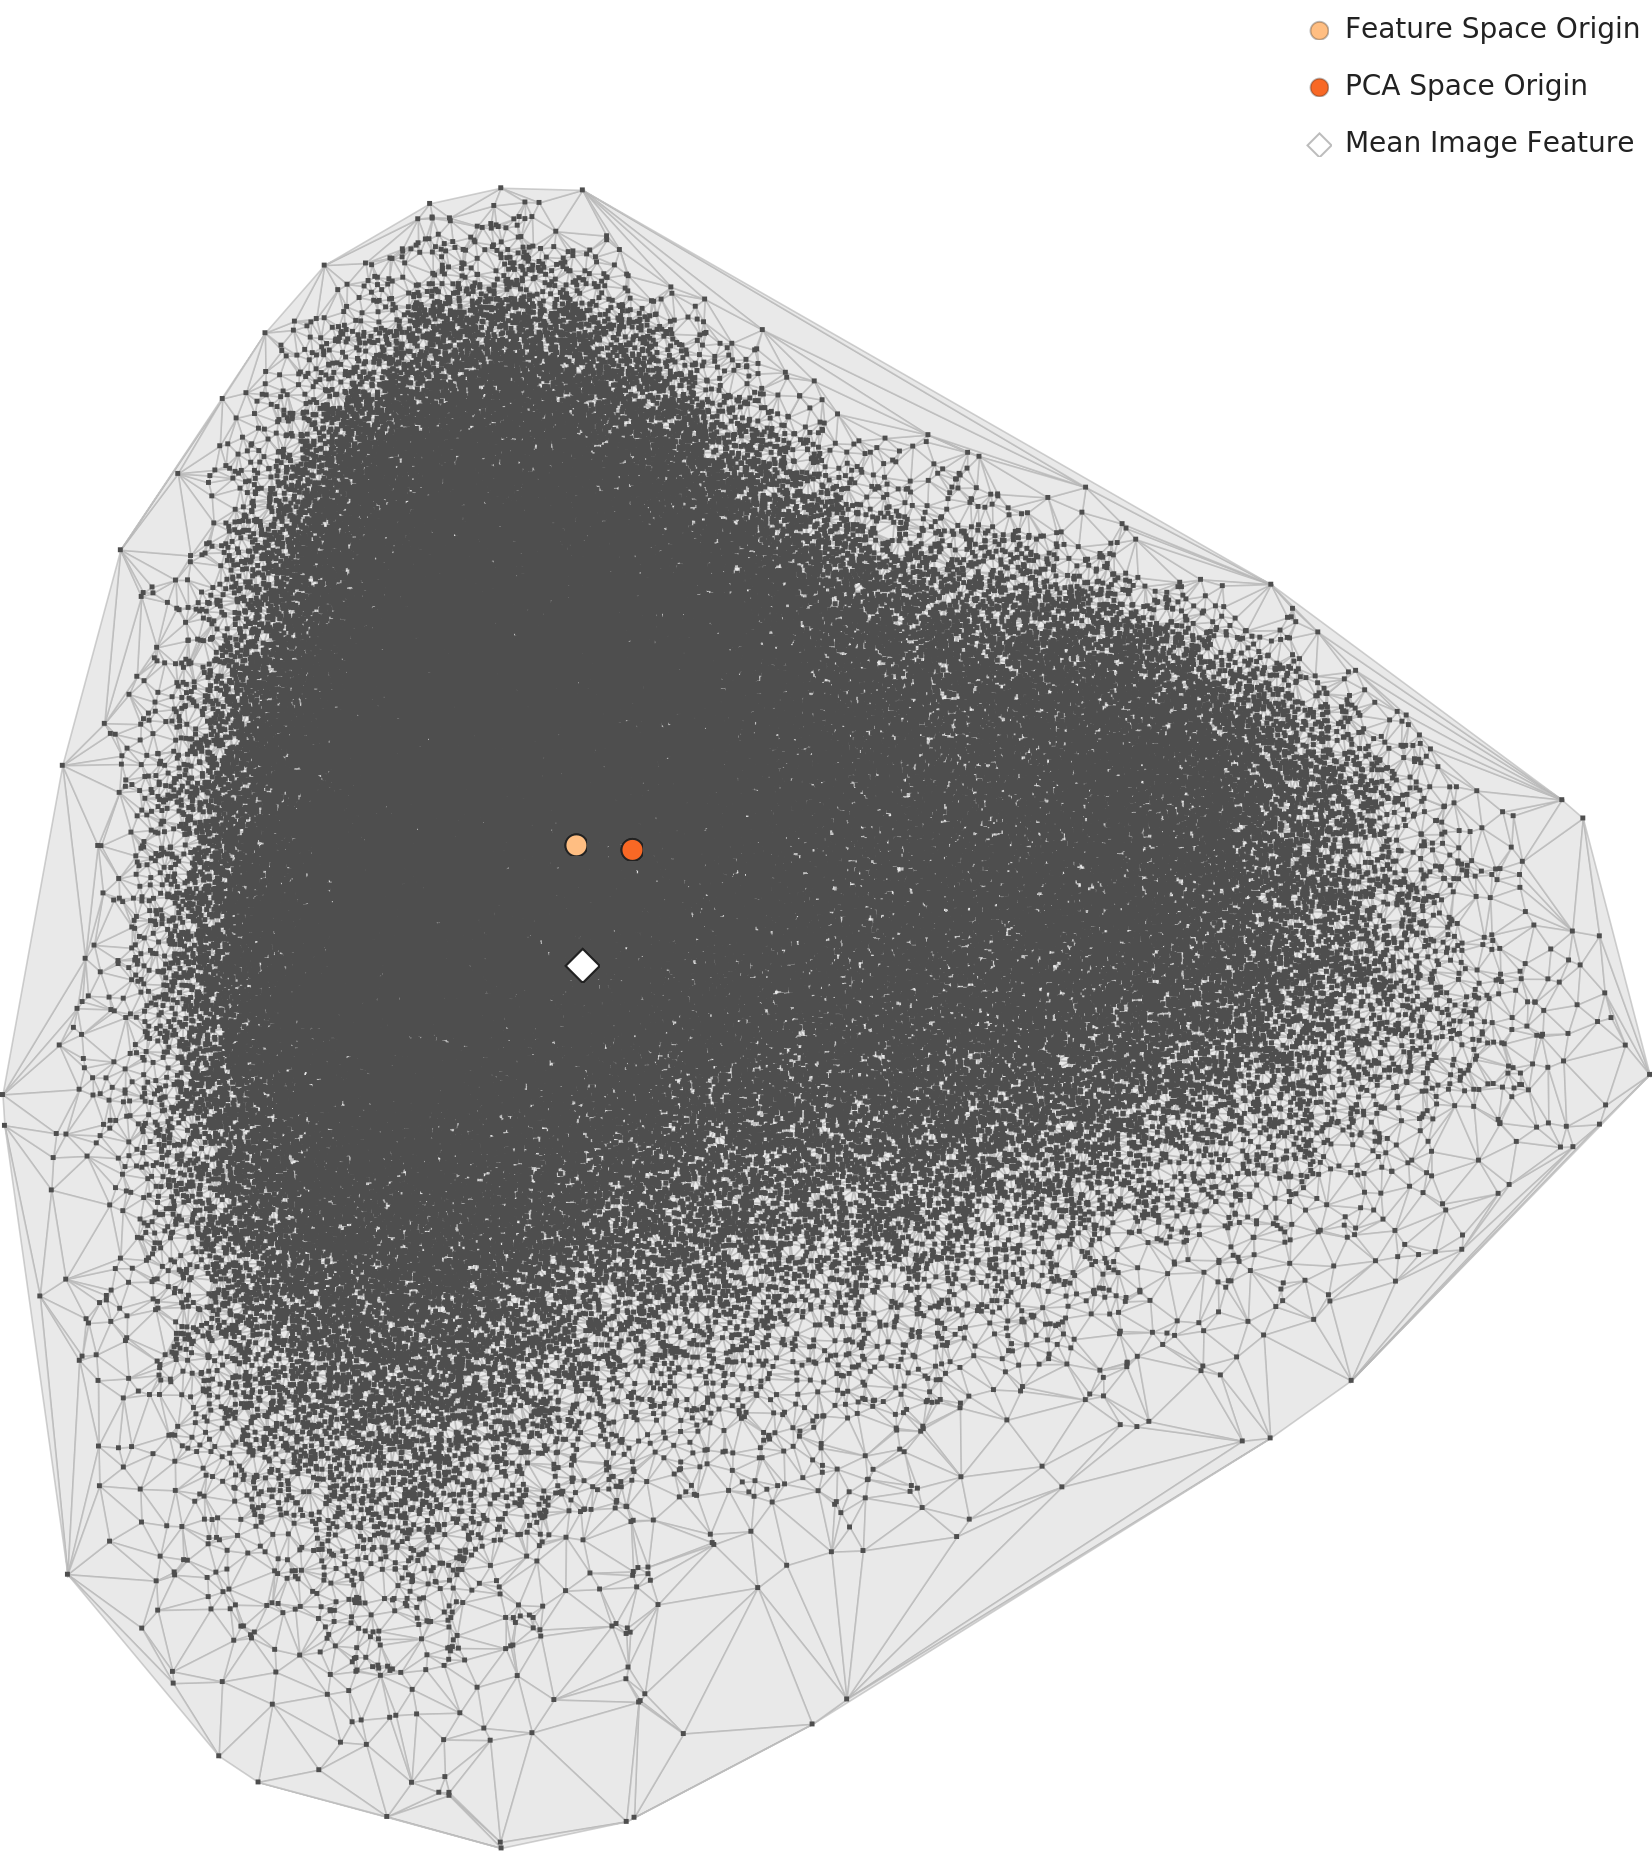
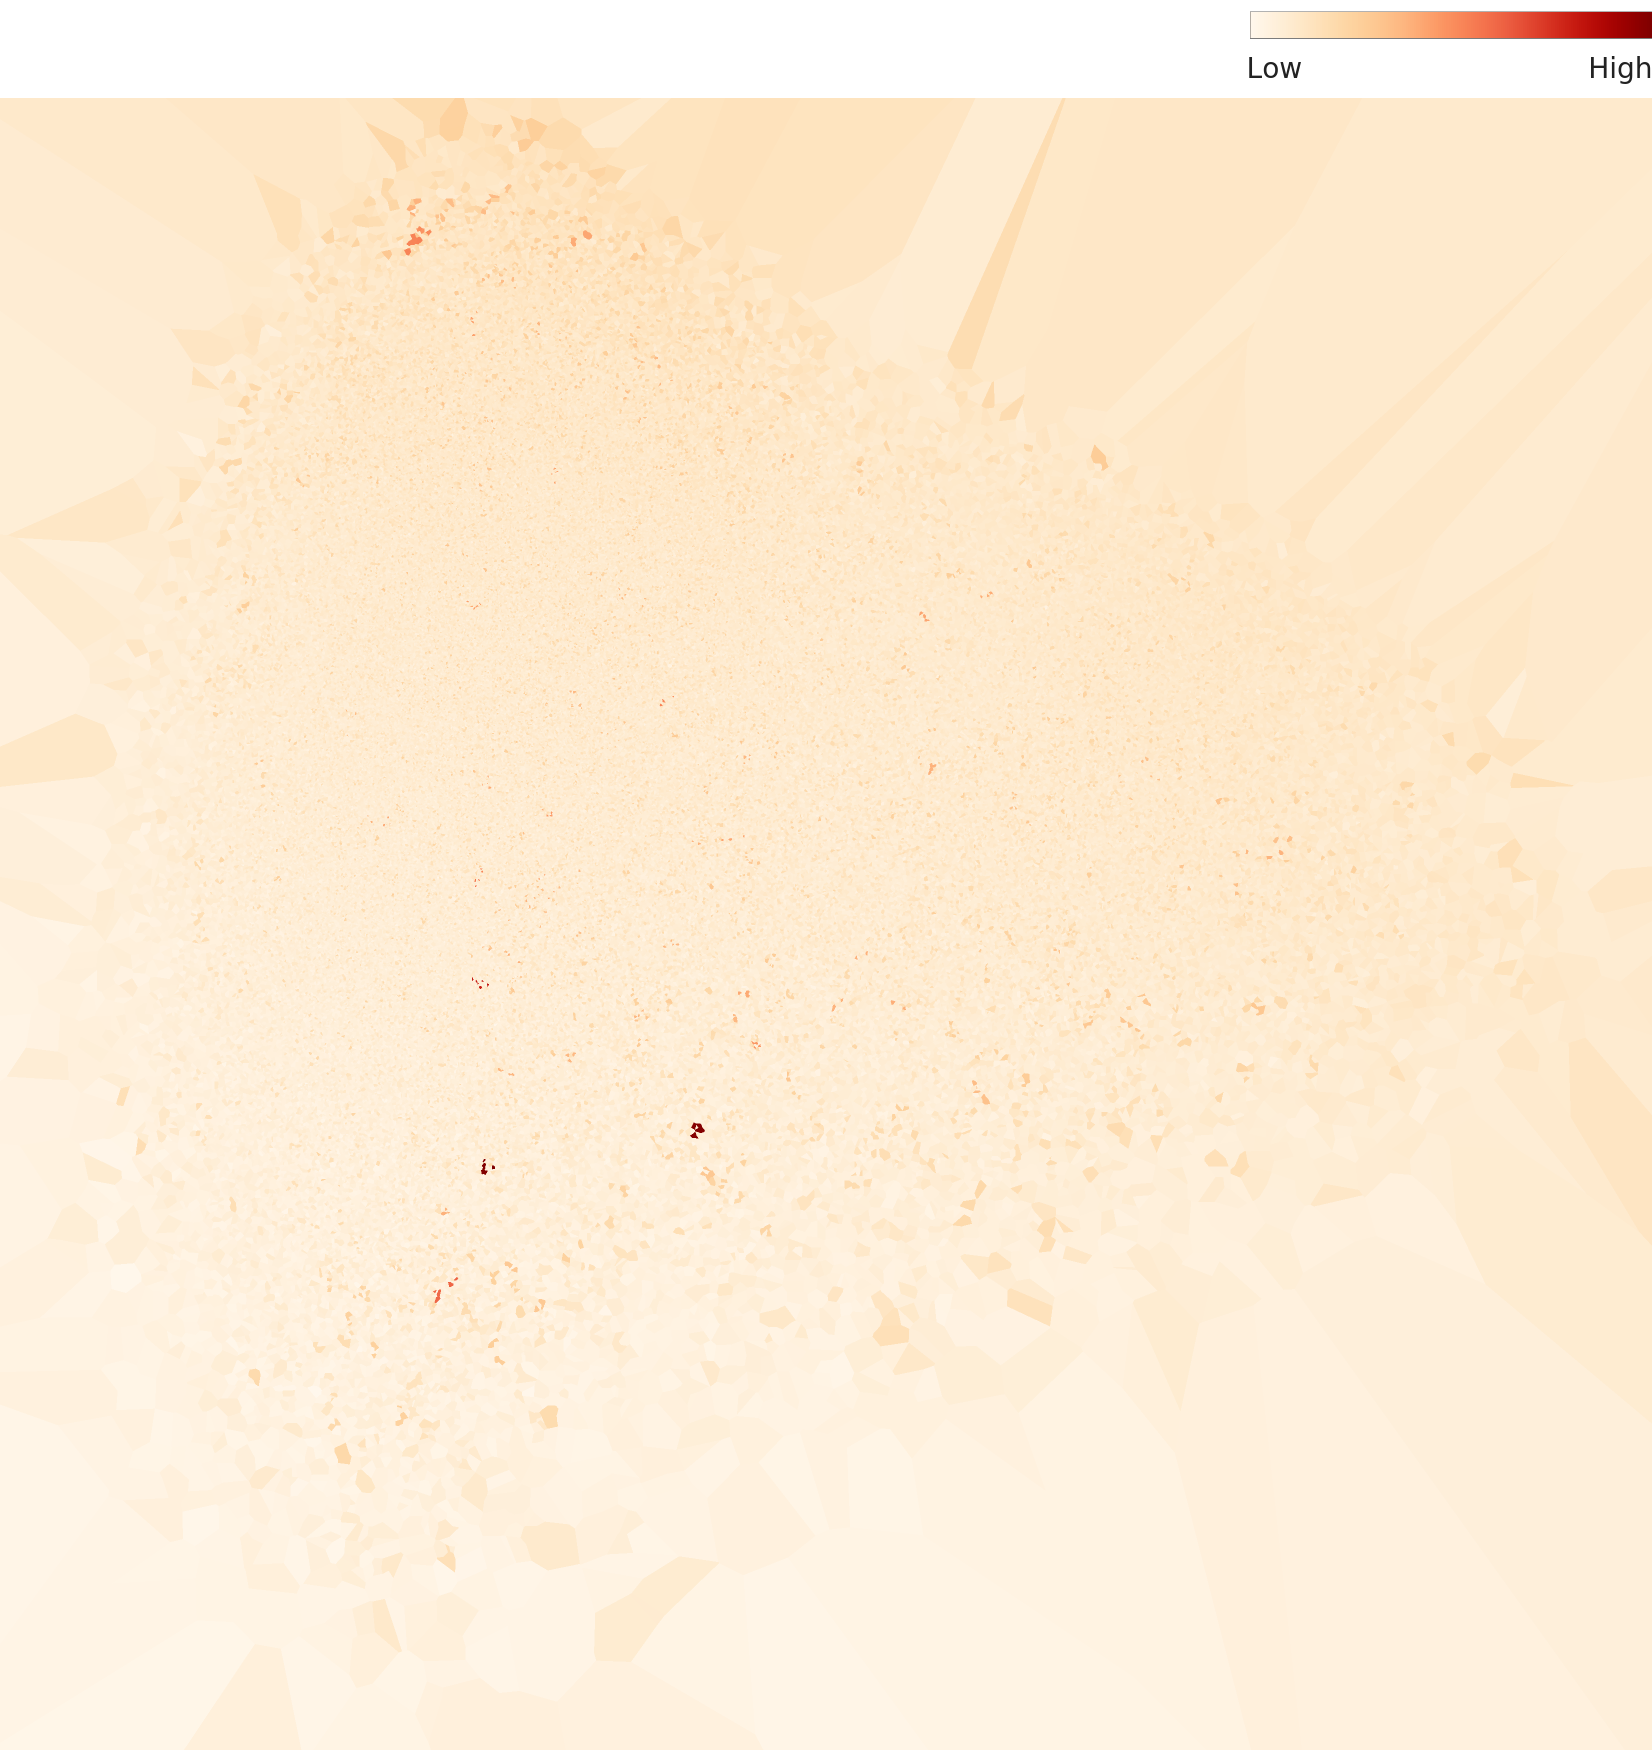
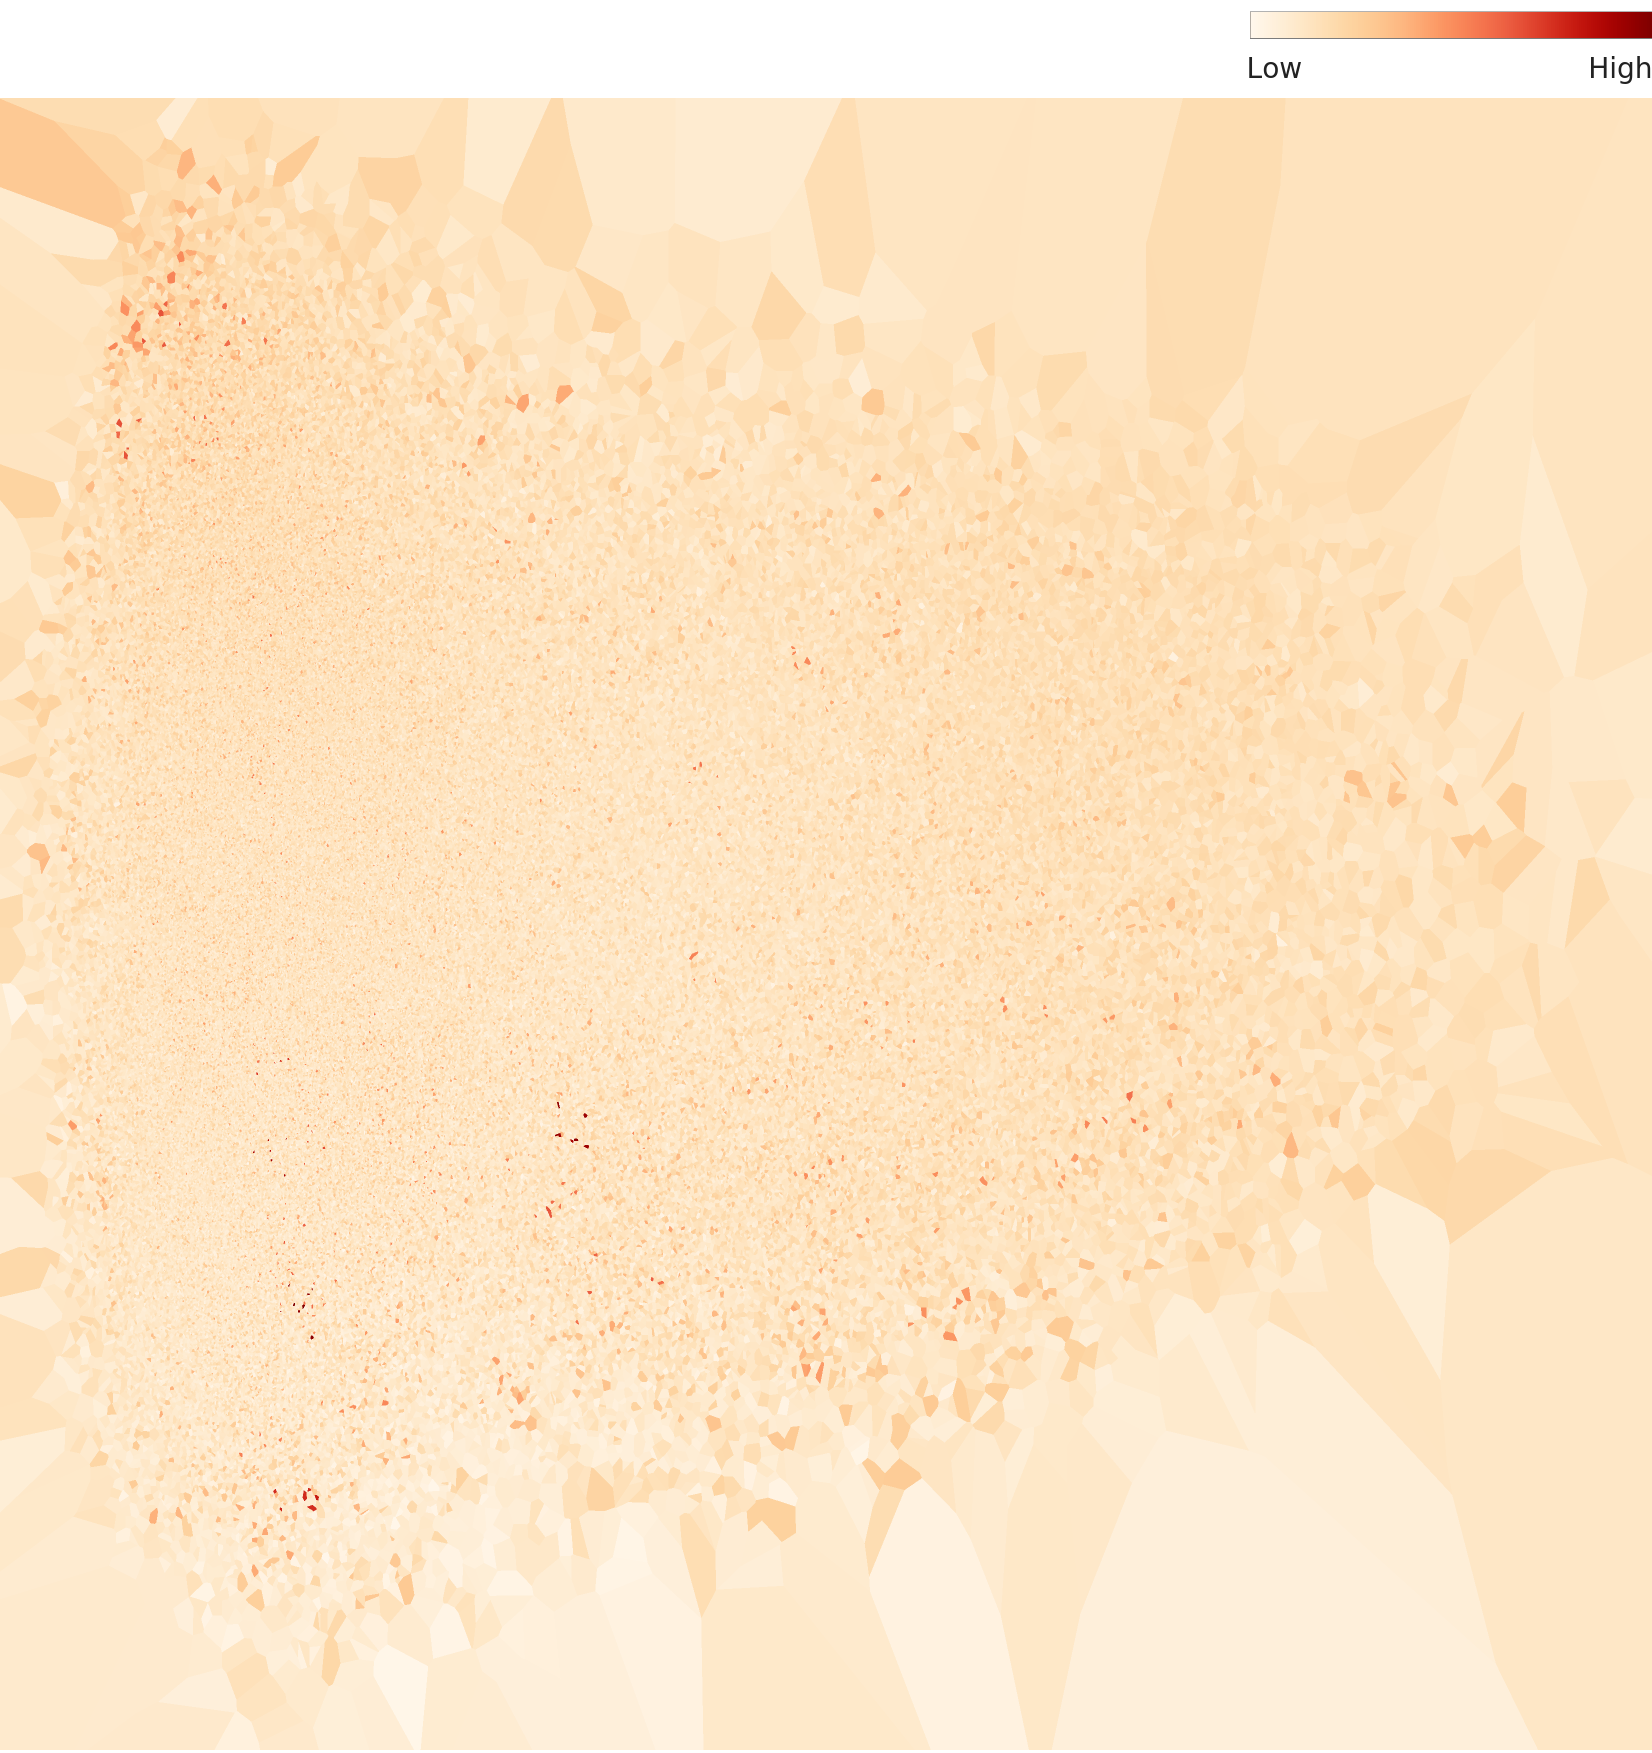
📊 Distribution: Bell-shaped — Healthy
The overall density distribution maintains a bell-shaped curve. Most images are concentrated in the center of the feature space, with a small number of outliers distributed at both extremes. This is a healthy data structure approximating a normal distribution.
🔬 Per-class Density Comparison — Portraits of 6 Foods
Comparing per-class density distributions reveals dramatically different patterns for each food. The 6 classes below show the spectrum from high density (visually consistent) to low density (diverse):
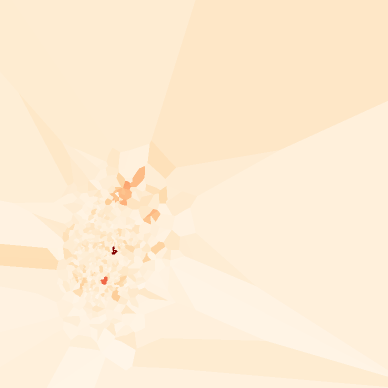


▲ L2 per-class density distributions. The narrower and taller the peak, the more visually consistent the food; the broader and lower, the greater the photographic diversity.
Level 3: The Korean Food Specialist Lens — Two Worlds Become One
Level 3 applies a 129-dimensional lens specialized for the Korean food dataset, built on top of Wolfram ImageIdentify Net V2. It re-examines the data not through a general-purpose perspective, but through the eyes of a Korean cuisine expert.
🎯 Cluster Unification: Two → One
The most notable change is that the two clusters visible at Level 2 merge into one. Where the general-purpose lens responded to the visual structure of "broth present vs. absent," the domain-specialized lens prioritizes the shared identity of "Korean food."
This has important implications for real-world AI service development. When building a Korean food recognition model, using a general-purpose backbone as-is may treat soup-based and dry foods as entirely different domains. However, using a Korean-food-specialized feature extractor creates a more unified recognition space.
The unified distribution can be seen in the L3 PCA visualization:
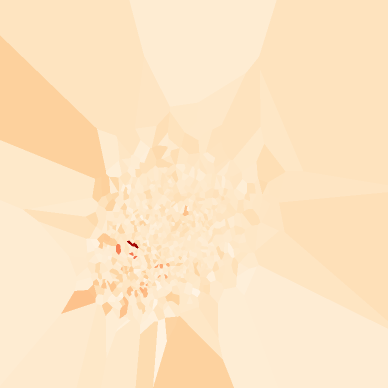
📈 Distribution: Still Bell-shaped — Stable
Even under the domain-specialized lens, the overall distribution maintains its bell shape. The fact that the healthy distribution form is preserved even as clusters merge demonstrates that domain specialization is meaningful representation learning, not mere compression.
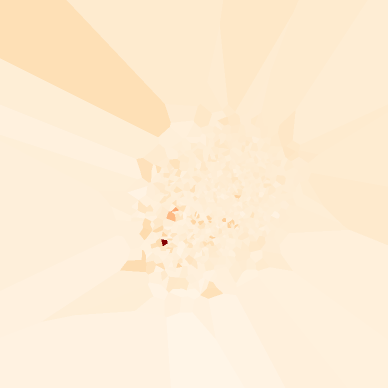
🔬 L3 Per-class Density — What the Domain Lens Changed
How did per-class distributions change from L2 to L3? Let us examine the notable changes across 6 classes:


▲ L3 per-class density distributions. Compared to L2, the overall clusters have merged, but the intra-class variance patterns are preserved according to each food's inherent characteristics.
Outlier Analysis — Why Songpyeon Is the Most "Typical"
DataClinic identifies the most typical samples (high density) and the most atypical samples (low density) in the dataset through density-based outlier analysis.
🏆 High-density Samples — What AI Considers "Typical Korean Food"
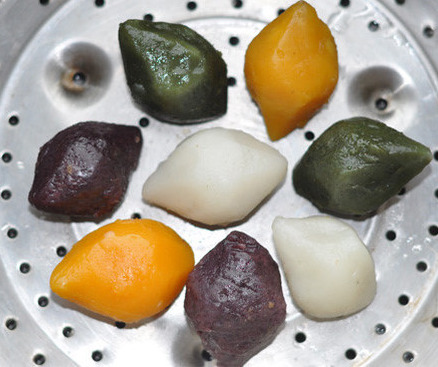
High-density samples — images located at the very center of the feature space — are predominantly Songpyeon and Mul-naengmyeon. This is no coincidence.
Songpyeon is a Korean Chuseok (Thanksgiving, 15th day of the 8th lunar month) holiday food, made by filling rice flour dough with sesame, red bean, or chestnut, shaping it into a half-moon, and steaming it on pine needles. It is an extremely visually consistent food:
- Uniform half-moon silhouette
- Standardized color palette of white, pink, and green
- Neatly arranged composition on plates
- Often simple backgrounds with uniform lighting
From AI's perspective, Songpyeon is a "predictable" image. Since nearly all Songpyeon photos share similar feature vectors, their density is measured as high. Paradoxically, this "typicality" also makes it the number one candidate for Data Diet.


⚠️ Low-density Samples — The Identity of Outliers
The top-ranking low-density outliers are Gimbap, Sundae, Kkaennip-jangajji, and Samgyeopsal. Their common trait is highly variable shooting angles, plating styles, and cooking states:
- Gimbap — cross-section view (revealing pickled radish and egg fillings) vs. side view (cylindrical exterior). Often confused with Japanese maki rolls by foreigners, but Gimbap is an entirely different food using sesame-oil-coated rice and Korean-style ingredients. This visual diversity is the cause of its low density.
- Samgyeopsal — pink before grilling vs. brown after grilling. The color difference is extreme.
- Kkaennip-jangajji (pickled perilla leaves) — plated alone on a dish vs. used as a wrap. A classic banchan dilemma.
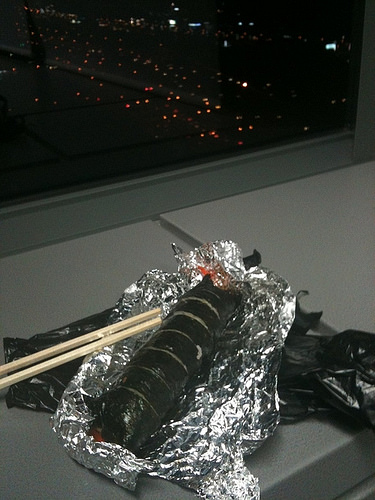
- Sundae (Korean blood sausage) — whole form vs. sliced cross-section view.
↔️ Most Different Pair: Hangwa vs. Gimbap
Similarity analysis revealed the most distant image pair in the feature space. The Hangwa and Gimbap combination is representative. Hangwa is a golden-brown, dry, and standardized confectionery form, while Gimbap is a black-and-white cylinder with a colorful cross-section — polar opposites in color, texture, and shape.
Hangwa (Korean traditional confectionery) is made from rice, beans, and honey, and is an indispensable food at ceremonies such as weddings and ancestral rites. Its neat appearance and standardized form make it a high-density food for AI. Gimbap, on the other hand, produces a completely different image depending on the shooting angle.
Hangwa (Korean confectionery)
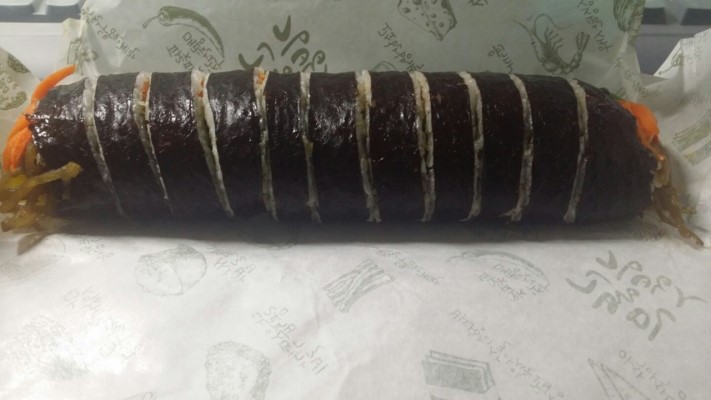
Gimbap
▲ The most distant pair in feature space. Polar opposites in color, texture, and shape.
💡 Practical Use of Outlier Analysis
Recommendations — A Data Diet Prescription
DataClinic recommends a Data Diet for this dataset. Despite the textbook-quality class balance, the quality score of 71 (Fair) is held back by insufficient visual diversity in certain classes.
🥗 What Is a Data Diet?
A Data Diet is not simply about reducing data. It identifies and removes near-identical images concentrated in high-density regions, helping the model learn more diverse patterns.
- Songpyeon — Dense with half-moon-shaped, pastel-colored images. Supplementing with images of the shaping process, rustic styles, and varied lighting conditions would make the model more robust in real-world environments.
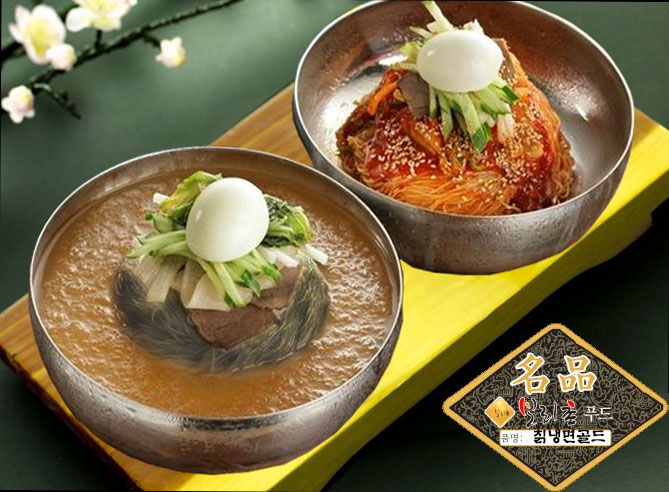
- Mul-naengmyeon — Repetitive center-of-bowl compositions. Supplementing with diverse angles and plating styles is recommended.
- High-density classes overall — Ideally, duplicate images should be removed and replaced with images from diverse shooting environments such as restaurants, homes, and street food stalls.
💊 Is Data Bulkup (Augmentation) Unnecessary?
Since the current class balance is excellent, a Diet is more urgent than minority class augmentation. However, atypical seafood classes like Meongge, Gwamegi, and Jeotgal have naturally low visual diversity, so adding images from varied shooting conditions could significantly improve model robustness.
🎯 Key Summary
✅ Class balance: Textbook-level (std. dev. 16.8)
✅ Missing values: 0.07%, negligible
✅ Channel composition: 99.42% RGB
⚠️ Resolution range: Preprocessing standardization needed
⚠️ High-density class duplicates: Data Diet recommended
📈 Expected improvement: 71 → 80s possible after Data Diet
The full diagnostic results and detailed per-class analysis of all 150 classes are available at DataClinic Report #59.
Conclusion — Three Discoveries from 150 Korean Foods in Data
From the diagnosis of Korean Food Image dataset #59, we obtained three key discoveries.
First, broth culture manifests in data. When general-purpose AI (Wolfram ImageIdentify Net V2) learned Korean food, it naturally formed two clusters: soup-based and dry food groups. Without any recipe or ingredient information, purely through visual patterns, it captured the essential structure of Korean food culture. An AI that has never tasted Korean food discovered on its own that "Korean meals always include broth."
Second, domain specialization creates unification, not division. When the Korean-food-specialized lens (L3, 129 dimensions) was applied, the two clusters merged into one. This powerfully demonstrates how domain knowledge reinterprets data. A lens that understands Korean food sees the shared identity of galbitang and samgyeopsal as "Korean food" as more important than their visual differences.
Third, balanced counts do not guarantee balanced learning. Despite a textbook-level class balance with a standard deviation of 16.8, the learning difficulty gap between Songpyeon (extremely low intra-class variance) and Gimbap (extremely high intra-class variance) is enormous. Removing high-density duplicates via Data Diet is expected to raise the score from 71 to the 80s.
📊 Diagnosis at a Glance
| Level | Key Finding | Implication |
|---|---|---|
| L1 | Class balance std. dev. 16.8 | Extremely low risk of biased learning |
| L2 | General AI forms soup/dry 2-cluster split | Possible soup-vs-dry confusion with general backbone |
| L3 | Clusters merge under Korean food lens | Clear benefit of domain-specialized feature extractor |
| Outliers | Songpyeon high density, Gimbap low density | Data Diet target: remove high-density class duplicates |
For more dataset diagnostics and DataClinic use cases, visit dataclinic.ai.