Executive Summary
The L1 pixel histograms, L2 density contours, and L3 cluster distributions that DataClinic generates all have a 1:1 correspondence with the quality measurement (QM) items defined in ISO/IEC 5259-2. This article presents a methodology for directly mapping the actual diagnostic results from three public datasets — ImageNet (1,431,167 images), WikiArt (81,444 images), and SpectralWaste (2,794 images) — to specific QM codes such as Bal-ML, Div-ML, and Rep-ML. Each dataset reveals a distinct failure pattern: scale does not guarantee quality (ImageNet), bias lives in density rather than counts (WikiArt), and small datasets have structural limits (SpectralWaste).
DataClinic L1 automatically covers Com-ML-1, Con-ML-1/3, Bal-ML-1/2/3, and Div-ML-1/2/3. L2/L3 measure Sim-ML-1/2/3, Rep-ML-1, Eft-ML-1/2/3, and Acc-ML-7 using neural network–based analysis. Items that DataClinic does not automatically cover — including Aud-ML, Cur-ML, and Acc-ML-2 (label accuracy) — can be assessed through metadata analysis, visual sample review, and tools such as the C2PA toolkit.
After reading this article, you will be able to open your own DataClinic diagnostic report and immediately identify which ISO 5259 item each metric corresponds to. DataClinic is the measurement instrument for ISO 5259; ISO 5259 is the interpretive framework for DataClinic.
Scale does not guarantee quality
Bal-ML-1 Fail
120 dog breeds / 12% of all classes
Bias revealed through density
Idn-ML-1 Warn
Blanchard effect / 133:1 imbalance
Structural limits of small scale
Com-ML-1 Fail
2,794 images / 19.6:1 imbalance
1 The DataClinic → ISO 5259 Mapping Framework
As established in Part 1, image dataset quality has a two-layer structure: the pixel layer and the task layer. DataClinic's three-level diagnostic system drills into these two layers in sequence — L1 addresses pixels, while L2/L3 capture task-level semantics through embedding space analysis. The fact that both systems point in the same direction means that DataClinic charts can be translated directly into ISO QM codes.
DataClinic Diagnostic Levels ↔ ISO 5259-2 QM Coverage
| Diagnostic Level | What It Measures | ISO 5259-2 QM Items |
|---|---|---|
| L1 — Pixel Statistics | Class count, sample count, missing values, RGB channel distributions, resolution range, per-class image count bar chart | Com-ML-1, Con-ML-1 Con-ML-3, Bal-ML-1 Bal-ML-2 Bal-ML-3, Div-ML-1 Div-ML-2 Div-ML-3 |
| L2 — General-Purpose Embedding | Density distribution, clusters, outliers, and similarity pairs in Wolfram's 1,280-dimensional feature space | Sim-ML-1 Sim-ML-2 Sim-ML-3, Rep-ML-1, Eft-ML-1 Eft-ML-2 Eft-ML-3, Acc-ML-7 |
| L3 — Domain Embedding | Semantic density distribution based on BLIP image-text matching, inter-class semantic drift | Rep-ML-1, Acc-ML-2 (partial), Idn-ML-1 (data source patterns) |
| Not Covered by DataClinic | Direct label accuracy measurement, copyright/license auditing, collection timestamp metadata, portability | Acc-ML-2, Aud-ML-1, Cur-ML-1, Rel-ML-1, Tml-ML-1, Por-ML-1 |
Core Principle
The tall and short bars in DataClinic L1's class bar chart — that is Bal-ML-1 (class balance). A cloud concentrated to one side in L2's density contour — that is Div-ML-2 (cluster diversity). Low-density samples in L3 that carry visual characteristics of a different class — that is Acc-ML-7 (proxy indicator for label anomaly detection). Once you know what DataClinic is showing you, the table above instantly translates it into what ISO 5259 calls it.
Measuring QM Items Not Covered by DataClinic
- Acc-ML-2 (label accuracy) — Extract low-density samples from DataClinic L3 and review them visually. Low density means the sample lies far from the class prototype — making it a prime candidate for a mislabel. Northcutt et al. (2021) used this approach to find 85,870 errors in ImageNet.
- Aud-ML-1 (copyright/license auditing) — Verify per-image provenance signatures using the C2PA metadata toolkit. Especially important for copyright-sensitive datasets like WikiArt.
- Cur-ML-1 (feature currentness) — Extract capture years from image EXIF metadata, or analyze timestamps in the crawl collection logs.
- Sim-ML-1 (duplicate images) — Detect near-identical image pairs using pHash (perceptual hashing)–based similarity. Particularly important for small datasets.
2 ImageNet — Scale Does Not Guarantee Quality
ImageNet provides 732–1,300 samples per class, making it appear numerically balanced. But DataClinic's diagnostic exposes three structural problems beneath that surface. Viewed through the two-layer lens from Part 1, ImageNet's pixel layer is relatively sound — the critical flaws emerge at the task layer. DataClinic's score of 60 (Average) precisely reflects this asymmetry between the two layers.
L2 Density-Based Samples — High Density (Typical) vs Low Density (Outlier)
High Density — Typical Samples (peacock, titi, patas, guenon)


Low Density — Outlier Samples (flute, lens cap, espresso maker, coffeepot)


Source: DataClinic Report #123 — ImageNet. High density: primate and peacock cluster. Low density: kitchen utensils at the embedding space periphery — a proxy signal for Acc-ML-7.
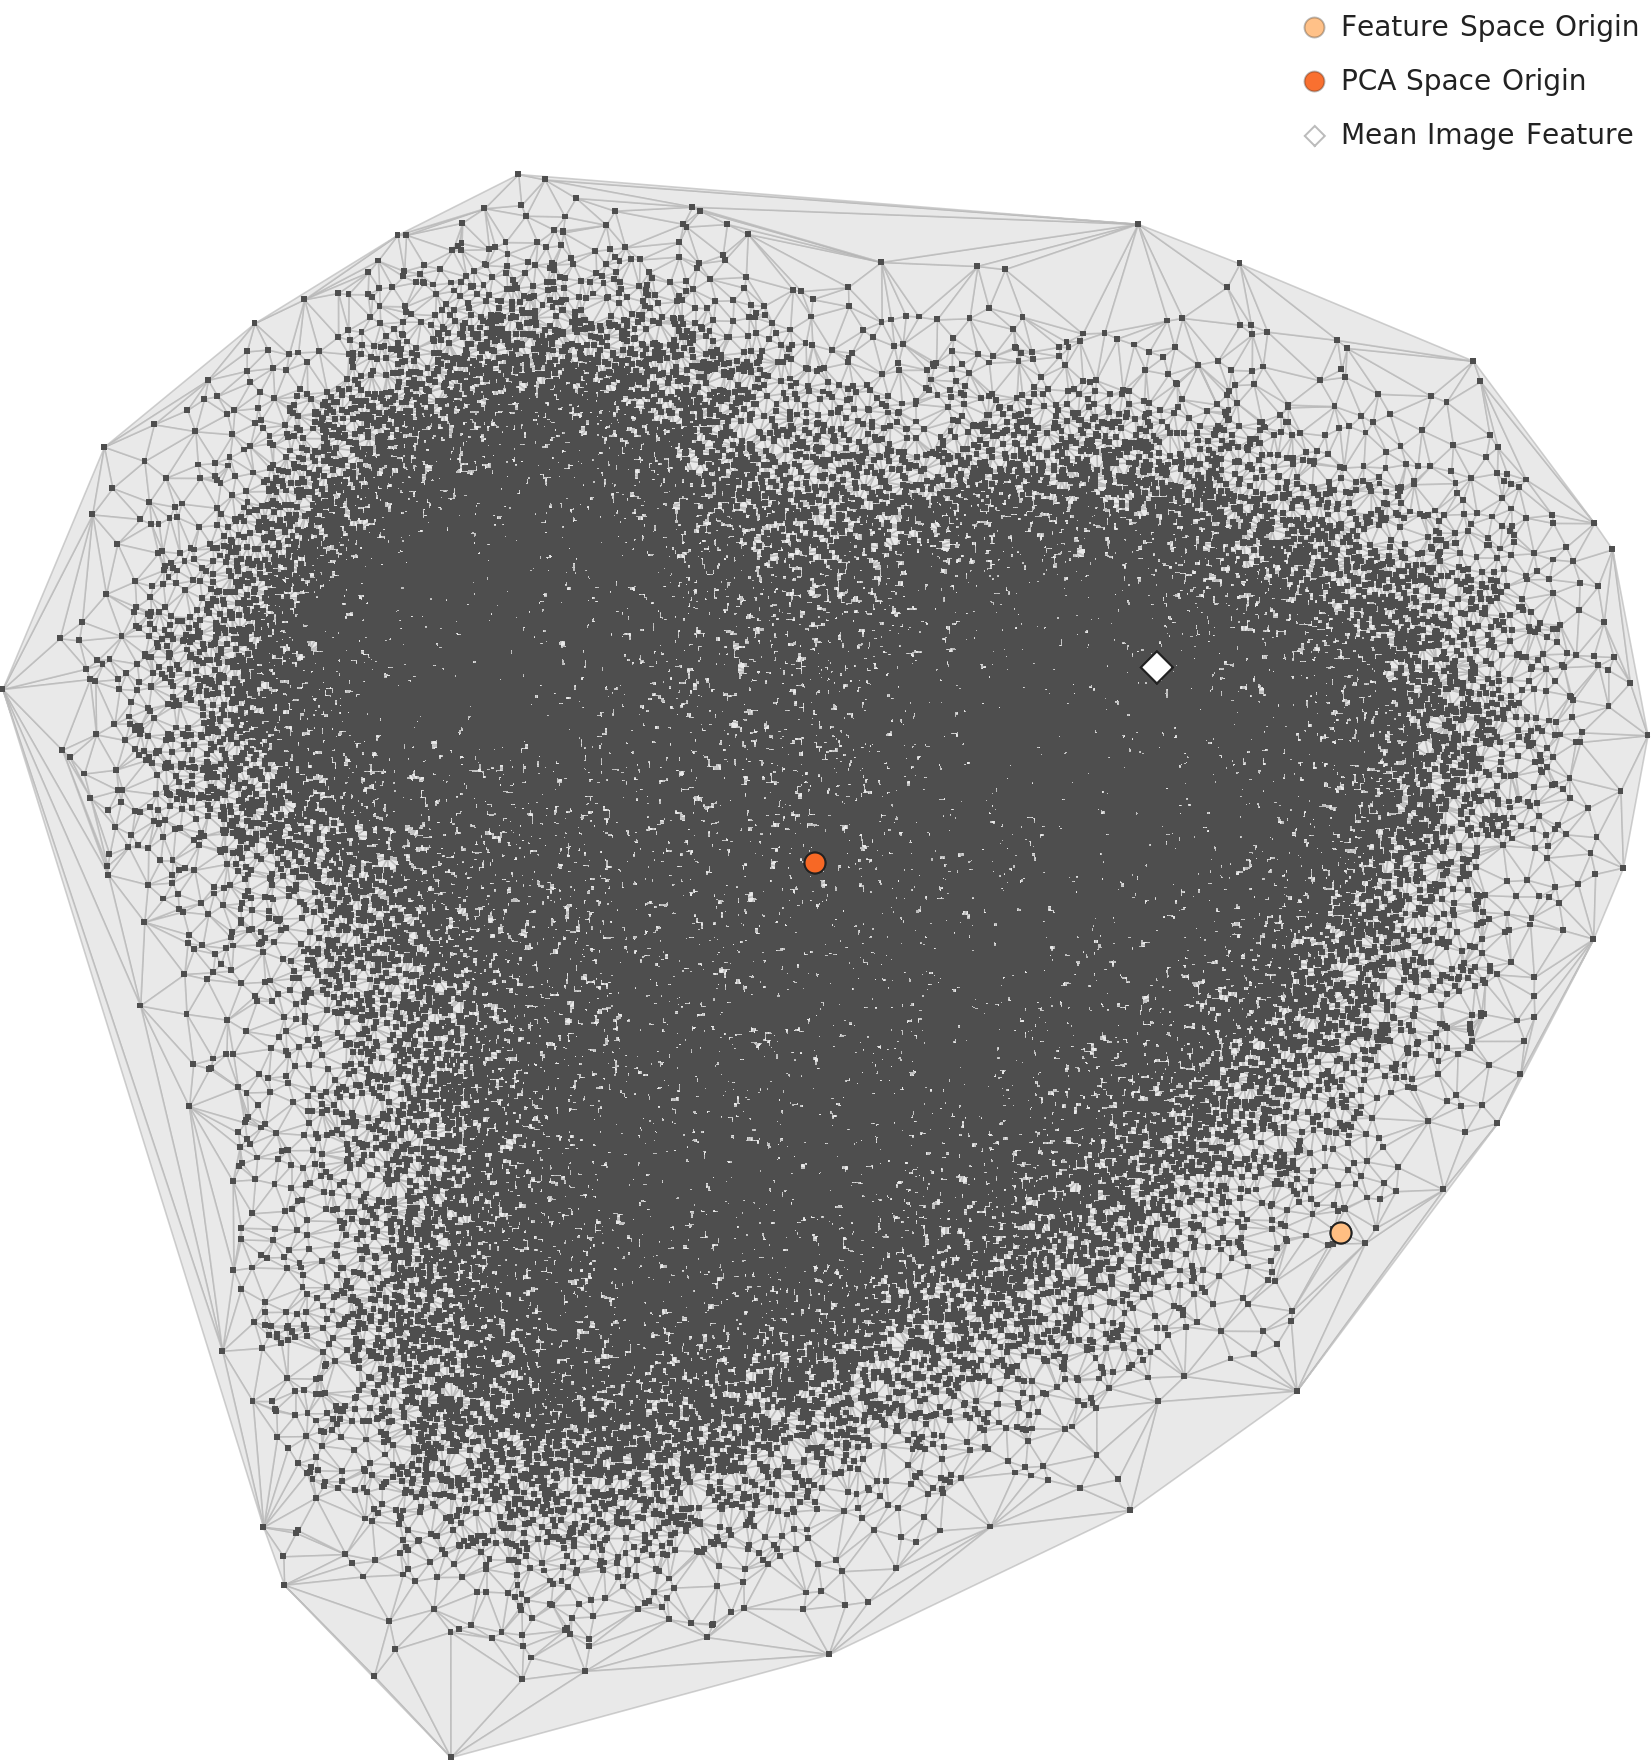
DataClinic L2 — PCA Overall Distribution → Div-ML-2 (Cluster Diversity)
Embedding space under general visual features (L2). The dense primate and bird cluster at the center is a Div-ML-2 (cluster diversity) risk signal.
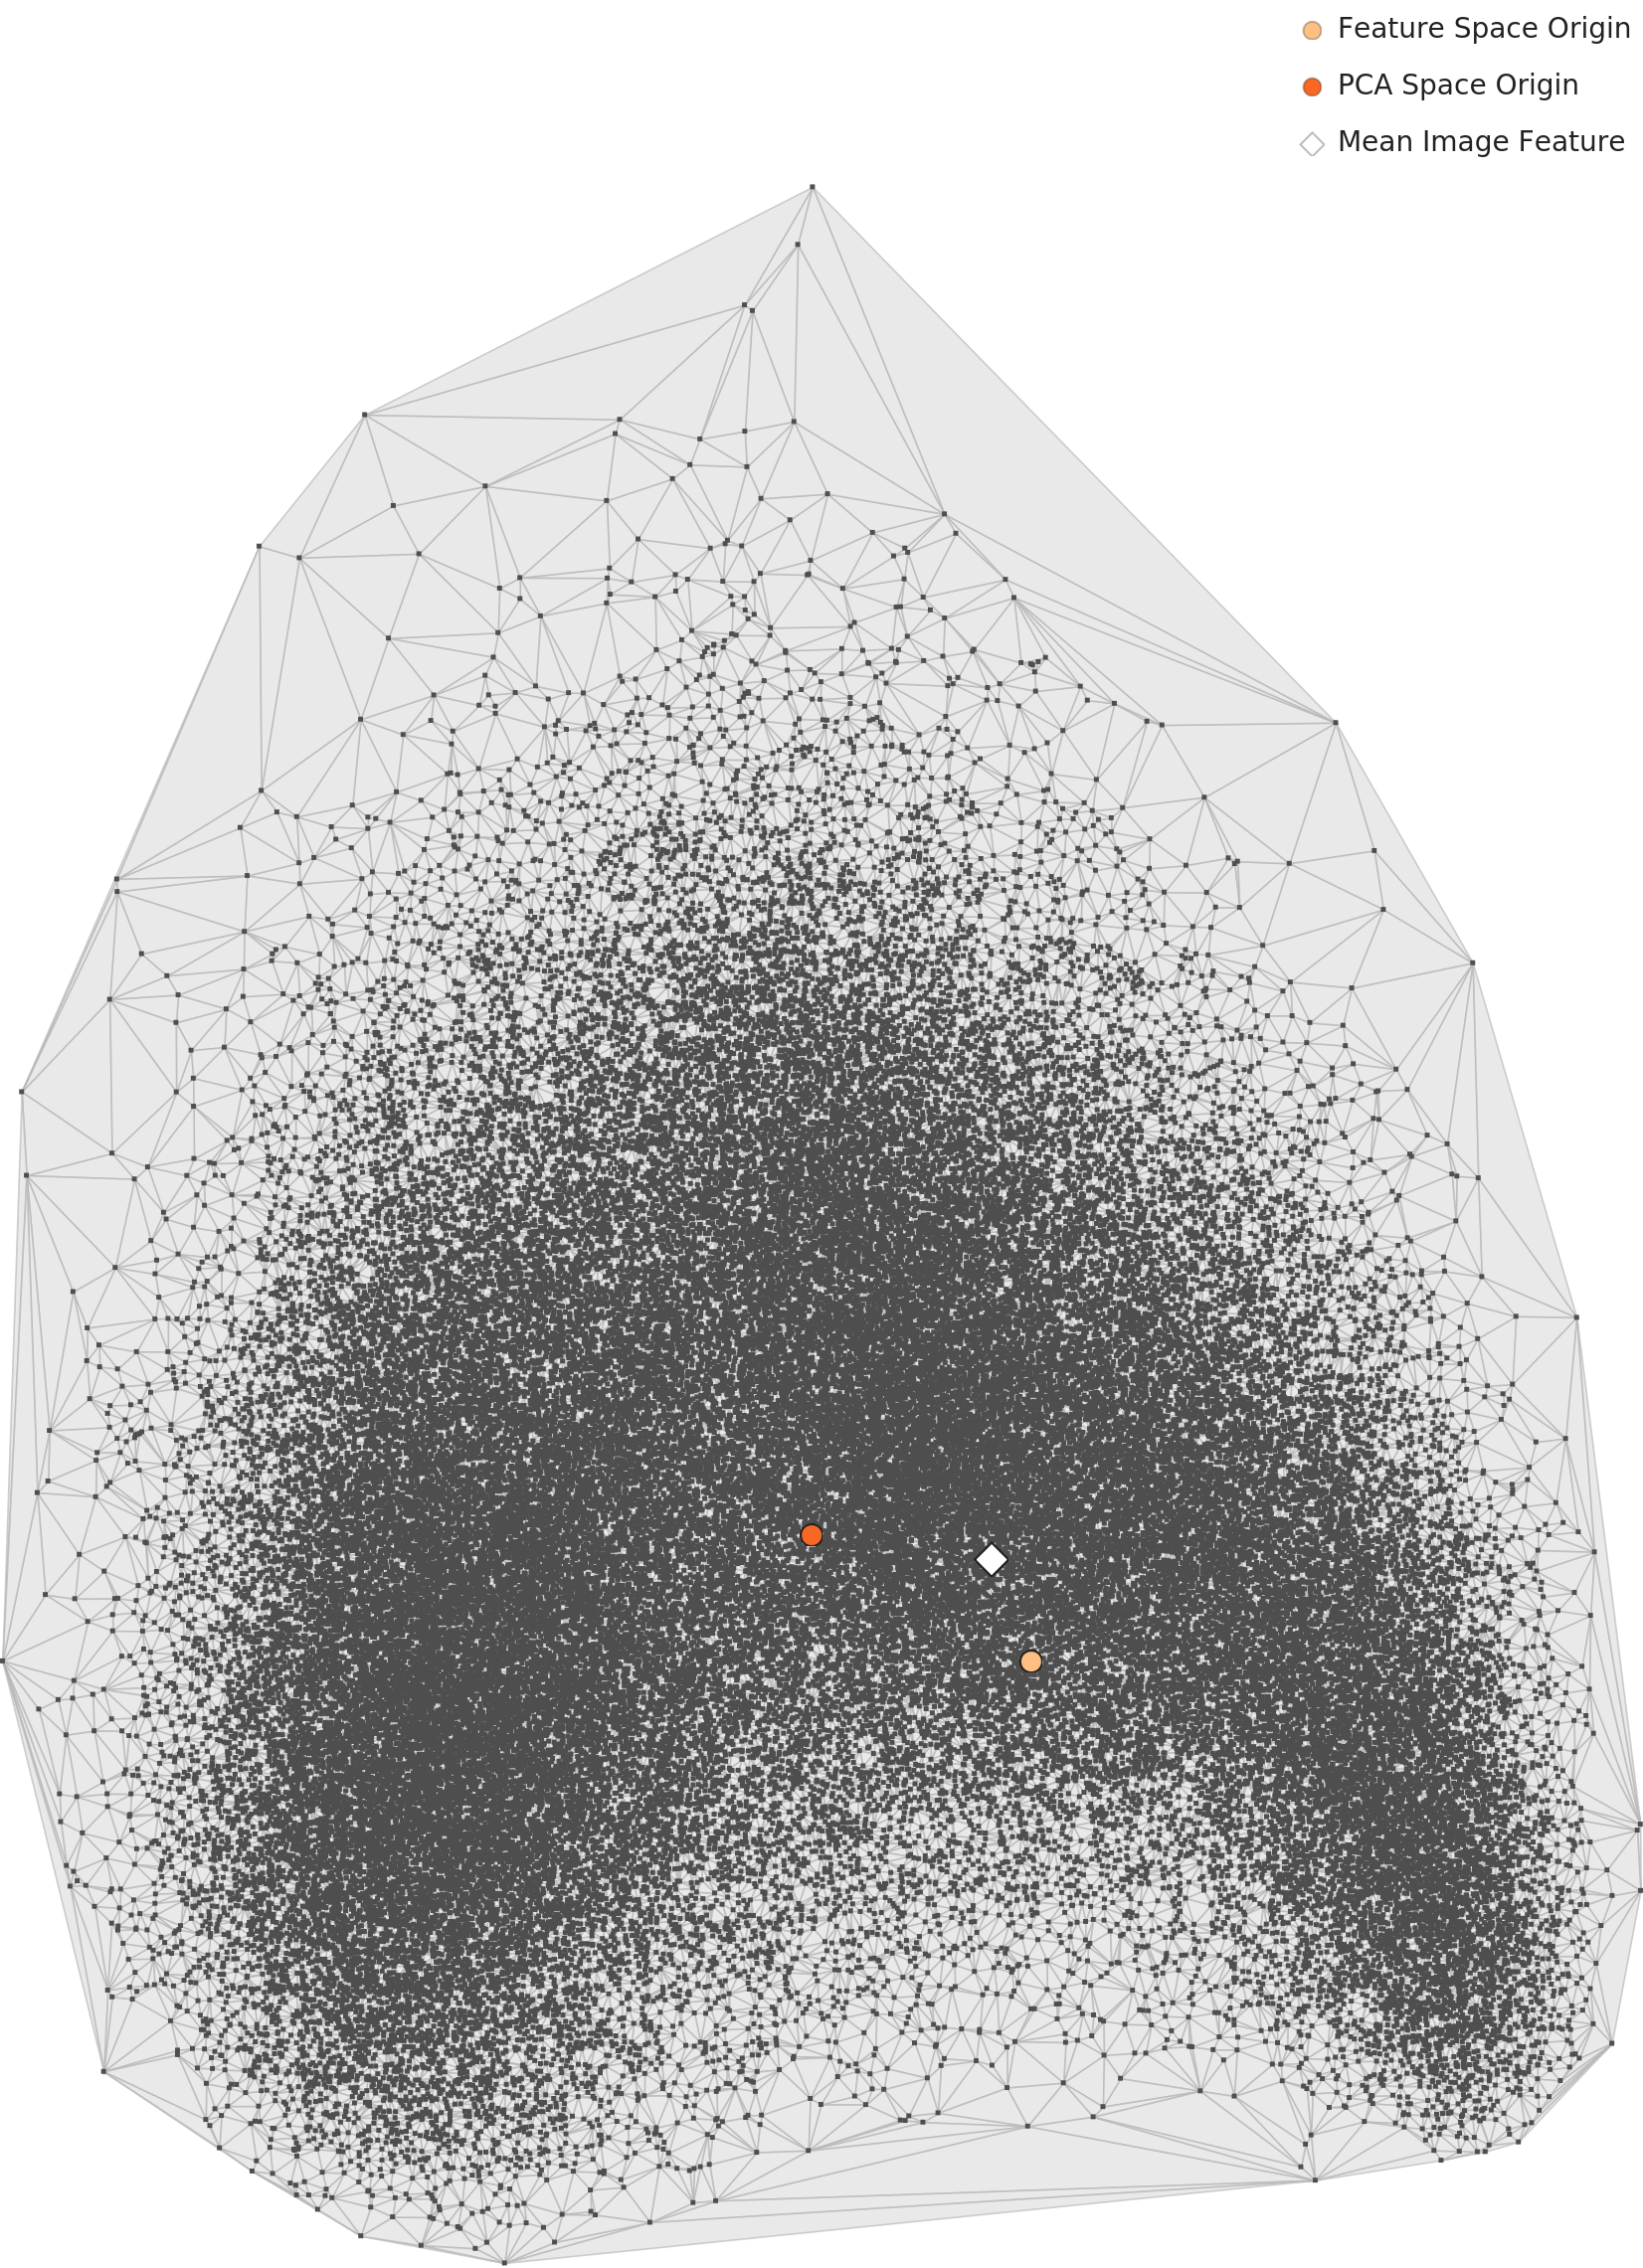
DataClinic L3 — PCA Overall Distribution → Rep-ML-1 (Domain Representativeness)
Re-mapped under semantic features (L3). The embedding structure shifts relative to L2, dispersing the peacock-centric cluster — the core evidence for Rep-ML-1 diagnosis.
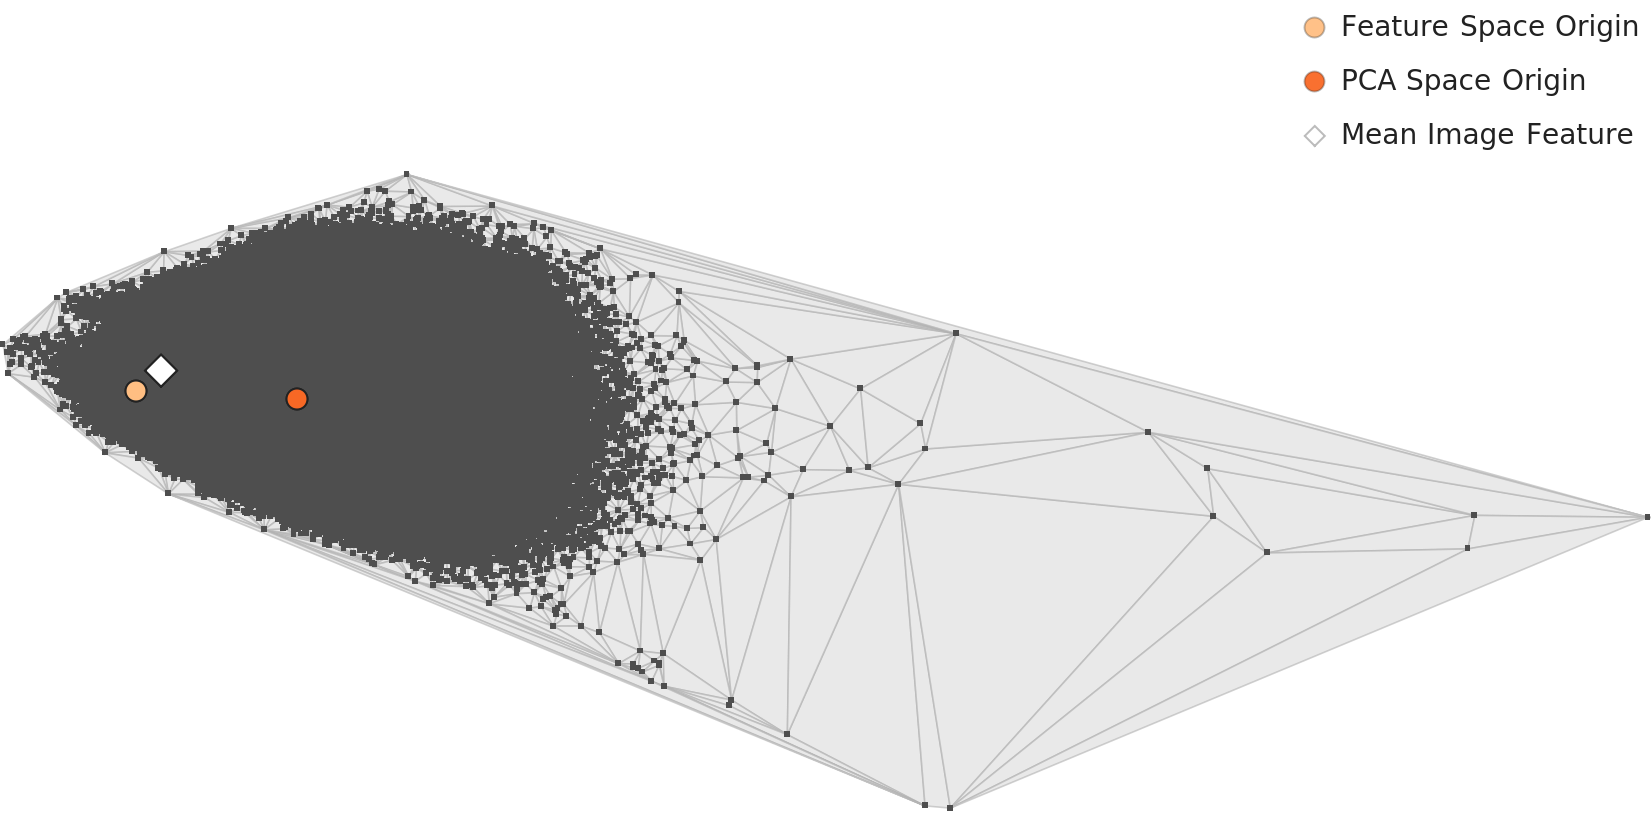
DataClinic L2 — Distance-Density Distribution → Rep-ML-1 (Density Bias)

Density vs. distance from centroid. High-density samples cluster near the center; low-density outliers scatter at the periphery — visualizing the Rep-ML-1 risk zone.
| DataClinic Diagnostic Chart / Metric | ISO 5259-2 QM Code | Verdict |
|---|---|---|
| L1 — Total image count 1,431,167; missing values: 0 | Com-ML-1 (value completeness) | Pass |
| L1 — 120 dog breed classes / 12% of all 1,000 classes; semantic overcrowding | Bal-ML-1 (class balance) | Fail |
| L1 — Blue channel spike of ~1.6B at pixel=255 and ~830M at pixel=0 | Con-ML-1 (pixel consistency) | Warn |
| L2 — Peacock cluster dominates the biological feature space in the density contour | Div-ML-2 (cluster diversity) | Fail |
| L3 — Peacock-centered embeddings drift toward non-biological classes such as tarantula | Rep-ML-1 (domain representativeness) | Fail |
| L3 — Focused analysis of low-density samples (outliers) → cross-validated against Northcutt et al. (2021): 85,870 errors | Acc-ML-7 (label anomaly proxy) | Warn |
Bal-ML-1: The Gap Between Numerical Balance and Semantic Balance
In DataClinic L1's per-class image count bar chart, ImageNet's 1,000 bars are distributed fairly uniformly between 732 and 1,300 images. What this bar chart shows is the numerical aspect of Bal-ML-1 (class balance). But read the same bar chart semantically and the story changes — the 120 dog breed bars (Yorkshire Terrier, Silky Terrier, Bedlington Terrier, and many more) account for 12% of all 1,000 bars. ISO 5259 defines Bal-ML-1 not as simple numerical balance but as "class distribution viewed against the intended purpose." By that standard, ImageNet's Bal-ML-1 is a Fail.
Div-ML-2 vs Rep-ML-1: What L2 and L3 Each Catch
In DataClinic L2's density plot, ImageNet's biological classes — and the peacock group in particular — occupy the center of the feature space, forming a high-density peak. This phenomenon maps to ISO 5259's Div-ML-2 (cluster diversity). When the embedding space is biased toward biological characteristics at the L2 stage, non-biological classes (tools, instruments, furniture) are pushed into low-density regions. The model optimizes toward "distinguishing dog breeds" and loses the ability to recognize the diverse objects found in real-world applications.
Switching the analytical lens to DataClinic L3 reveals a problem of an entirely different dimension. Because L3 uses BLIP image-text matching–based semantic embeddings, what appeared as a peacock cluster in L2 is reinterpreted in L3 as a peacock-to-tarantula transition pattern. This is a Rep-ML-1 (domain representativeness) issue. The dataset fails to represent the diversity of the actual visual world, being instead over-fitted to the fine-grained taxonomy of a particular biological classification scheme.
Acc-ML-2: Measuring Label Accuracy Outside DataClinic
Acc-ML-2 (label accuracy) is an item DataClinic does not measure directly. However, DataClinic L3's low-density samples serve as a starting point for assessing it. A low-density sample is an image that lies far from the typical characteristics of its assigned class — in other words, a strong candidate for a mislabel. Northcutt et al. (2021) applied exactly this methodology to find 85,870 label errors in the ImageNet validation set. These errors — affecting roughly 6% of all images — were a structural flaw embedded in the dataset that had served as the reference point for a decade of deep learning. Extracting low-density samples with DataClinic L3 and reviewing them visually is a practical alternative for measuring Acc-ML-2.
ImageNet Key Mapping Summary
The "~1,200 images per class" bar chart DataClinic shows is a numerical pass for Bal-ML-1. But the fact that "120 dog breeds occupy 12% of the dataset" is a semantic failure of Bal-ML-1. The L2 peacock density concentration is Div-ML-2 Fail, and the L3 embedding drift is Rep-ML-1 Fail. This is where DataClinic's score of 60 becomes concrete.
3 WikiArt — Bias Lives in Density, Not in Counts
WikiArt has the lowest DataClinic score (53 / Poor) among the three datasets. We examine how three distinct patterns translate into QM codes: the extreme 133:1 class imbalance (Impressionism at 13,060 images vs. Analytical_Cubism at 98), the bimodal Red channel distribution, and the single-artist concentration seen in L3. What is especially striking is the way L2 and L3 each capture a different dimension of bias.
L2 Density-Based Samples — High Density (Typical) vs Low Density (Outlier)
High Density — Minimalism and Color Field Painting cluster


Low Density — Abstract Expressionism and Naive Art outliers


Source: DataClinic Report #115 — WikiArt. High density: monochrome abstracts (Minimalism and Color Field) dominate the core — a Div-ML-2 risk signal. Low density: figurative and realist works scattered at the embedding periphery.
DataClinic L1 — Pixel Channel Histogram → Con-ML-1 (Pixel Consistency)
The Red channel shows a clear bimodal distribution. A signal that color profiles diverge across movements — the direct evidence for a Con-ML-1 (pixel consistency) violation.
DataClinic L2 — PCA Overall Distribution → Div-ML-2 (Genre Diversity)
PCA under general visual features. The Pop Art cluster separates from the main group and stands alone — visual evidence of the Div-ML-2 anomaly.
DataClinic L3 — PCA Overall Distribution → Idn-ML-1 + Rep-ML-1 (Antoine Blanchard Over-Density)
Re-mapped under semantic features (L3). A single artist's works (Antoine Blanchard) cluster densely in the Impressionism zone — simultaneous violations of Idn-ML-1 (data source identification) and Rep-ML-1 (representativeness).
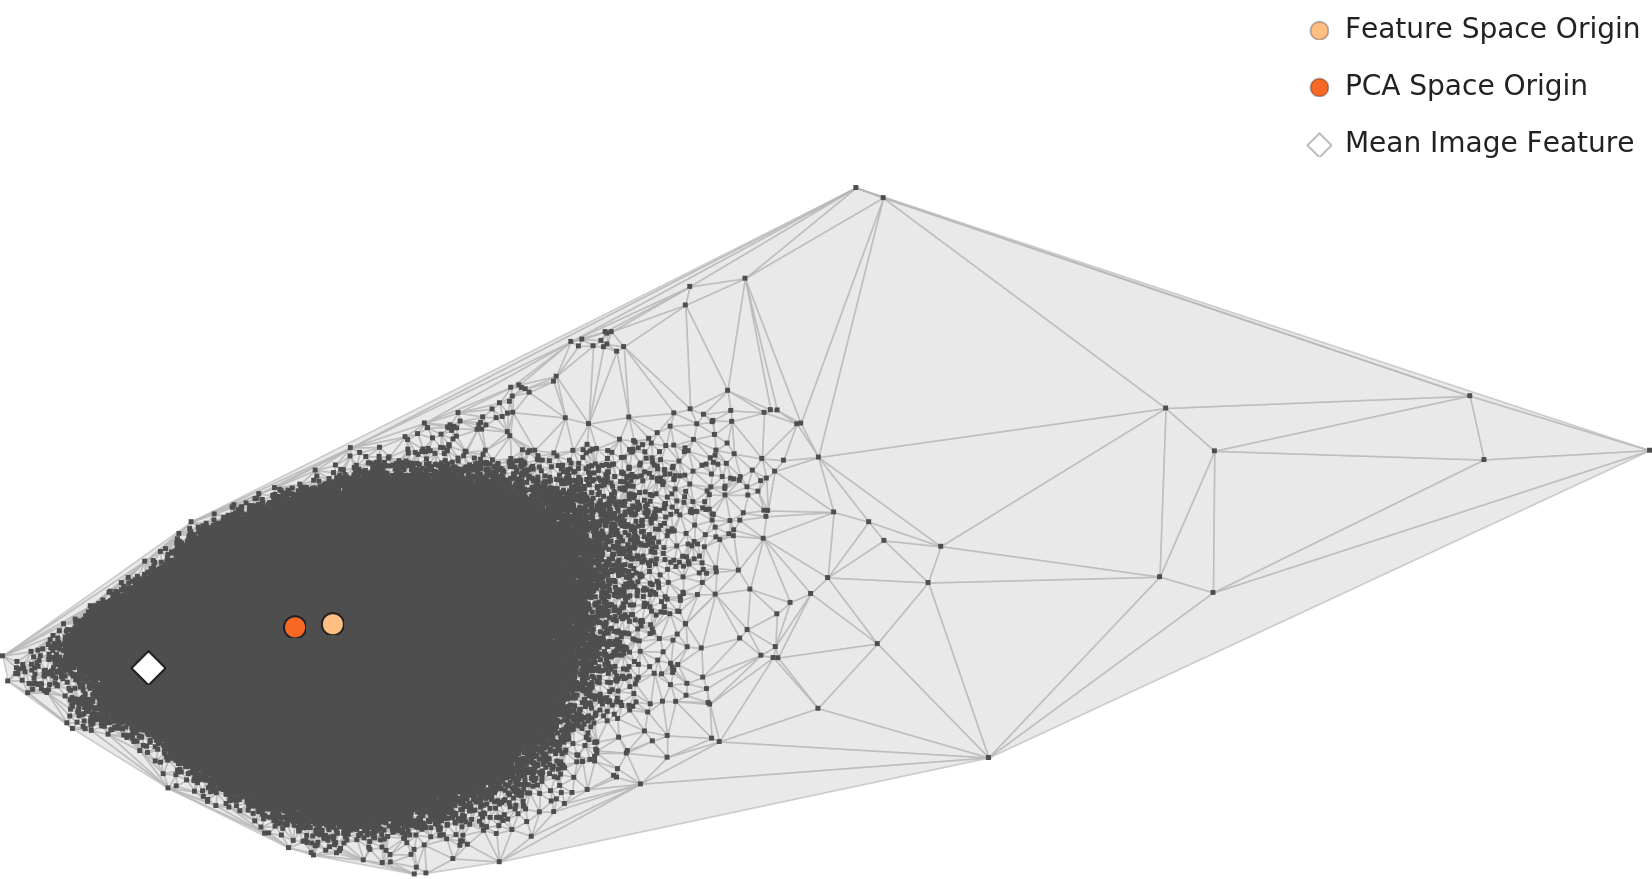
DataClinic L2 — Distance-Density Distribution → Div-ML-2 (Density Bias)

Monochrome abstracts (Minimalism and Color Field) occupy the high-density core; figurative and realist works scatter at the periphery — confirming the Div-ML-2 risk in numeric terms.
| DataClinic Diagnostic Chart / Metric | ISO 5259-2 QM Code | Verdict |
|---|---|---|
| L1 — Impressionism 13,060 images vs. Analytical_Cubism 98 images (133:1 ratio) | Bal-ML-1 (class balance) | Fail |
| L1 — Red channel histogram shows bimodal distribution (Impressionist warm tones + Classical dark tones) | Con-ML-1 (pixel consistency) | Fail |
| L2 — Pop Art cluster forms an isolated community separated from all other movements | Div-ML-2 (cluster diversity) | Fail |
| L3 — Antoine Blanchard (Parisian street painter) shows ultra-high-density concentration in the Impressionist zone | Idn-ML-1 (data source identification) | Warn |
| L3 — The entire Impressionist embedding space is skewed by Blanchard's visual characteristics | Rep-ML-1 (domain representativeness) | Fail |
| L1 — Total 81,444 images; missing values: 0 (completeness itself is fine) | Com-ML-1 (value completeness) | Pass |
Con-ML-1: What the Red Channel Bimodal Distribution Tells Us
DataClinic L1's Red channel histogram shows an unusual bimodal distribution in WikiArt. Two peaks coexist: one toward the low end (dark tones) and another in the middle-to-high range (warm red tones). This is a Con-ML-1 (pixel consistency) problem. The cause is structural art-historical: Classicism, Renaissance, and Baroque paintings use dark backgrounds and restrained color palettes, while Impressionism and Post-Impressionism employ intense, red-leaning palettes. When these two visual traditions are mixed in a single dataset, a bimodal distribution forms in pixel space. The Con-ML-1 root cause is only truly diagnosed when simple "check the RGB statistics" is combined with domain knowledge.
L2 vs L3: Two Lenses, Two Kinds of Bias
WikiArt's most interesting diagnostic result is that L2 and L3 each capture a different kind of bias. In DataClinic L2 (general-purpose embedding), the Pop Art cluster forms an isolated group within the overall feature space. This is a Div-ML-2 (cluster diversity) problem. Pop Art's intense primary colors, photography-based imagery, and large flat compositions differ so sharply from traditional painting movements that the general-purpose feature extractor separates Pop Art as a distinct "medium fault line."
Switching to L3 (BLIP semantic embedding) replaces the Pop Art issue with an entirely different kind of bias. In the Impressionist zone, Antoine Blanchard's series of Parisian street scenes forms an extremely high-density cluster. Blanchard was an artist who produced hundreds of works repeating the same composition, palette, and subject matter. In L3 embedding space, this repetition manifests as a high-density cluster, and as a result Blanchard's visual language ends up defining what "canonical Impressionism" means. This is an Idn-ML-1 (data source identification) and Rep-ML-1 (representativeness) problem. One artist's repeated works distort the representativeness of an entire movement.
L2 vs L3: The Lesson of Two Lenses
What L2 caught is medium bias (the Pop Art fault line) — a genre whose visual style is so different from traditional painting that it splits off. What L3 caught is source bias (the Blanchard concentration) — an artist with many repetitive works dominating the semantic space. Analyzing the same dataset through both lenses surfaces problems in different QM items. This is the value of DataClinic's multi-level diagnostic system, and the reason ISO 5259 defines multiple QM items in parallel.
Aud-ML-1: How to Measure WikiArt's Copyright Issues
Aud-ML-1 (copyright/license auditing) is an item DataClinic does not measure directly. WikiArt is in a complex position from a copyright standpoint — works by artists active after the 20th century are still protected, and some images are restricted based on the digital reproduction policies of the museums holding them. Measuring this item requires a separate pipeline: verifying C2PA (Content Credentials) metadata per image, or cross-referencing against a Creative Commons license classification database. The fact that DataClinic does not cover this area is not a deficiency — it is a division of responsibilities. DataClinic measures the content quality of images; legal and governance QM items are addressed with dedicated complementary tools.
WikiArt Key Mapping Summary
L1 Red channel bimodal = Con-ML-1 Fail. 133:1 class imbalance = Bal-ML-1 Fail. L2 Pop Art isolated cluster = Div-ML-2 Fail. L3 Blanchard high-density concentration = Idn-ML-1 Warn + Rep-ML-1 Fail. DataClinic's score of 53 (Poor) is composed of these five QM failures.
4 SpectralWaste — The Structural Limits of Small Industrial Datasets
SpectralWaste is the smallest of the three datasets, and with a DataClinic score of 68 it sits in the middle — yet from an ISO 5259 perspective, it is the case that exposes the most structural limitations. Collected from a prototype conveyor belt, this dataset embodies a classic dilemma for small industrial data: lab-quality precision vs. real-world representativeness.
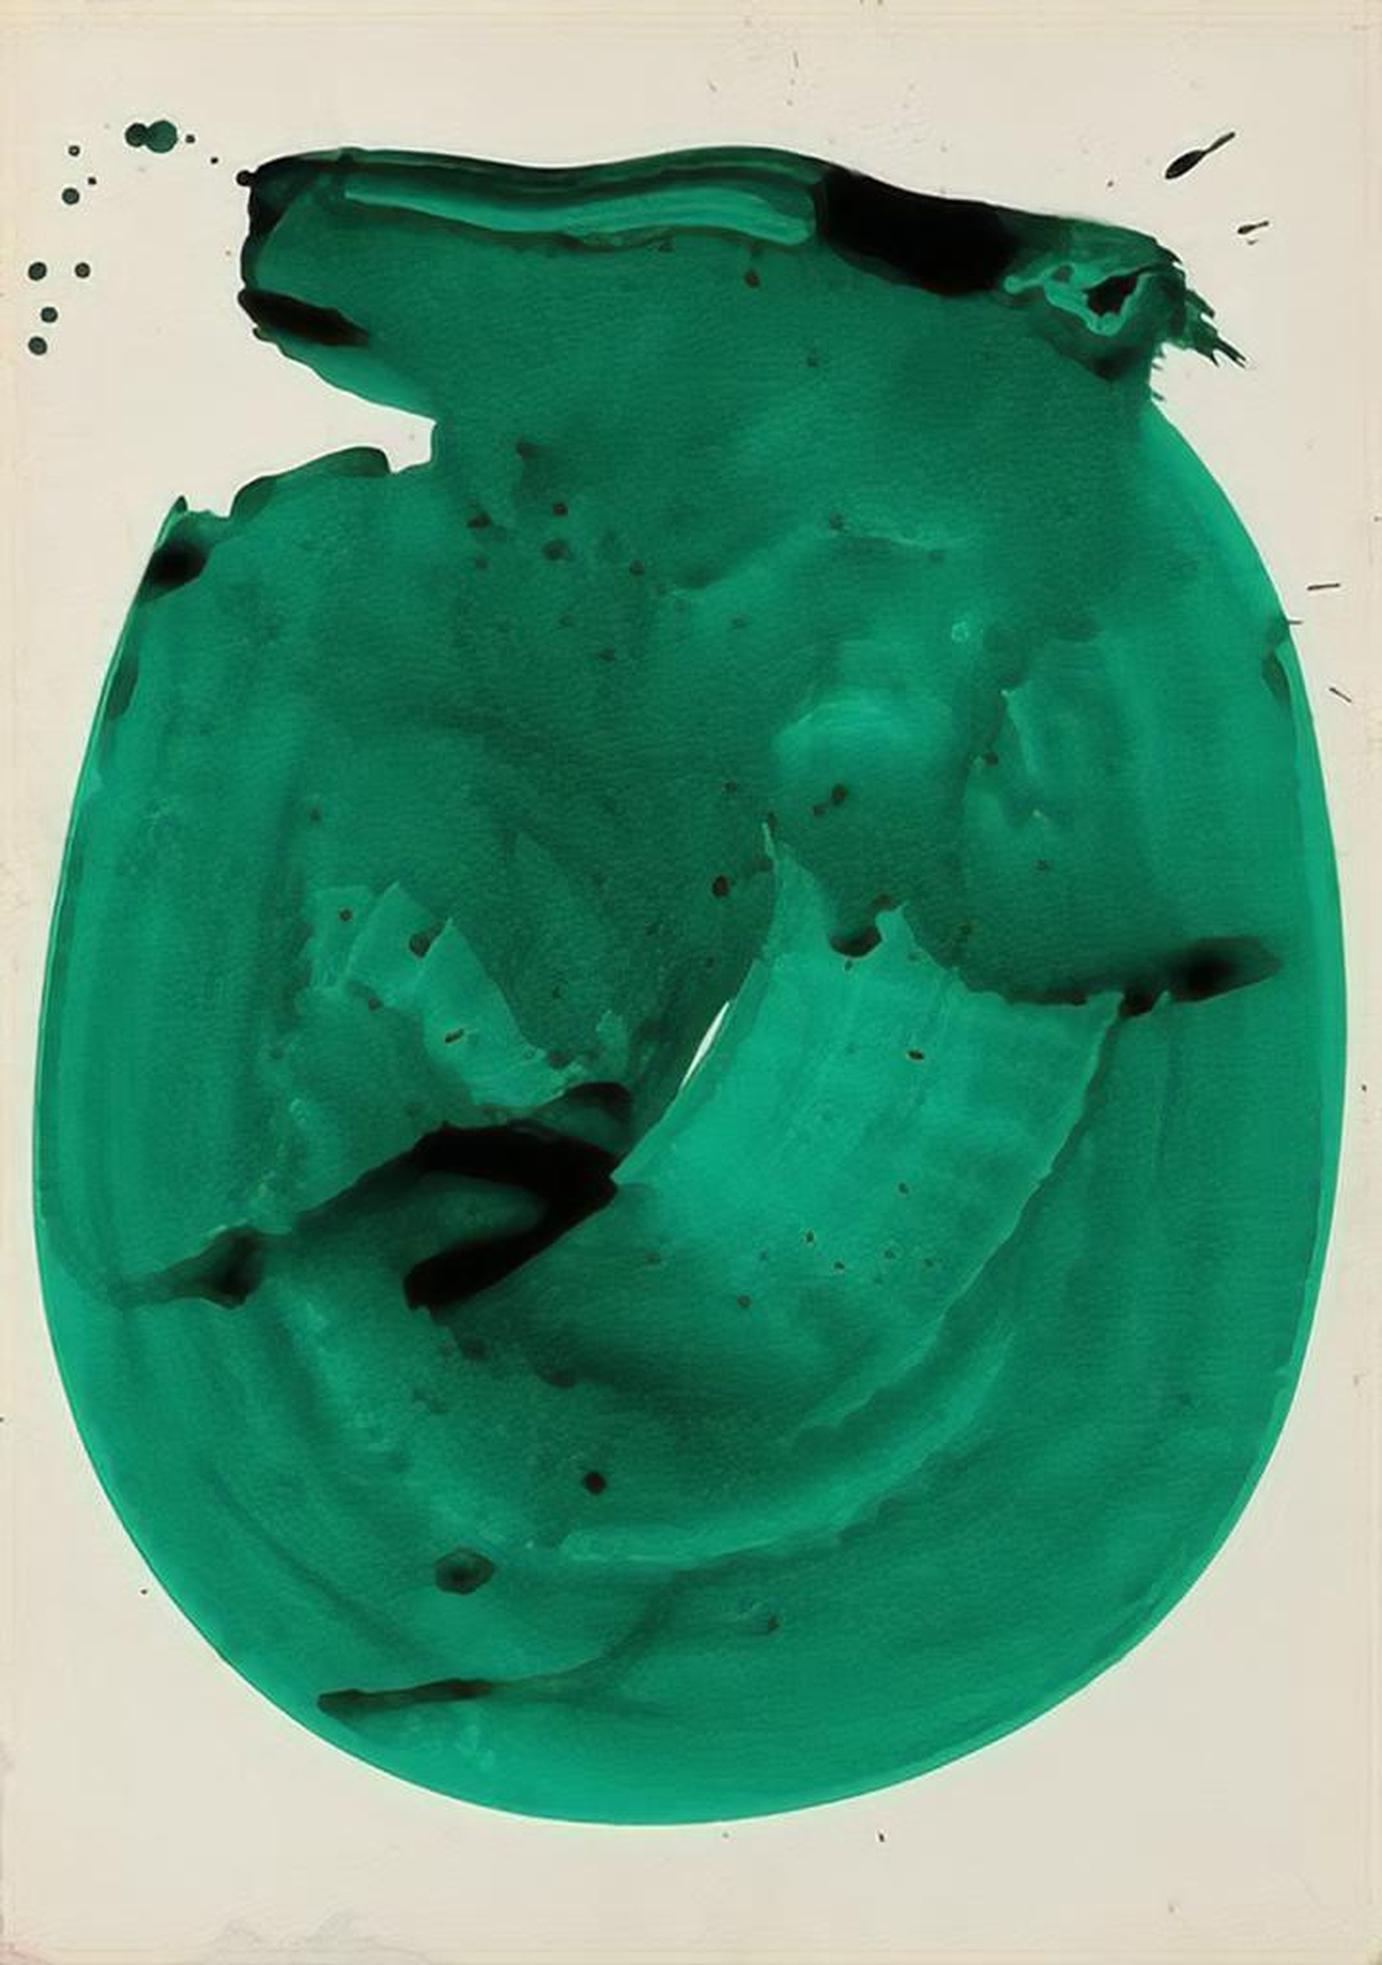
L1 Collage — Representative Images Across 6 Classes
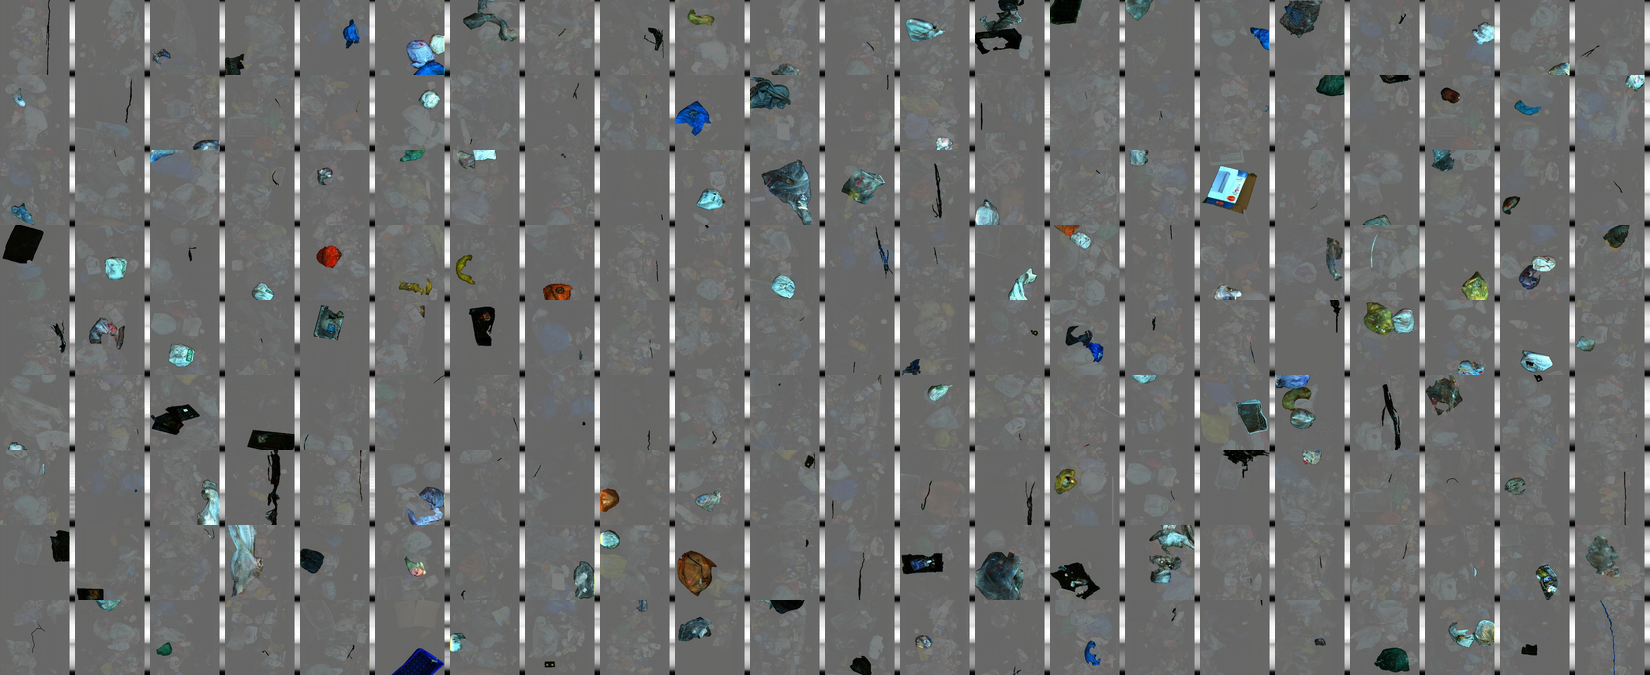
Source: DataClinic Report #618 — SpectralWaste. 6-class representative images. Visual similarity across classes and the Styrofoam shortage are already visible at L1.
DataClinic L1 — Class Mean Images → Com-ML-1 + Bal-ML-1

bag

basket

cardboard

filament

paper

styrofoam ⚠️
Mean images across 6 classes. The Styrofoam class (bottom right) shows a blurry mean — a visual indicator of critically low sample count and direct evidence for the Com-ML-1 Fail verdict.
| DataClinic Diagnostic Chart / Metric | ISO 5259-2 QM Code | Verdict |
|---|---|---|
| L1 — Total 2,794 images (insufficient absolute quantity for industrial deployment) | Com-ML-1 (value completeness / quantity) | Fail |
| L1 — video_tape 646 images vs. filament 33 images (19.6:1 imbalance) | Bal-ML-1 (class balance) | Fail |
| L1 — Missing values: 0; label completeness: 100% | Com-ML-3 Com-ML-5 | Pass |
| L2 — All embeddings densely packed into a single cloud (no environmental diversity) | Div-ML-1 (environmental diversity) | Fail |
| L3 — High-density concentration → only a single conveyor belt environment represented; real recycling sites not reflected | Rep-ML-1 (domain representativeness) | Fail |
| L2 — filament class samples intermixed with basket and bag embedding zones | Con-ML-2 (label consistency) | Warn |
Com-ML-1 + Bal-ML-1: A Double Burden of Insufficient Quantity and Imbalance
DataClinic L1's per-class image count bar chart immediately reveals two facts about SpectralWaste. First, the absolute total of 2,794 images falls short of industrial deployment standards — this is Com-ML-1 Fail. Commercially deploying a conveyor belt model for a real recycling plant requires a minimum of tens of thousands of training images. Second, the 19.6:1 imbalance between video_tape (646 images) and filament (33 images) is Bal-ML-1 Fail. The fact that the smallest class (filament) has only 33 samples raises the question — before even considering numerical ratios — of whether training is feasible at all.
Div-ML-1: The Single-Cloud Embedding as Evidence of Missing Environmental Diversity
In DataClinic L2's density distribution, all SpectralWaste samples are packed tightly into a narrow region of the feature space. This single-cloud pattern is visual evidence of Div-ML-1 (environmental diversity) Fail. Because every image was captured on the same conveyor belt, under the same lighting conditions, from the same camera angle, there is simply no room for diversity to exist in embedding space. The high-density concentration in L3 is the semantic version of the same problem — only the single context of "objects on a conveyor belt" is represented, with no coverage of the varied environments found at actual recycling sites (outdoor sorting facilities, mobile separators, different lighting conditions). This is Rep-ML-1 (domain representativeness) Fail.
Eft-ML-3: Methodology for Improving Collection Efficiency
Eft-ML-3 (collection efficiency) is an item DataClinic does not fully measure. For SpectralWaste, this item can be partially addressed through data augmentation strategies. Re-shooting the same objects under different lighting conditions (fluorescent, natural, backlit), different camera angles (front, 30°, 45°), and different conveyor belt speed settings would simultaneously improve Div-ML-1 and Rep-ML-1. If the current single cloud in DataClinic L2's embedding space expands into multiple dispersed clouds, that expansion is direct evidence of Eft-ML-3 improvement.
Sim-ML-1 (duplicate images) requires particular attention for small datasets. A dataset like SpectralWaste, captured in continuous bursts from prototype equipment, is likely to contain many nearly identical frames. While DataClinic shows nearest pairs in its L2 similarity analysis, running a separate pHash (perceptual hashing)–based duplicate detection provides a precise measurement of Sim-ML-1. If a high proportion of the 2,794 images are duplicates, the effective training data is even smaller.
SpectralWaste Key Mapping Summary
L1 total 2,794 images = Com-ML-1 Fail (by industrial deployment standards). 19.6:1 imbalance = Bal-ML-1 Fail. L2 single-cloud density = Div-ML-1 Fail. L3 high-density concentration = Rep-ML-1 Fail. The reason DataClinic scores 68 (Average) despite these four structural failures is the Pass on missing values (0) and label completeness (100%). A textbook pattern: the pixel layer passes while the task layer fails across the board.
5 Three-Dataset Comparison Matrix
Placing the three datasets side by side against ISO 5259-2 QM items makes the similarities and differences in their failure patterns clear. The "Auto" column indicates items that can be assessed directly from diagnostic metrics, while the "Manual" column indicates items that require methods beyond DataClinic.
| QM Item | QM ID | ImageNet | WikiArt | SpectralWaste | Measurement Method |
|---|---|---|---|---|---|
| Accuracy | |||||
| Label accuracy | Acc-ML-2 | Fail ~6% errors |
Manual review required | Manual review required | Visual review of L3 low-density samples |
| Label anomaly detection | Acc-ML-7 | Warn | Warn | Warn | DataClinic L3 (auto proxy) |
| Completeness | |||||
| Value completeness | Com-ML-1 | Pass | Pass | Fail Insufficient quantity |
DataClinic L1 (auto) |
| Balance | |||||
| Class balance | Bal-ML-1 | Fail Semantic skew |
Fail 133:1 |
Fail 19.6:1 |
DataClinic L1 (auto) |
| Diversity | |||||
| Environmental diversity | Div-ML-1 | Warn | Warn | Fail | DataClinic L2 (auto) |
| Cluster diversity | Div-ML-2 | Fail Peacock dominance |
Fail Pop Art fault line |
Warn | DataClinic L2 (auto) |
| Representativeness | |||||
| Domain representativeness | Rep-ML-1 | Fail | Fail Blanchard bias |
Fail Single environment |
DataClinic L3 (auto) |
| Consistency | |||||
| Pixel consistency | Con-ML-1 | Warn Blue spike |
Fail Red bimodal |
Pass | DataClinic L1 (auto) |
| Similarity | |||||
| Duplicate images | Sim-ML-1 | Pass | Warn | Manual required | pHash analysis supplement |
| Identifiability | |||||
| Data source identification | Idn-ML-1 | N/A | Warn Blanchard pattern |
N/A | DataClinic L3 (partial) |
| Auditability | |||||
| Copyright/license | Aud-ML-1 | Manual required | Fail Copyright risk |
Manual required | C2PA metadata analysis |
| Currentness | |||||
| Feature currentness | Cur-ML-1 | Warn Collected 2009 |
Warn | Manual required | EXIF timestamp analysis |
| Effectiveness | |||||
| Collection efficiency | Eft-ML-3 | Pass | Warn | Fail Single environment |
DataClinic L2/L3 + supplement |
Common Patterns Visible in the Matrix
All three datasets received Fail on both Bal-ML-1 and Rep-ML-1. Even with completely different scales, domains, and purposes, class balance and domain representativeness are the most commonly failing items. DataClinic L1 automatically catches Bal-ML-1, and L3 automatically catches Rep-ML-1. Monitoring just these two items is enough to detect the core quality risks of all three datasets early.
6 Conclusion — Separating Responsibilities Across Two Layers
One principle runs through all three cases. Problems at the pixel layer — channel distributions, missing values, format consistency — are captured automatically by DataClinic. But problems at the task layer — semantic imbalance, absence of domain representativeness, source bias — are surfaced by DataClinic, yet what those problems mean must be decided by humans at the data collection design stage. ImageNet's 120 dog breeds, WikiArt's Blanchard effect, and SpectralWaste's single-environment capture are all observable in DataClinic L3, but their root causes lie in data collection policy.
Practical Workflow for ISO 5259–Based Diagnosis
Run DataClinic L1
Check Bal-ML-1 via the class bar chart. Inspect Con-ML-1 via the RGB channel histograms. Assess Com-ML-1 from total count and missing values.
Run DataClinic L2
Check Div-ML-1/2 via the density contour. Assess Div-ML-2 by checking for isolated clusters. Proxy-measure Acc-ML-7 from the low-density sample list.
Run DataClinic L3
Assess Rep-ML-1 from high-density concentration patterns in the semantic embedding. Flag Idn-ML-1 if source bias patterns are detected. Supplement Acc-ML-2 through visual review of low-density samples.
Manually Verify Non-Covered Items
Sim-ML-1 via pHash duplicate detection. Aud-ML-1 via C2PA metadata. Cur-ML-1 via EXIF timestamps. Acc-ML-2 final confirmation via domain expert review.
The mapping attempted in this article — directly translating DataClinic diagnostic metrics into ISO 5259-2 QM codes — is still a domain without a standardized process. If ISO 5259 provides the theoretical framework for AI training data quality, DataClinic is the tool that makes that framework actually measurable. When the two systems are combined, data quality diagnosis shifts from "receiving a score" to asking the concrete questions: "Which QM item failed, why, and how do we improve it?"
"DataClinic is the measurement instrument for ISO 5259; ISO 5259 is the interpretive framework for DataClinic."
When DataClinic shows the class bar chart in L1, it is measuring Bal-ML-1. When it draws the density contour in L2, it is measuring Div-ML-2 and Rep-ML-1. When it extracts low-density samples in L3, it is a proxy indicator for Acc-ML-7 and a starting point for Acc-ML-2. The moment you understand this mapping, a DataClinic report transforms from a diagnostic printout into an ISO 5259 compliance checklist.
Series Navigation
Part 1 of this series, "Image Dataset Quality is Two Layers — ISO/IEC 5259 Applied Theory" , covers the theoretical distinction between the pixel layer and the task layer, the complete matrix of 23 QM items, and the level of DataClinic automation support. Detailed diagnostic reports for individual datasets are available in the ImageNet evaluation, WikiArt evaluation, and SpectralWaste evaluation.