Executive Summary
The Korea Disease Control and Prevention Agency (KDCA) and the Ministry of Science and ICT opened an AI health chatbot to the whole public on October 28. Answer a short questionnaire on the website of the Korea Community Health Survey, covering basic body measurements such as height and weight along with daily habits, and the service returns your health position relative to a peer group of similar sex and age, plus risk readings for high blood pressure, diabetes, dyslipidemia and obesity, drawn as a traffic light and a graph. It is one piece of the ministry's Public AI Transformation (AX) project, and what sits underneath it is more than 5 million records from two decades of national health surveys.
What the color of the light means depends on who you are being compared with. Yet nowhere in the announcement is it written which survey those peers come from, which years, or how many years wide the age band is. The Korea Community Health Survey the chatbot sits on began in 2008 and has run since 2010 as a rotating system that splits its items across one-year, two-year and four-year cycles. That is to say it is not a pile built by asking the same questions at the same density every year.
Sections 1 through 3 follow the two agencies' announcement, together with the Korea Community Health Survey material KDCA has published and its own report on changing the survey method. Section 4, which brings in overseas cohort research, and Section 5, which sets out what is left to do on the data side, are this article's reading.
Key Figures
What the peer comparison is made of is written into the survey material KDCA has published every year. The shape of that material comes down to four numbers.
Sources: Korea.kr policy briefing · KDCA 2025 survey results · Rotating survey overview
5M+
National health survey records the chatbot is said to use
Whether one record is one person or one answer line is unclear
18 rounds
Times the Korea Community Health Survey has run so far
Began in 2008; published microdata runs through the 2025 round
About 900
People sampled in one city, county or district each year
The size set to hit a target margin of error of ±3% per health center
Four years
How long the locally selected items stood still
Suspended from 2020 to 2023, asked again in 2024
Type In Height and Weight, Get Back a Traffic Light
KDCA and the Ministry of Science and ICT said on October 28 that the AI health chatbot service had opened in full. Go to the Korea Community Health Survey website and anyone can use it with no time limit. It is one of the products of the Public AI Transformation (AX) project, the ministry's push to attach AI to the public sector.
From the user's side there are two things to do. One is to answer a short questionnaire on basic body measurements such as height and weight along with daily habits; the other is simply to ask whatever you want to know. Answer the first and back comes where your health sits against a peer group of similar sex and age, together with risk readings for high blood pressure, diabetes, dyslipidemia and obesity, shown as a health traffic light and a graph. The second is a round-the-clock counseling function that takes everyday questions about sleep, exercise and diet.
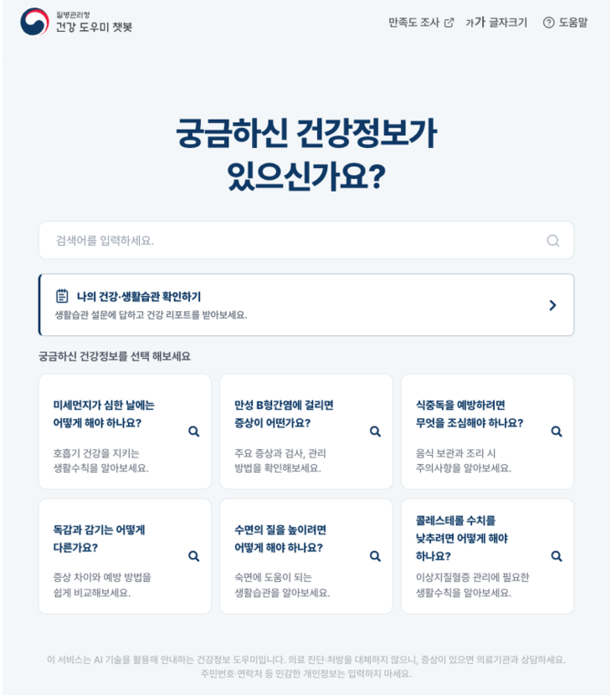
What the two agencies put forward as grounds for trusting it is where the data comes from and how it was checked. They wrote that the service uses authoritative health data vetted by an advisory panel of medical and AI experts, and that it applies encryption in line with national security rules. They wrote down a limit as well. The health report and the counseling the chatbot produces are reference information meant to help with health management, and they do not stand in for a doctor's diagnosis or treatment.
KDCA Commissioner Lim Seung-kwan called the opening a leading case of data-driven public AX administration, one that hands public health data back to the people it came from. Lee Do-kyu, who heads the information and communication policy office at the Ministry of Science and ICT, rated it a service that improves public health and brings real help to people's lives, and said the ministry would work with other agencies to put out more AI services the public can feel.
Which AI model was used, and by what structure the peer comparison is calculated, appears neither in the two agencies' press release nor in the articles that picked it up. A line about applying AI technology stands in that place. So checking the numbers the chatbot returns means looking not at the model but at the survey material underneath it.
The Survey Behind the Peers Was Built for Neighborhoods
The Korea Community Health Survey has run every year since 2008 as a government-approved statistic. Its legal basis is Article 4 of the Regional Public Health Act, and the purpose of the survey is to ascertain the health status of local residents and supply the groundwork for regional public health plans. The name already holds the answer. It was not built to produce a national average; it was built to produce numbers at the level of each city, county and district.
The way the sample is drawn follows that purpose exactly. About 900 people are picked in each city, county and district and surveyed by the local public health center, and adding all of them together gives roughly 230,000 adults aged 19 and over nationwide. The 2025 round covered 231,615 people across 258 areas; the 2026 round covered about 230,000 through 260 public health centers. A city of 700,000 gets 900 people and a county of 30,000 also gets 900. That follows naturally from a design meant to produce numbers at the same precision for every locality, but it makes for a different composition than a sample drawn in proportion to national population.
The drawing procedure works off that same unit. The smallest administrative units are picked first by probability-proportional systematic sampling, and sample households are then drawn from them by systematic sampling. The design targets KDCA writes into its sampling guide are an average of 900 people per public health center and a target margin of error of ±3%. What the ±3% is promised for is each individual public health center, not the national average. The national figure is not what this design hands over directly; it is assembled afterward.
So building "the average man in his forties nationwide" out of this material takes one more step. The share by which each region is over- or under-represented has to be reweighted to match population and then summed. The national health indicators KDCA publishes each year are values that have passed through that correction. The peer distribution the chatbot returns has probably passed through the same correction, but which weights were applied against which year's population has not been published.
None of this says the survey design is wrong. It says that putting material built for neighborhood indicators to work on an individual peer comparison takes one conversion, and how that conversion was done decides how accurate the answer is. The user gets only the color of the light. There is no way for them to tell which weights that color came through.
The Questions Differ From Year to Year
Saying that twenty years have been pooled reads easily as the same questions repeated twenty times. The Korea Community Health Survey does not run that way, because it has used a rotating system since 2010. Rather than asking every item every year it splits the items across cycles, and the full cycle is four years, matched to the cycle of regional public health plans. The 2011 round is one example. Of the 248 items asked that year, 181 sat on a one-year cycle, 50 on a two-year cycle and 17 on a four-year cycle.
The list of items is not fixed either. The survey divides into nationwide common indicators and locally selected indicators, and the locally selected survey stopped in 2020 because of COVID-19 and only resumed in 2024. That year's round asked 172 nationwide common items plus anywhere from 6 to 37 locally chosen items, coming to roughly 170 to 210 in all. In 2026, policy-issue indicators that take up current policy demands from central ministries arrived alongside locally specialized indicators, and frailty entered the full survey for the first time.
What this structure leaves behind for peer comparison runs in two directions. One is density. A peer distribution built from a four-year-cycle item stands on fewer years of data than one built from a one-year-cycle item. The other is splicing. Treating an answer from a year whose wording changed as the same value as the previous year's answer takes a rule to join them, and if that rule is wrong, the distribution shifts in certain year ranges only.
The input the chatbot takes is not the same as the original survey either. What KDCA described as the input is a short questionnaire on body measurements and daily habits. The original survey runs every year from May 16 to July 31, with surveyors carrying an electronic questionnaire on a tablet PC to each household and asking one on one. Answers gathered that way across 170 to 210 items and a short questionnaire filled in alone on a web screen cannot be the same questions. How the two sets of items were matched up is what sets the color of the light, and that mapping table is nowhere to be found.
The point that how you ask changes the answer was raised first by KDCA itself. From 2008 to 2025 this survey ran only through one-on-one face-to-face interviews by visiting surveyors, and as single-person and dual-income households grew, as people grew firmer about protecting their privacy and as non-face-to-face habits spread quickly, that method stopped working the way it once did. Concern rose from inside the survey that when more households refuse and the sample household replacement rate climbs, the representativeness of the sample and the reliability of the results fall together. So through December 2025 KDCA ran a mixed-mode survey pilot covering about 8,100 people across nine public health centers nationwide. It keeps face-to-face as the rule but takes a non-face-to-face response when the respondent prefers one or when a visit is difficult, and one of the things the pilot sets out to establish is the mode effect that follows a change of method, meaning the shift in the distribution of answers that comes from how the question is put.
The chatbot stands on the far side of the very transition that pilot is still measuring. It has users fill in on a screen, by themselves, the items a person used to come and ask, and then sets those answers against a distribution built from 18 years of face-to-face interviews. Whether figures gathered face to face and figures gathered without a visit can be mixed is the question the people who built the survey are measuring right now.
To anyone who works with data this job is familiar. It is the same work as merging tables whose schema differs by year into one. You line up the column names, bring the scales of the values together, and decide what to do about the missing years. Most of what it actually means for public data to become usable for AI sits right here. Choosing a model comes after.
An Aging Reference Group Skews the Comparison
Telling people about their health by setting it against peers is not a new idea. The normal range printed on a hospital test result rests on the same principle: the middle 95% of a reference group gathered at some point in the past is taken as normal. The weakness of that method has been known just as long. If the reference group does not resemble today's population, the line marking normal is off along with it.
Evidence has accumulated that when generations change, health at the same age changes too. A study pooling the British birth cohort studies appeared in 2026 in the demography journal Population Studies. Gathering 51 papers that compared six cohorts at matched ages, from those born in 1946 to those born between 2000 and 2002, it found almost no evidence that the health of later-born generations had improved. The prevalence of physical and mental health problems was similar or, if anything, worse in the later generations. Set the 1970 cohort against the 1989–1990 cohort at around age 25 and dissatisfaction with life had climbed from 20.9% to 31.5% among men.
Carry that result over to peer comparison and the implication becomes plain. Build a reference group by merging twenty years into one block and the forty-somethings of 2008 and the forty-somethings of 2025 sit inside it at equal weight. They are different people. Their diets differ, the hours they spend sitting differ, their smoking rates differ. The merged average becomes a hypothetical peer who is neither, and once the comparison target is hypothetical the meaning of the light's color blurs along with it.
The width of the peer band carries the same problem. KDCA's announcement said only that the group is similar in sex and age. Whether that similarity runs in five-year or ten-year bands is the next question, and the announcement stops there. Narrow the band and the comparison grows more accurate, but the sample in that cell shrinks and the value wobbles; widen it and the value steadies, but a forty-one-year-old is bundled in with a forty-nine-year-old. Depending on which way it went, the same person could get a yellow light or a green one.
Why Pebblous Is Watching This Service
The claim that public data is being put into a form AI can use has until now lived mostly as a slogan inside documents. This chatbot shows what that claim becomes at the fingertips of a single citizen. Survey results that existed for twenty years only as statistical tables and microdata come back as a comparison group of "people like me." It is also a case where the gap Pebblous wrote about in an earlier piece on the distance between public data and AI use has actually narrowed.
A lesson running the other way sits alongside it. Data becoming usable for AI does not make the interpretation accurate by itself. Joining twenty years of raw material into one comparison model, which means reweighting the sample, mapping the items that changed and correcting for the missing years, was most likely the heaviest part of building this service, and the announcement steps over that work with a single line about applying AI technology. The hardest job got the shortest write-up.
Four more lines next to the traffic light would change how users read the result.
- Which survey and which years the peer distribution was built from. Whether all twenty years went in, or recent years carry more weight, decides whether the same input comes back a different color
- How many years wide the peer band is. Knowing which cell a forty-one-year-old falls into lets a reader gauge how sensitive the result is
- How values from years when the items changed were spliced together. How stretches with a missing item, such as 2020 to 2023, were handled belongs here
- How answers typed in alone on a screen were set against a distribution gathered by face-to-face interview. The mode effect KDCA is measuring with a pilot is already under way inside the chatbot
None of the four has anything to do with model performance. They are items whose answers would hold after swapping in a better model, and the people who built the service already have those answers in hand. Leave those answers off the screen and the caveat about reference information rather than a diagnosis stays a formality. How far reference reaches is something a person can judge only by knowing who the comparison is against.
Public institutions turning the data they have accumulated into AI services will only become more common. The same question follows each time. In which year and by what method was that data gathered, and how many times did the standard change in between? Whether a service can publish that history alongside the result is what turns the claim of having put data in order for AI into something a reader can check.
Thank you for reading this far. The service details came from the announcement the two agencies issued on October 28 and the coverage that carried it, and the sample design, the question system and the shift in survey method were confirmed in the Korea Community Health Survey material KDCA publishes and in the mixed-mode pilot report carried in KDCA's Public Health Weekly Report. Nothing has been published about how the chatbot calculates internally, so that is not covered here. If you have tried the chatbot, it is worth checking once whether anything next to the light you got back said who you were compared with.
Pebblous Data Communication Team
October 30, 2026
References
Announcement & Press Coverage
- 1.Korea Policy Briefing. (2026). "AI Health Assistant Chatbot Service Launches — Open to the Public 24 Hours a Day." korea.kr, Oct. 28, 2026.
- 2.Electronic Times (etnews). (2026). "KDCA and Ministry of Science and ICT Open 'AI Health Assistant' Built on 5 Million Health Records." Oct. 28, 2026.
- 3.AI Times. (2026). "Free AI Health Checks — Government Launches AI Chatbot on 5 Million Health Records." Oct. 28, 2026.
KDCA Official Materials
- 4.Korea Disease Control and Prevention Agency (KDCA). "Korea Community Health Survey Guidelines." Korea Community Health Survey.
- 5.KDCA. (2025). "2025 Korea Community Health Survey Results."
- 6.KDCA. "Rotating Survey Overview." Korea Community Health Survey.
Academic Papers
- 7.KDCA. (2025). "Design and Implementation of a Mixed-Mode Survey Pilot to Improve the Korea Community Health Survey Method." Public Health Weekly Report (PHWR), 18(48).
- 8."The Generational Health Drift: A Systematic Review of Evidence from the British Birth Cohort Studies." Population Studies, 2026.