2026.03 · Pebblous Data Communication Team

Reading time: ~15 min · 한국어

Executive Summary

This post presents key insights from Quality Diagnosis Report #59 of the Korean Image (Food) dataset, generated using Pebblous DataClinic.

The Korean Image (Food) dataset is a large-scale Korean cuisine dataset comprising 150 classes and 150,507 images, ranging from Galbitang(갈비탕, short rib soup) to Korean fried chicken. L1 (Basic Quality) DataClinic overall diagnosis scored a quality score of 71 (Fair). In terms of class balance, it shows a textbook-level distribution with a minimum of 992 and maximum of 1,125 images per class, with a standard deviation of just 16.8.

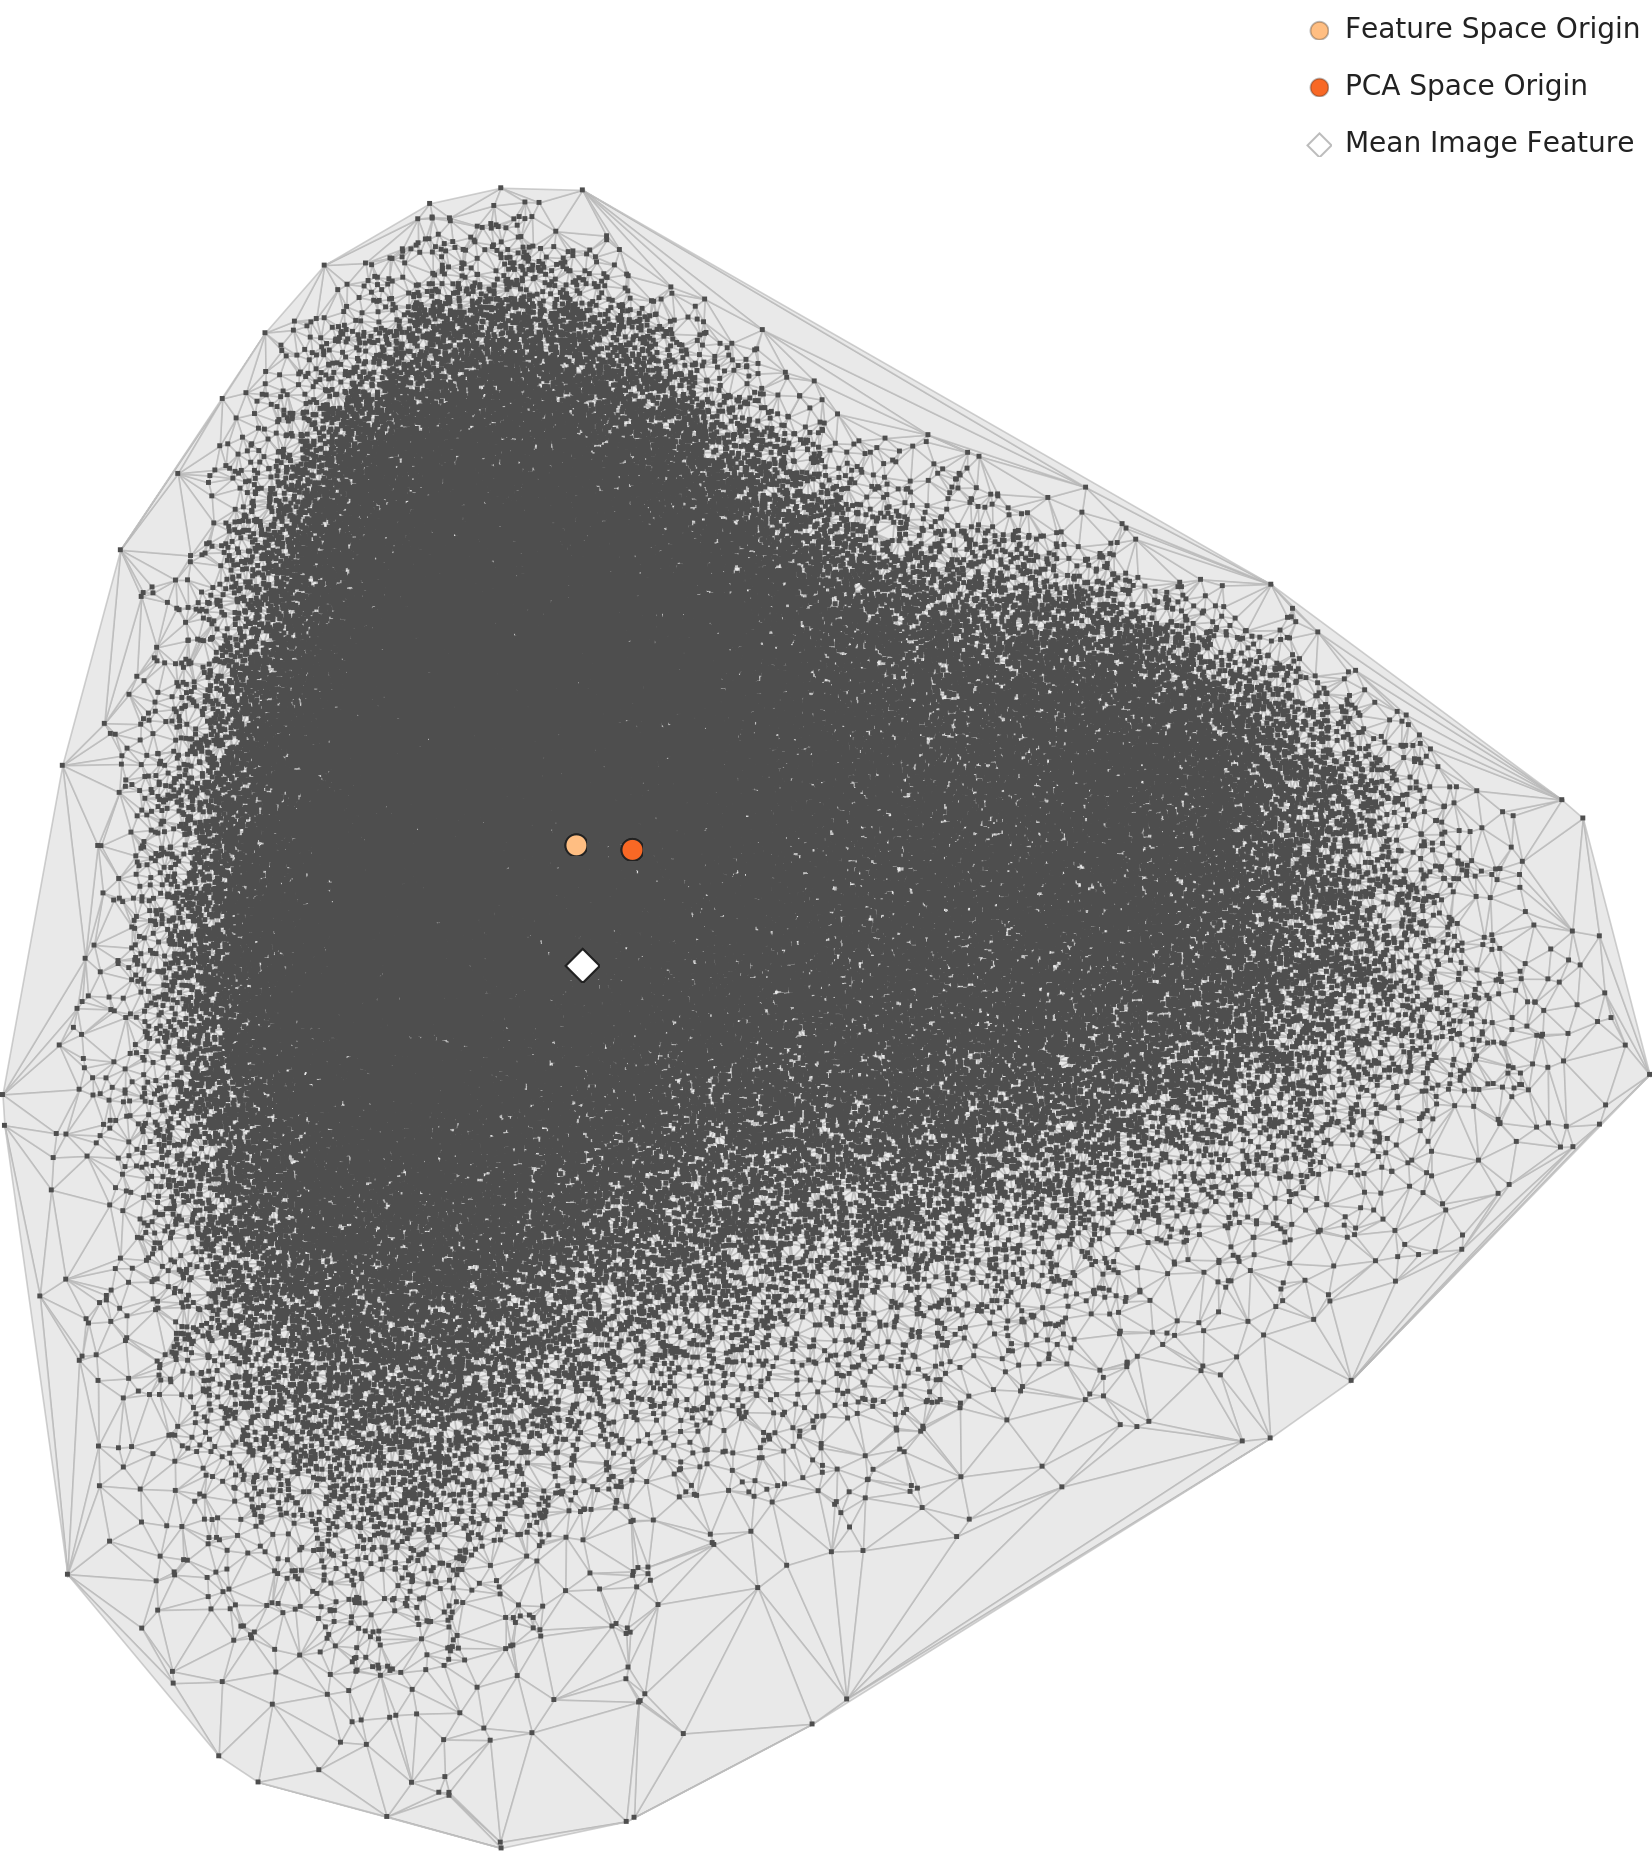
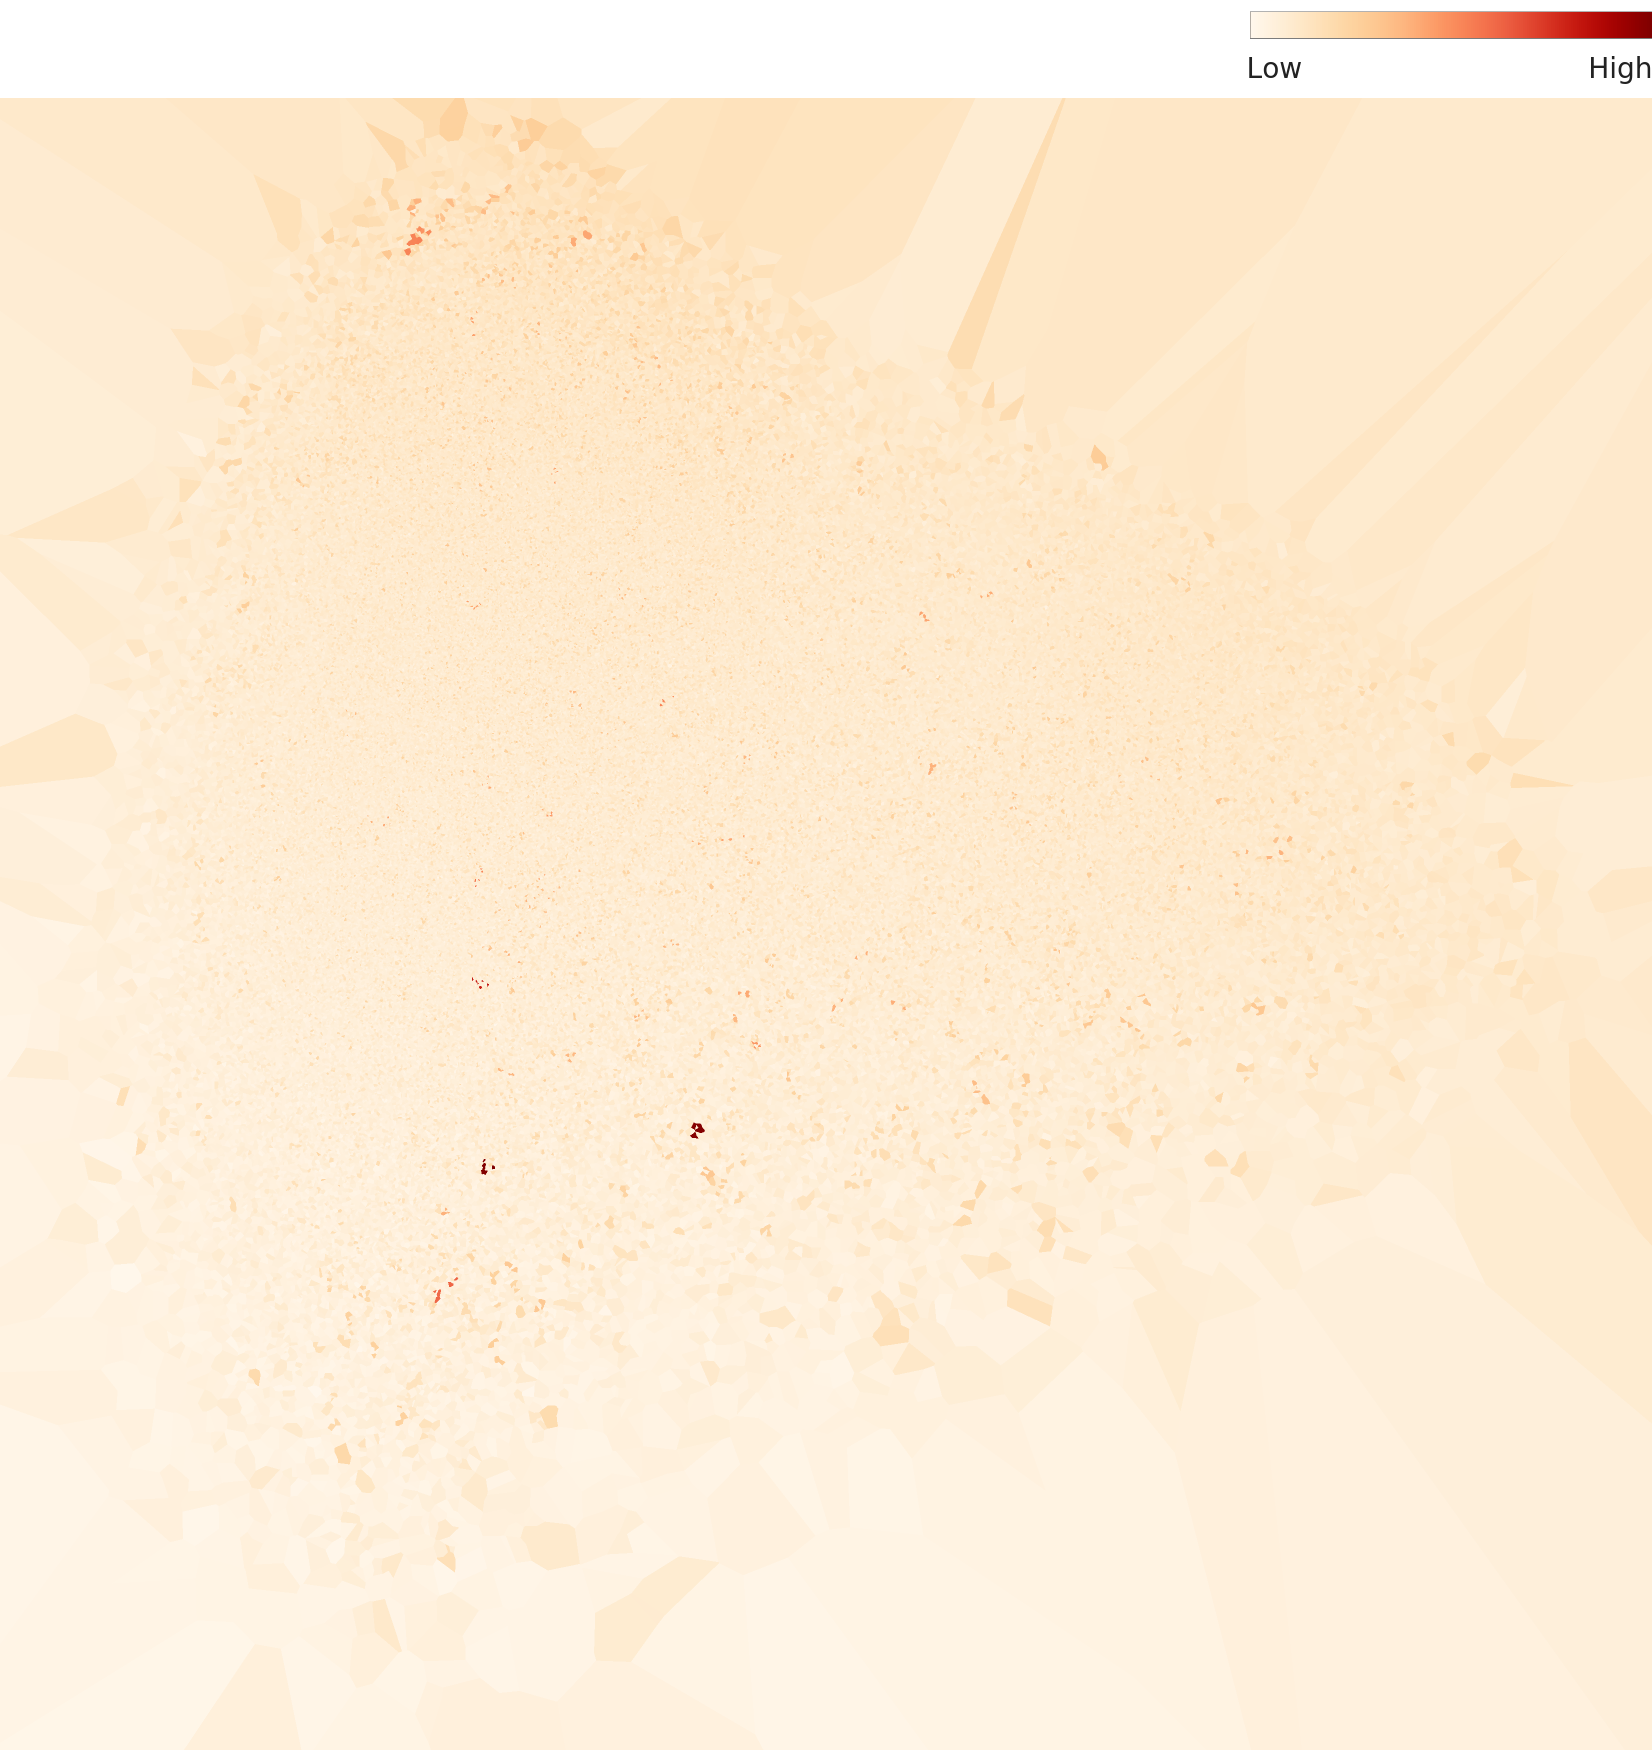
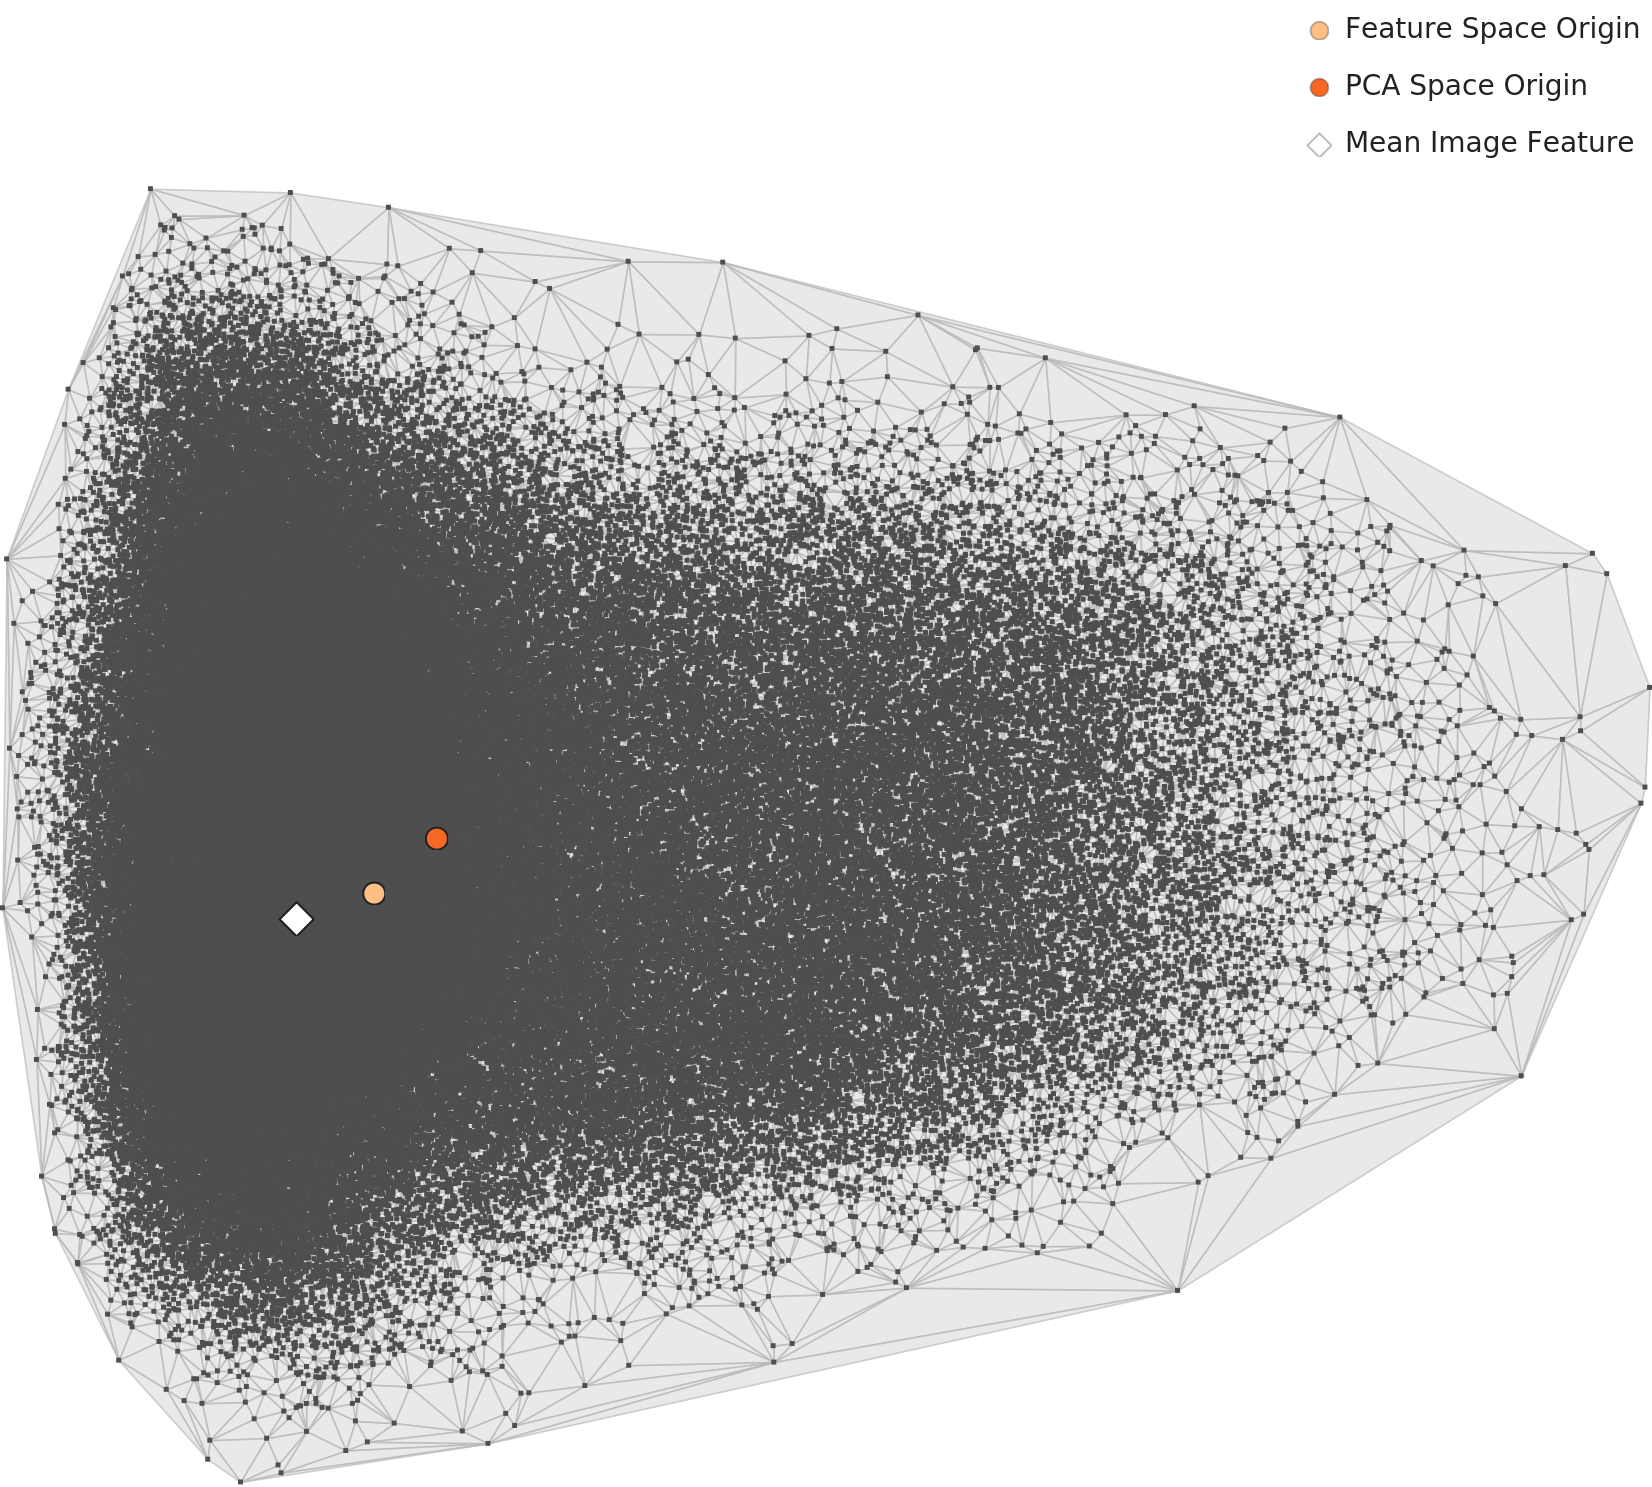
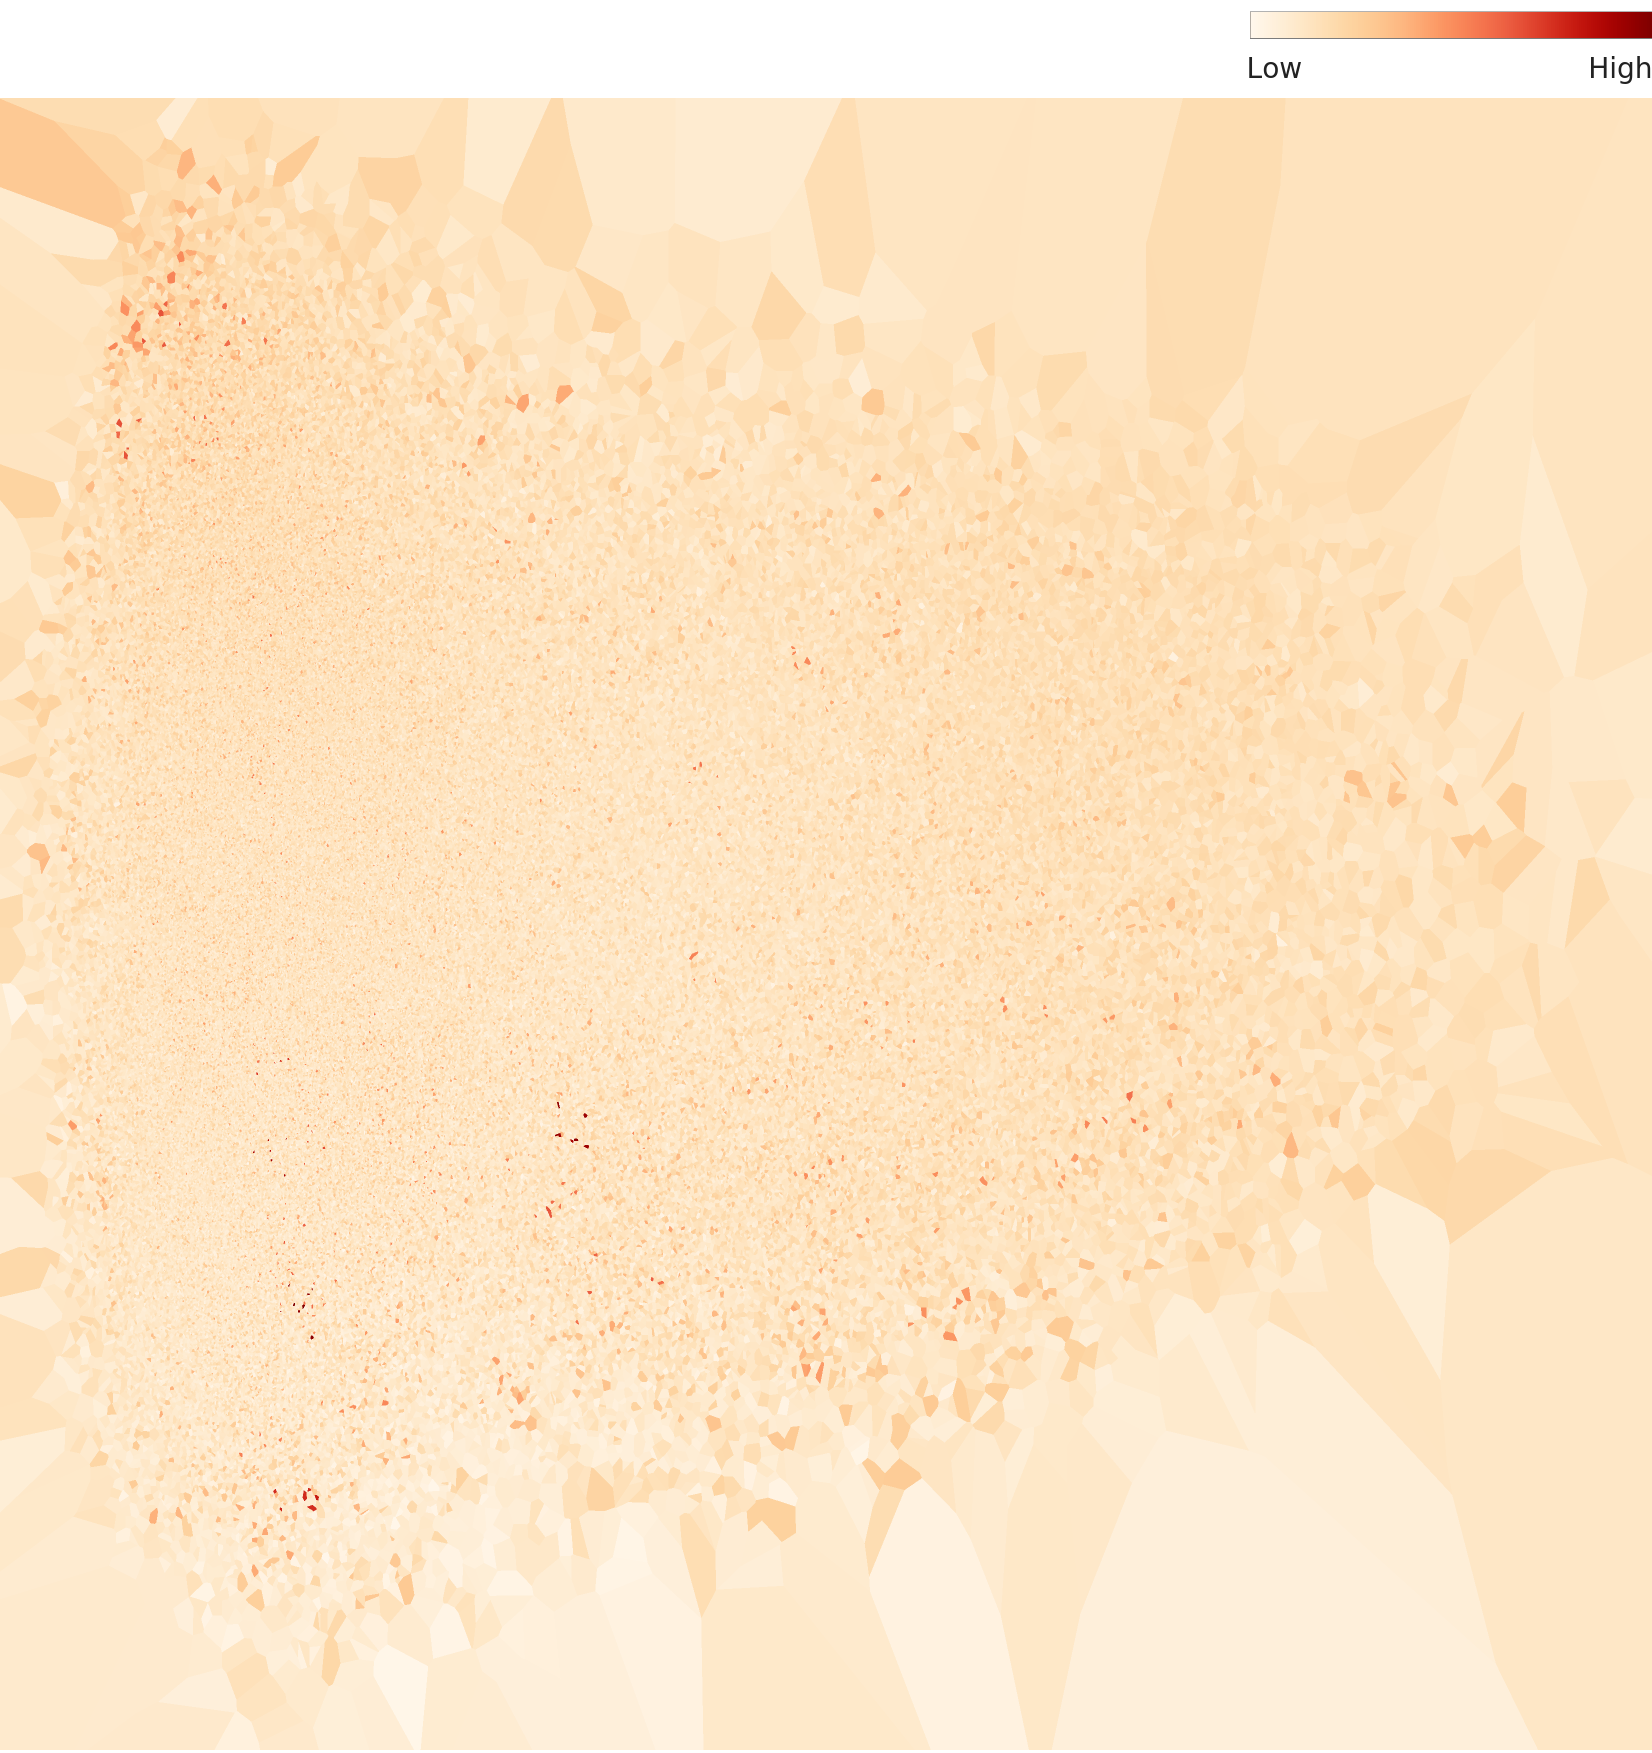
L2 (Feature Space Analysis) Wolfram ImageIdentify Net V2 (1,280 dimensions) revealed an intriguing pattern: general-purpose AI splits Korean food into two clusters -- soup-based dishes and dry dishes. In contrast, L3 (Domain-Specific Analysis, 129-dimension Korean food-specialized lens) merges these two clusters into a single unified Korean food space.

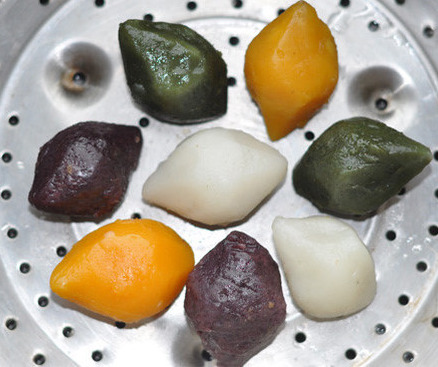
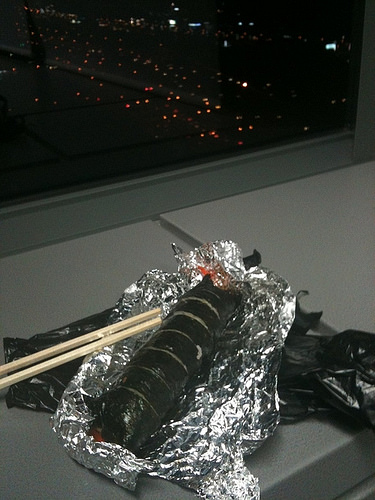
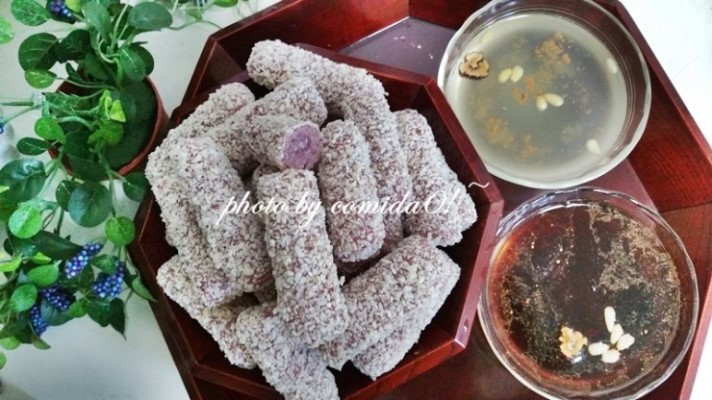
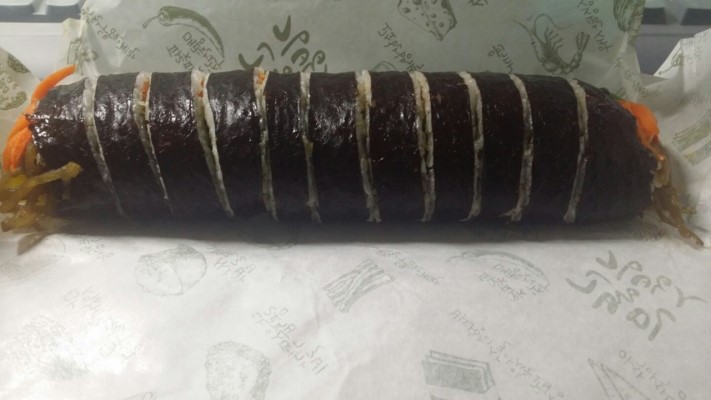
The most 'typical' food was Songpyeon(송편) (rice cake), while the most heterogeneous images were found in Gimbap(김밥) (seaweed rice rolls). Data Diet (deduplication) is recommended for classes with low visual diversity.

Dataset Overview — The World of 150 Korean Foods

The Korean Image (Food) dataset, published on AI Hub, is a large-scale Korean food vision dataset comprising 150 classes and 150,507 images, spanning from traditional Korean dishes to modern street food. It is commercially licensed, making it immediately available for developing AI-powered food recognition services.

The 150 classes capture the full landscape of Korean food culture:

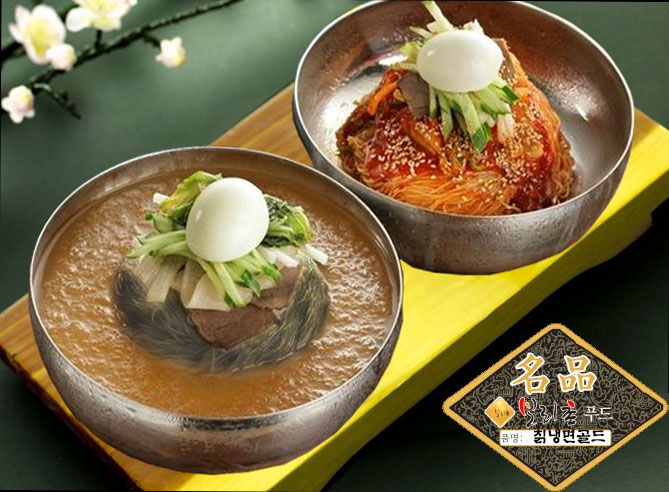
  • Soups & Stews — Galbitang(갈비탕, short rib soup), Mul-naengmyeon(물냉면, cold noodles), Samgyetang(삼계탕, ginseng chicken), Chueotang(추어탕, loach soup), Yukgaejang(육개장, spicy beef soup), Dakgaejang(닭개장, spicy chicken soup), Muguk(무국, radish soup)
  • Grilled — Galbi-gui(갈비구이, grilled ribs), Samgyeopsal(삼겹살, pork belly), Galchi-gui(갈치구이, grilled hairtail), Godeungeo-gui(고등어구이, grilled mackerel)
  • Braised & Stir-fried — Gaji-bokkeum(가지볶음, stir-fried eggplant), Kkaennip-jangajji(깻잎장아찌, pickled perilla leaves), Ganjang-gejang(간장게장, soy-marinated crab), Galbi-jjim(갈비찜, braised ribs)
  • Street Food — Gimbap(김밥, seaweed rice rolls), Ramyeon(라면, instant noodles), Mandu(만두, dumplings), Tteokbokki(떡볶이, spicy rice cakes), Sundae(순대, blood sausage)
  • Traditional Rice Cakes — Songpyeon(송편), Gyeongdan(경단, rice balls), Kkultteok(꿀떡, honey rice cake), Hangwa(한과, traditional confections)
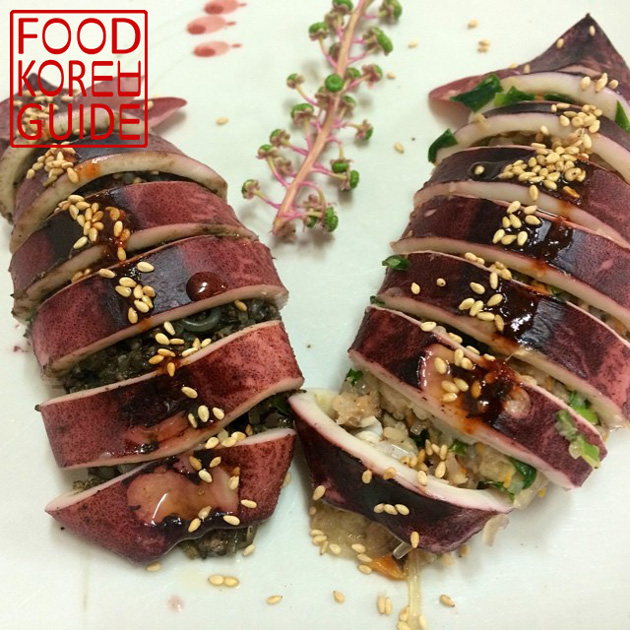
  • Seafood — Meongge(멍게, sea squirt), Gwamegi (semi-dried fish), Jeotgal (fermented seafood)
  • Others — Korean fried chicken, Jajangmyeon (black bean noodles), Jjamppong (spicy seafood noodles), and other Korean-adapted versions of foreign dishes

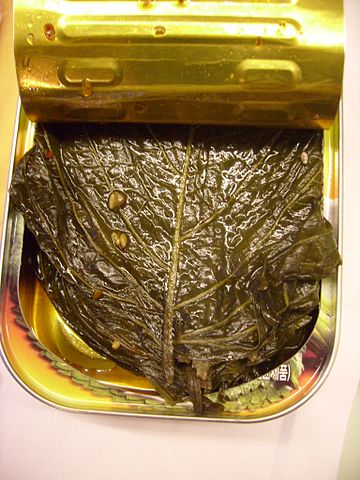
Each food name carries the context of Korean food culture. Meongge(멍게, sea squirt) is one of the most difficult foods for AI models to recognize due to its distinctive fishy aroma and vermillion color. Gwamegi is a winter seasonal food from the Pohang region that is visually hard to distinguish from regular dried fish. How these 'domain-knowledge-demanding foods' affect data quality is at the core of this diagnosis.

Korean Food Dataset — Collage of 150 Korean Food Classes

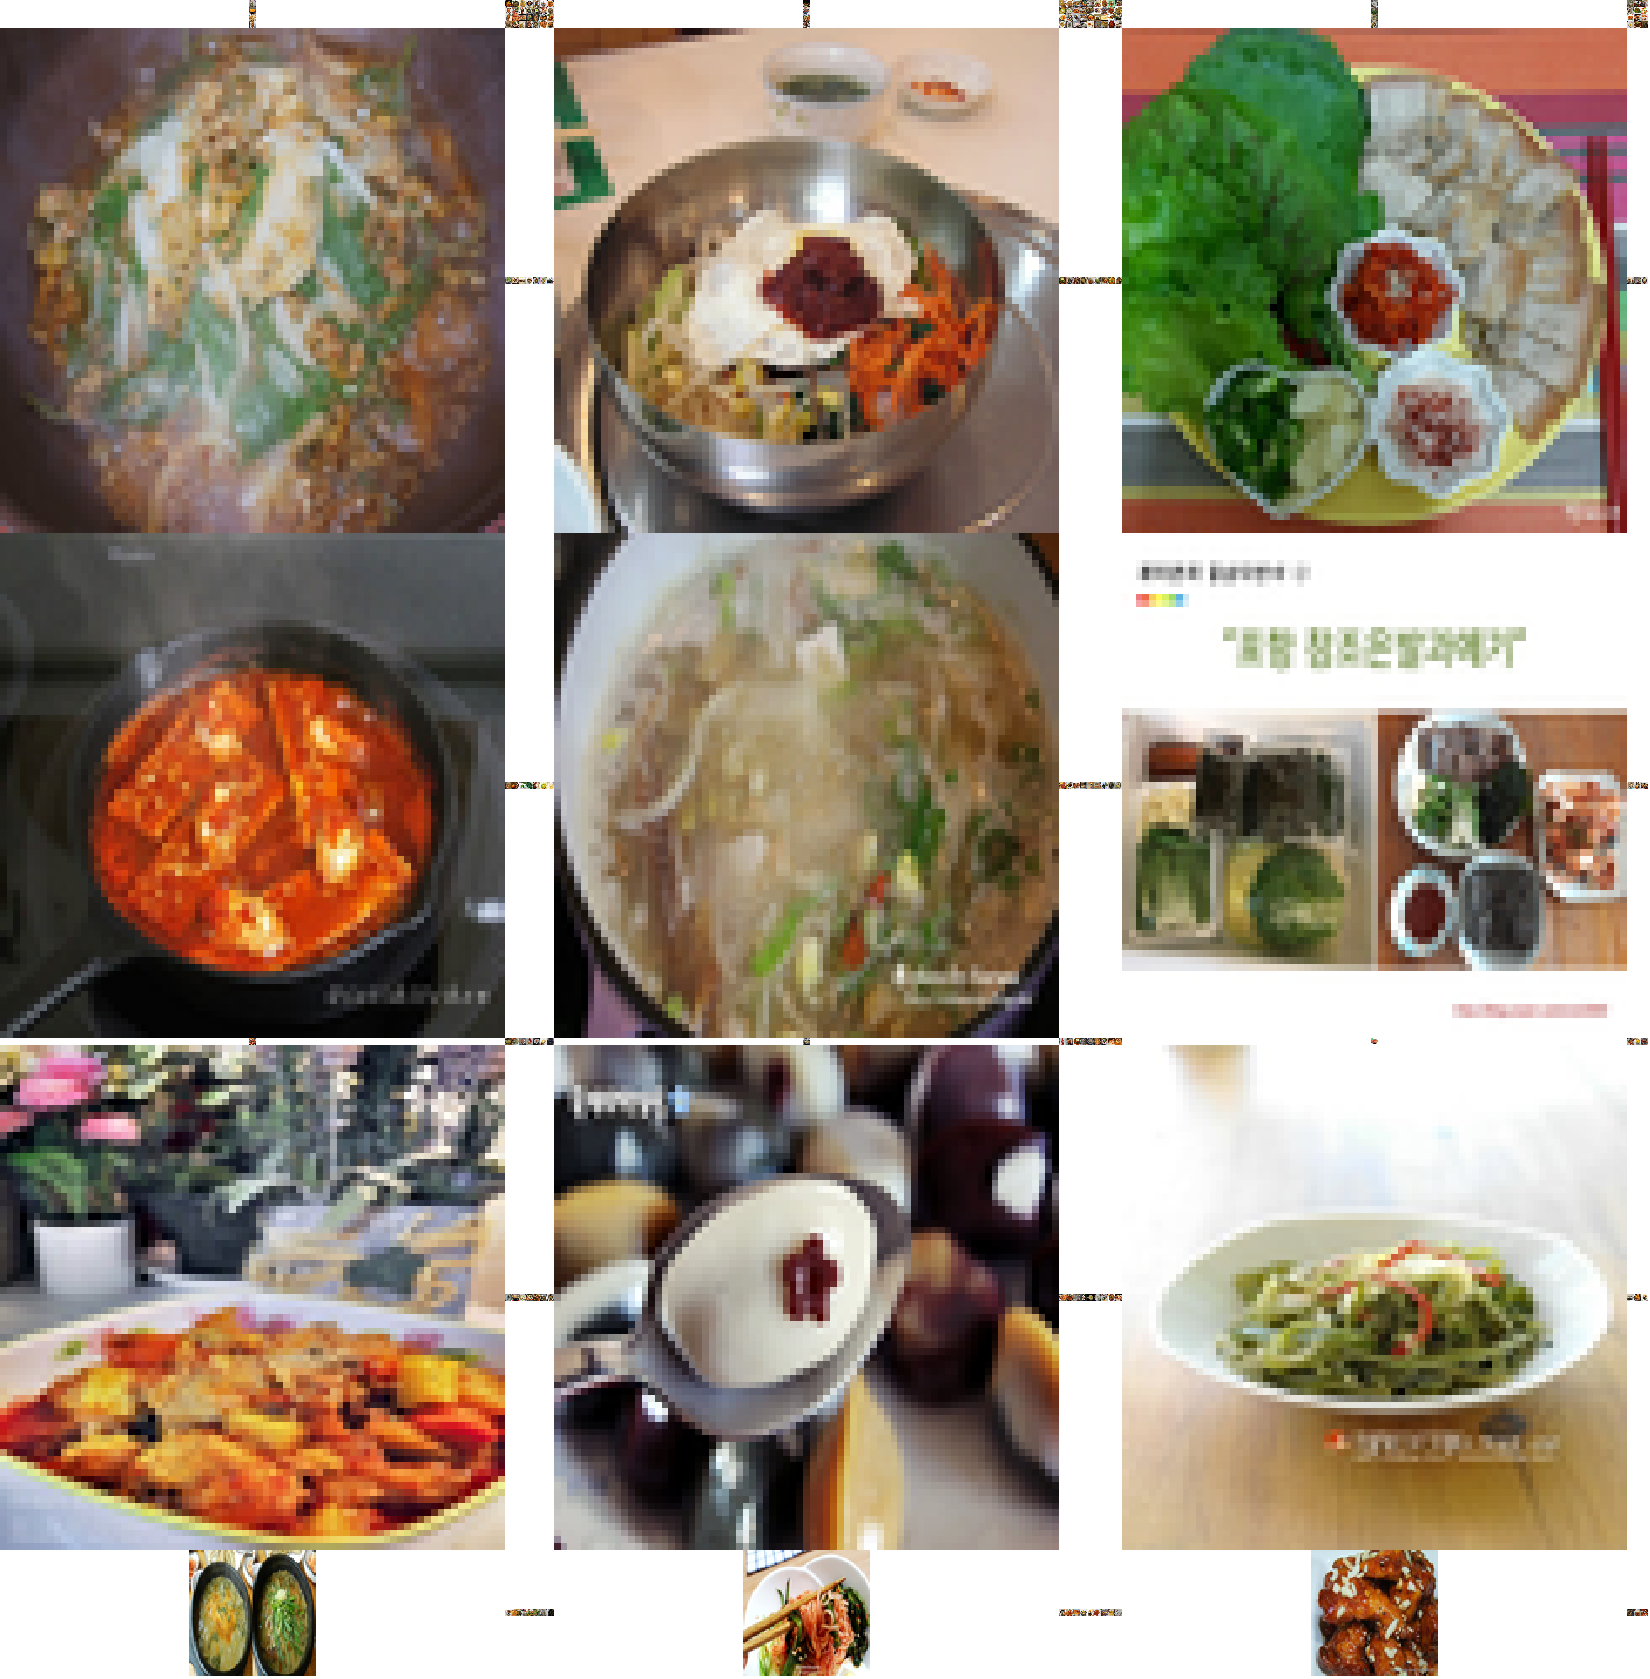
Korean Food Dataset — Representative image collage of 150 Korean food classes (DataClinic L1 analysis)

Gyeongdan class mean image
Gyeongdan(경단)
Gimbap class mean image
Gimbap(김밥)
Kkultteok class mean image
Kkultteok(꿀떡)
Ramyeon class mean image
Ramyeon(라면)
Mandu class mean image
Mandu(만두)
Meongge class mean image
Meongge(멍게)

Class mean images -- pixel-level averages of ~1,000 images per class. Higher visual consistency produces sharper results.

Overall Diagnosis — Quality Score: 71 (Fair)

DataClinic Overall Score: 71 (Fair)
150
Classes
150,507
Total Images
1,003
Avg. per Class
16.8
Class Balance Std. Dev.

A score of 71 places it in the 'Fair' grade, which is actually above average among large-scale public datasets. The fundamental strength of class balance is excellent, but insufficient visual diversity in some classes drags the score down. With commercial licensing, this dataset is ready for real-world AI development.

Level 1: Basic Quality Check — Pixel-Level Health Exam

Level 1 examines image integrity, missing values, class balance, and pixel statistics. This is the first health check DataClinic performs upon receiving the raw data.

Class Balance: Textbook-Level

Image counts across 150 classes range from a minimum of 992 to a maximum of 1,125, with a standard deviation of just 16.8. This is a distribution that appears deliberately balanced. For comparison, the WikiArt dataset's class balance standard deviation runs into the thousands. This means the risk of model bias toward specific foods during training is extremely low.

Image Resolution: Wide Spectrum

Image dimensions range from 121x91px to 6,048x4,032px, a very wide distribution. This reflects collection from diverse sources, from smartphone snapshots to professional DSLR photography. Resolution standardization preprocessing is essential for AI training. In particular, images at the minimum resolution of 121x91px require upscaling for standard models like ResNet-50 (which expects 224x224px input).

Channel Composition: Stable

99.42% of all images are standard 3-channel RGB. 0.33% contain an alpha channel (RGBa) and 0.25% are other formats, meaning only 0.58% of total images require alpha channel removal or RGB conversion during preprocessing.

Missing Values: Negligible

Out of the original 150,610 images, 103 (0.07%) were missing, leaving 150,507 images for actual diagnosis. A 0.07% rate is very low by large-scale web-crawled dataset standards and is practically negligible.

Domain Insight: What Class Mean Images Reveal

Looking at the mean images above, Gyeongdan(경단) and Kkultteok(꿀떡) appear sharp, while Gimbap(김밥) is slightly blurry. This indicates that Gyeongdan and Kkultteok are visually consistent foods (similar color, shape, arrangement), while Gimbap exhibits diverse photography styles -- cross-sections, roll forms, and various plating arrangements. The sharpness of a mean image directly reflects intra-class visual consistency.

Level 2: Korean Food Through a General-Purpose AI Lens — Two Worlds

Level 2 extracts features from the entire dataset using Wolfram ImageIdentify Net V2 (1,280-dimensional feature vectors) and analyzes their distribution. This neural network is a general-purpose image recognition model, not specialized for the food domain. In other words, it views Korean food through the eyes of a layperson, not a chef.

Two Clusters: Soup vs. Dry

PCA and density topography analysis reveal that through a general-purpose lens, Korean food splits into two distinct clusters. Interpreting the results with domain knowledge:

  • Cluster A (Dry food group) — Grilled, stir-fried, rice cakes, pancakes, street food. Characterized by solid forms and rich colors
  • Cluster B (Soup-based food group) — Soups, stews, noodle dishes. Characterized by liquid forms in wide bowls

This is evidence that Korean cuisine's distinctive 'soup culture' is faithfully reflected in image data. Even without knowing recipes or ingredients, a general-purpose AI naturally learns the 'with broth / without broth' distinction based solely on visual structure.

The PCA visualization below shows the distribution of per-class mean features:

L2 PCA — Korean Image (Food) per-class mean feature distribution

Distribution: Bell-Shaped — Healthy

The overall density distribution maintains a bell-shaped curve. Most images cluster near the center of the feature space, with a small number of outliers at the extremes. This is a healthy data structure approximating a normal distribution.

L2 overall density plot — Korean Image (Food)

Per-Class Density Comparison: Ramyeon(라면) vs. Meongge(멍게)

Comparing per-class density distributions reveals interesting differences. Ramyeon shows a narrow, high-peaked density distribution, while Meongge has a relatively wide and flat distribution. Ramyeon has high visual consistency with its red broth + noodles + scallion combination, whereas Meongge is photographed in diverse states -- raw, prepared, and plated.

Ramyeon class density distribution

Ramyeon(라면) — Narrow, concentrated density distribution

Meongge class density distribution

Meongge(멍게) — Wide, diverse density distribution

Level 3: Domain-Specific Lens — Two Worlds Become One

Level 3 applies a 129-dimensional lens specialized for the Korean food dataset, built on top of Wolfram ImageIdentify Net V2. Instead of a general-purpose perspective, it re-examines the data through the eyes of a Korean food expert.

Cluster Unification: Two Become One

The most notable change is that the two clusters visible in Level 2 merge into one. While the general-purpose lens responded to the visual structure of 'broth presence,' the domain-specific lens prioritizes the shared identity of 'Korean food.'

This has important implications for real-world AI service development. When building a Korean food recognition model, using a general-purpose backbone directly may cause soup-based and dry foods to be treated as entirely different domains. However, using a Korean food-specialized feature extractor creates a more unified recognition space.

The L3 PCA visualization confirms the unified distribution:

L3 PCA — Korean food domain-specific lens class distribution

Distribution: Still Bell-Shaped — Stable

Even with the domain-specific lens, the overall distribution maintains a bell-shaped form. The fact that clusters merged while preserving a healthy distribution shape demonstrates that domain specialization is not mere compression, but meaningful representation learning.

L3 overall density plot — Korean food domain-specific

Outlier Analysis — Why Songpyeon Is the Most 'Typical'

DataClinic uses density-based outlier analysis to identify the most typical samples (high density) and the most atypical samples (low density) in the dataset.

High-Density Samples — AI's 'Typical Korean Food'

High-density samples -- images closest to the center of the feature space -- are dominated by Songpyeon(송편) and Mul-naengmyeon(물냉면, cold noodles). This is no coincidence.

Songpyeon(송편) is a visually highly consistent food:

  • Uniform half-moon silhouette
  • Fixed color palette of white, pink, and green
  • Standardized composition neatly arranged on a plate
  • Often simple backgrounds with uniform lighting

From an AI perspective, Songpyeon(송편) is a "predictable" image. Nearly all Songpyeon photos produce similar feature vectors, resulting in high measured density.

Songpyeon high-density sample 1 (density 0.6961)
Songpyeon(송편) (High)
density: 0.6961
Songpyeon high-density sample 2 (density 0.6952)
Songpyeon(송편) (High)
density: 0.6952
Songpyeon high-density sample 3 (density 0.6945)
Songpyeon(송편) (High)
density: 0.6945
Mul-naengmyeon high-density sample (density 0.6957)
Naengmyeon(냉면) (High)
density: 0.6957

Low-Density Samples — The Identity of Outliers

The top low-density outliers include Gimbap(김밥), Sundae(순대, blood sausage), Kkaennip-jangajji(깻잎장아찌, pickled perilla leaves), and Samgyeopsal(삼겹살, pork belly). Their common trait is highly variable shooting angles, plating styles, and cooking states:

  • Gimbap — Cross-section views (exposing pickled radish and egg filling) vs. side views (cylindrical exterior) produce entirely different images
  • Samgyeopsal — Raw pink meat vs. grilled brown meat results in dramatically different colors
  • Kkaennip-jangajji — Standalone on a plate vs. used as a wrap
  • Sundae — Whole sausage vs. sliced cross-section exposure
Gimbap low-density outlier (density 0.0513)
Gimbap(김밥) (Low)
density: 0.0513
Sundae low-density outlier (density 0.0541)
Sundae(순대) (Low)
density: 0.0541
Kkaennip-jangajji low-density outlier (density 0.0552)
Kkaennip(깻잎장아찌) (Low)
density: 0.0552
Samgyeopsal low-density outlier (density 0.0566)
Samgyeopsal(삼겹살) (Low)
density: 0.0566

Most Dissimilar Pair: Hangwa(한과) vs. Gimbap(김밥)/Yukgaejang(육개장)

Similarity analysis identified the most distant image pairs in feature space. The combination of Hangwa(한과) (traditional confections) and Gimbap(김밥)/Yukgaejang(육개장) (spicy beef soup) is representative. Hangwa features golden-brown, dry, uniform confection shapes, while Gimbap is a black-and-white cylinder with colorful cross-sections, and Yukgaejang is a bowl brimming with red broth -- diametrically opposite in color, texture, and form.

Hangwa — most distant pair reference image

Hangwa(한과)

VS
Gimbap — most distant from Hangwa

Gimbap(김밥)

The most distant pair in feature space. Diametrically opposite in color, texture, and form.

Practical Application of Outlier Analysis

Low-density outliers carry two possible meanings: (1) Label errors -- images incorrectly labeled as belonging to a class they don't, or (2) Diversity-rich samples -- atypical but frequently encountered variations in real-world photography. The second case is actually important for improving model robustness. Manually reviewing DataClinic outlier samples to distinguish errors from diversity is the first step in quality improvement.

Improvement Recommendations — Data Diet Prescription

DataClinic recommends a Data Diet for this dataset. Despite textbook-level class balance, the quality score of 71 (Fair) is held back by insufficient visual diversity in certain classes.

What Is Data Diet?

Data Diet is not simply about reducing data. It involves identifying and removing near-duplicate images concentrated in high-density regions so that models can learn more diverse patterns.

  • Songpyeon(송편) — Half-moon shaped, pastel-colored images are densely clustered. Adding atypical images with varied lighting, rustic styling, and making-of scenes is recommended
  • Mul-naengmyeon(물냉면) — Center-of-bowl compositions are repetitive. More diverse angles and plating styles are recommended
  • High-density classes overall — After removing duplicate images, replace with images from diverse shooting environments (restaurants, homes, street food stalls)

Is Data Bulkup (Augmentation) Not Needed?

Since class balance is already excellent, Diet is more urgent than minority class augmentation. However, atypical seafood classes like Meongge(멍게), Gwamegi, and Jeotgal naturally have low visual diversity, so adding images from varied shooting conditions could significantly improve model robustness.

Key Takeaways

Class Balance: Textbook-level (Std. Dev. 16.8)

Missing Values: 0.07% — Negligible

Channel Composition: 99.42% RGB

Resolution Range: Preprocessing standardization required

High-Density Class Duplication: Data Diet recommended

Expected Improvement: Data Diet could raise score from 71 to 80+

Full diagnosis results and detailed analysis for all 150 classes are available at DataClinic Report #59.