2026.04 · Pebblous Data Communication Team
Reading time: ~14 min · 한국어
Executive Summary
This article is based on the findings of DataClinic Report #227. PBLS_Drone_classification is a synthetic drone image dataset produced by Pebblous in-house. It uses the same underlying imagery as the previously diagnosed PBLS_Drone (#226), but with classification labels for 12 distinct drone types added on top. The dataset contains 28,800 images — exactly 2,399 per class, achieving textbook-perfect balance. Yet DataClinic's overall score came in at 76 (Fair), lower than #226's 82. Why does flawless class balance still result in a lower score? That is the central question this diagnosis addresses.
#226 vs #227 — Same Data, Different Diagnosis
Adding class labels → 53-dimensional domain-specific lens applied → multi-cluster structure persists → score drops
DataClinic Grade Summary
Detection vs Classification — What's the Difference?
Drone AI breaks down into two fundamentally different problems.
Detection
"Is that a drone?" — binary discrimination
PBLS_Drone (#226) is designed for this. A single class groups all drone forms together, teaching the model the essence of "drone-ness."
Classification
"Which drone is that?" — type identification
The goal of PBLS_Drone_classification (#227). Distinguishing DR01–DR12 maps directly to Counter-UAS threat-level assessment.
In military operations, drone classification is more than a technical challenge. A small reconnaissance drone (DR01) and a loitering munition (DR05/DR09) represent entirely different threat levels. Only when AI can accurately classify the type can the appropriate response — jamming, laser intercept, or kinetic defense — be decided instantly.
Different data requirements: A detection model only needs to tell "drone vs. non-drone," so a single-class dataset suffices. A classification model must learn the discriminating features between classes, making both intra-class diversity and inter-class separability critical. This is the core reason the same image pool scores 82 for detection but only 76 for classification.
Dataset Overview — PBLS_Drone_classification
PBLS_Drone_classification is a synthetic drone image classification dataset produced in-house by Pebblous. 28,800 Full HD (1920×1080) RGB images — generated through the same CG rendering pipeline — have been systematically labelled with 12 drone type categories.
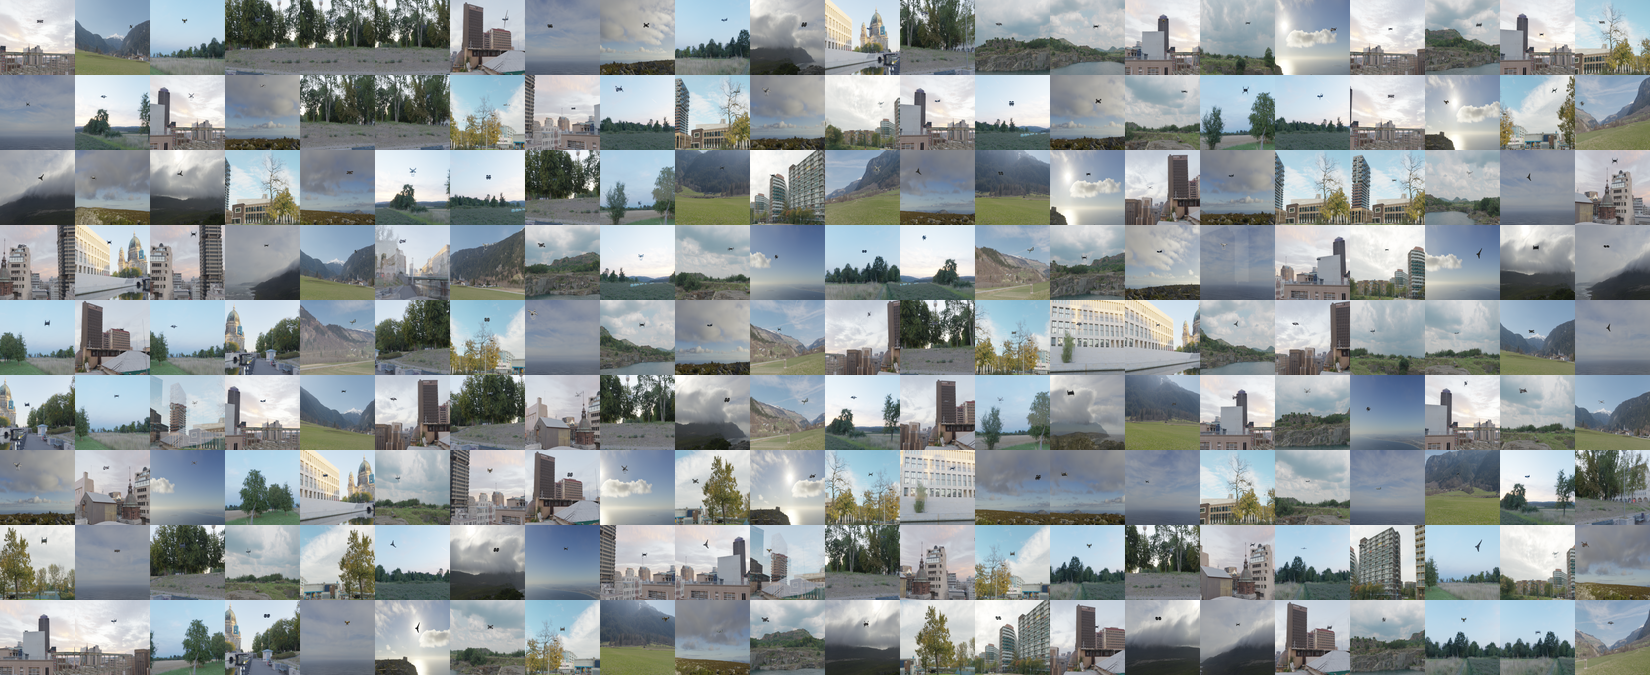
PBLS_Drone_classification — 12-class synthetic drone image collage (DataClinic L1)
Filename Structure — How Classes and Frames are Encoded
12 distinct UAV models
angle, distance, and background progression
12 types × 2,399 frames = 28,788 images (used in diagnosis). Each drone is captured continuously along a simulated flight path across varying angles and backgrounds.
📊 Dataset Specifications
- 🖼️ 28,800 images (28,788 used in diagnosis)
- 📦 52 GB (52,644 MB)
- 📐 1920×1080 px — Full HD
- 🎨 RGB channels — fully consistent
- 🏷️ 12 classes — DR01–DR12
- ⚖️ Perfect balance — 2,399 images per class, σ=0
🎯 Intended Applications
- 🛡️ Drone type classification AI model training
- 🎯 Threat-level identification system development
- 🔬 Fine-grained class discrimination benchmarking
- 🌐 Counter-UAS decision-making AI
- 📡 Multi-sensor fusion classification research
⚠️ Not for Commercial Use
This dataset was developed for defense-specific applications. Use is restricted to non-commercial purposes including research, education, and defense AI development.
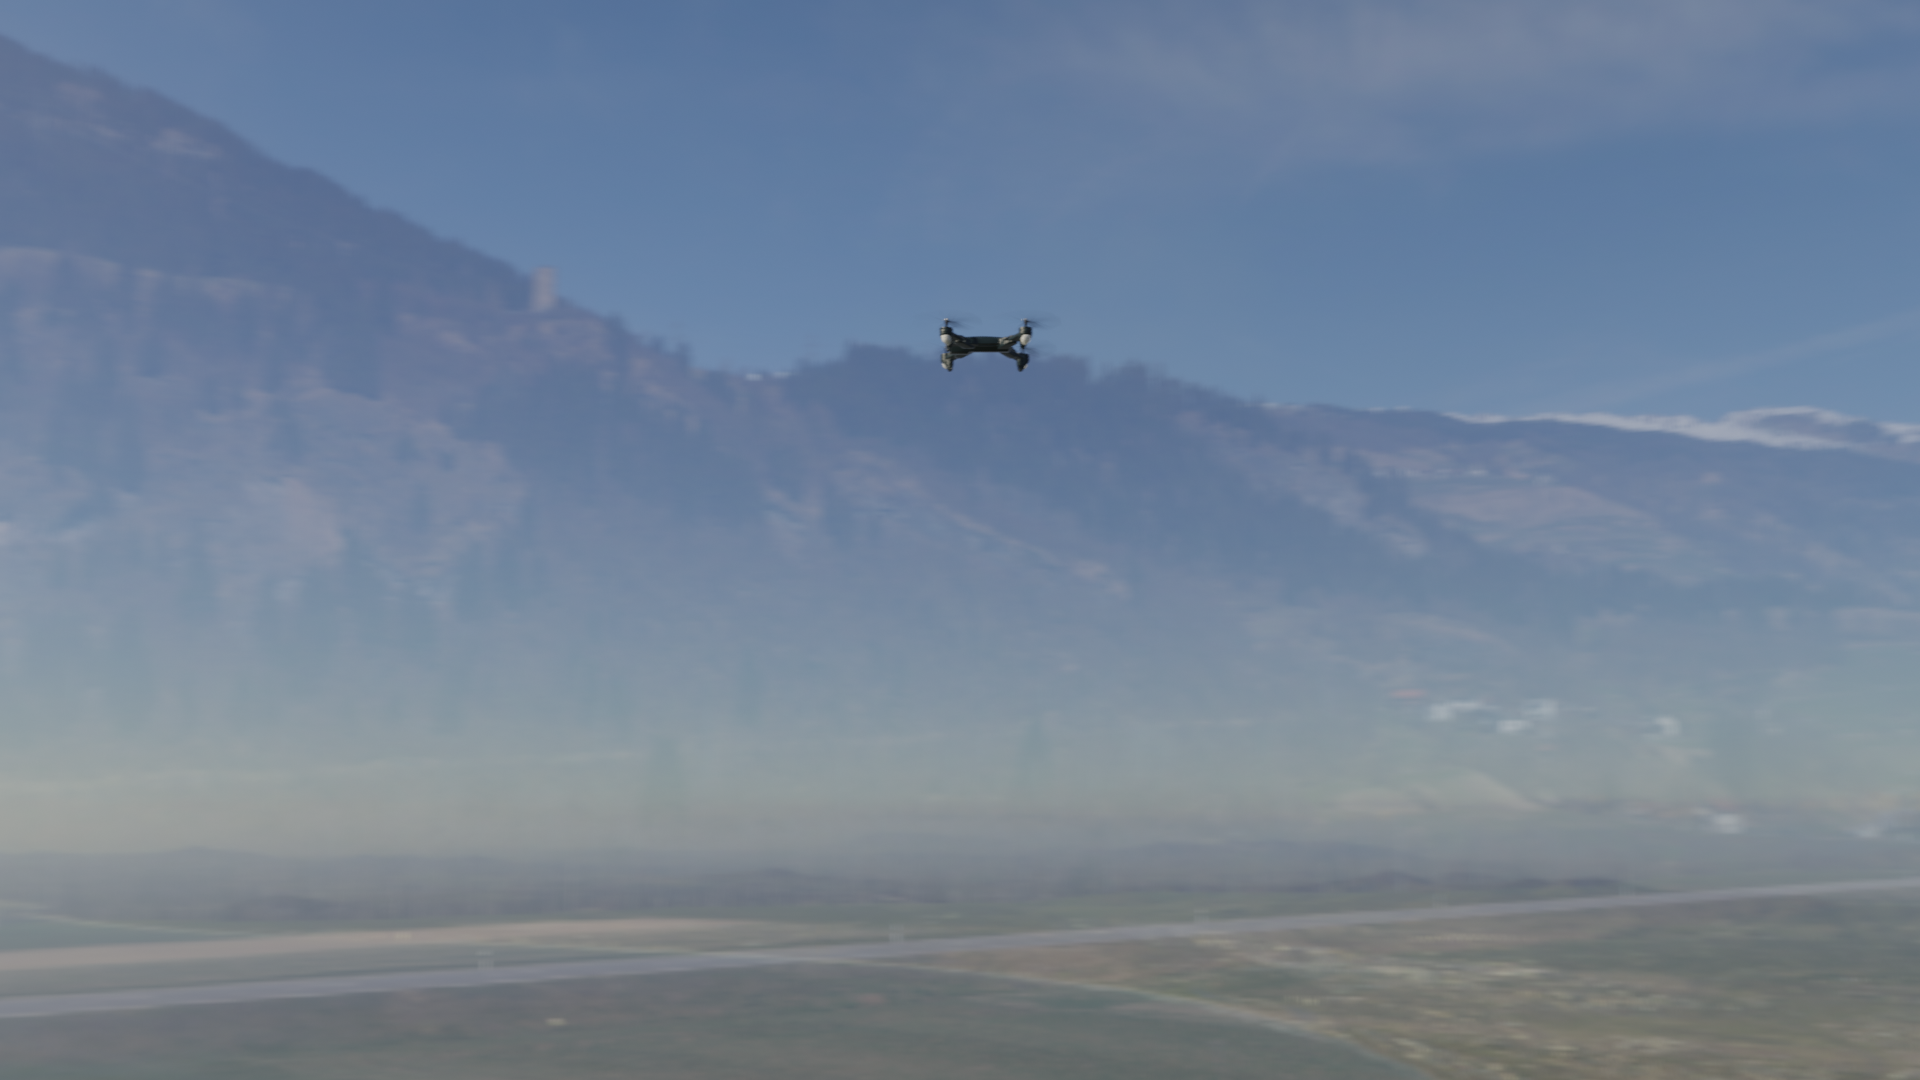
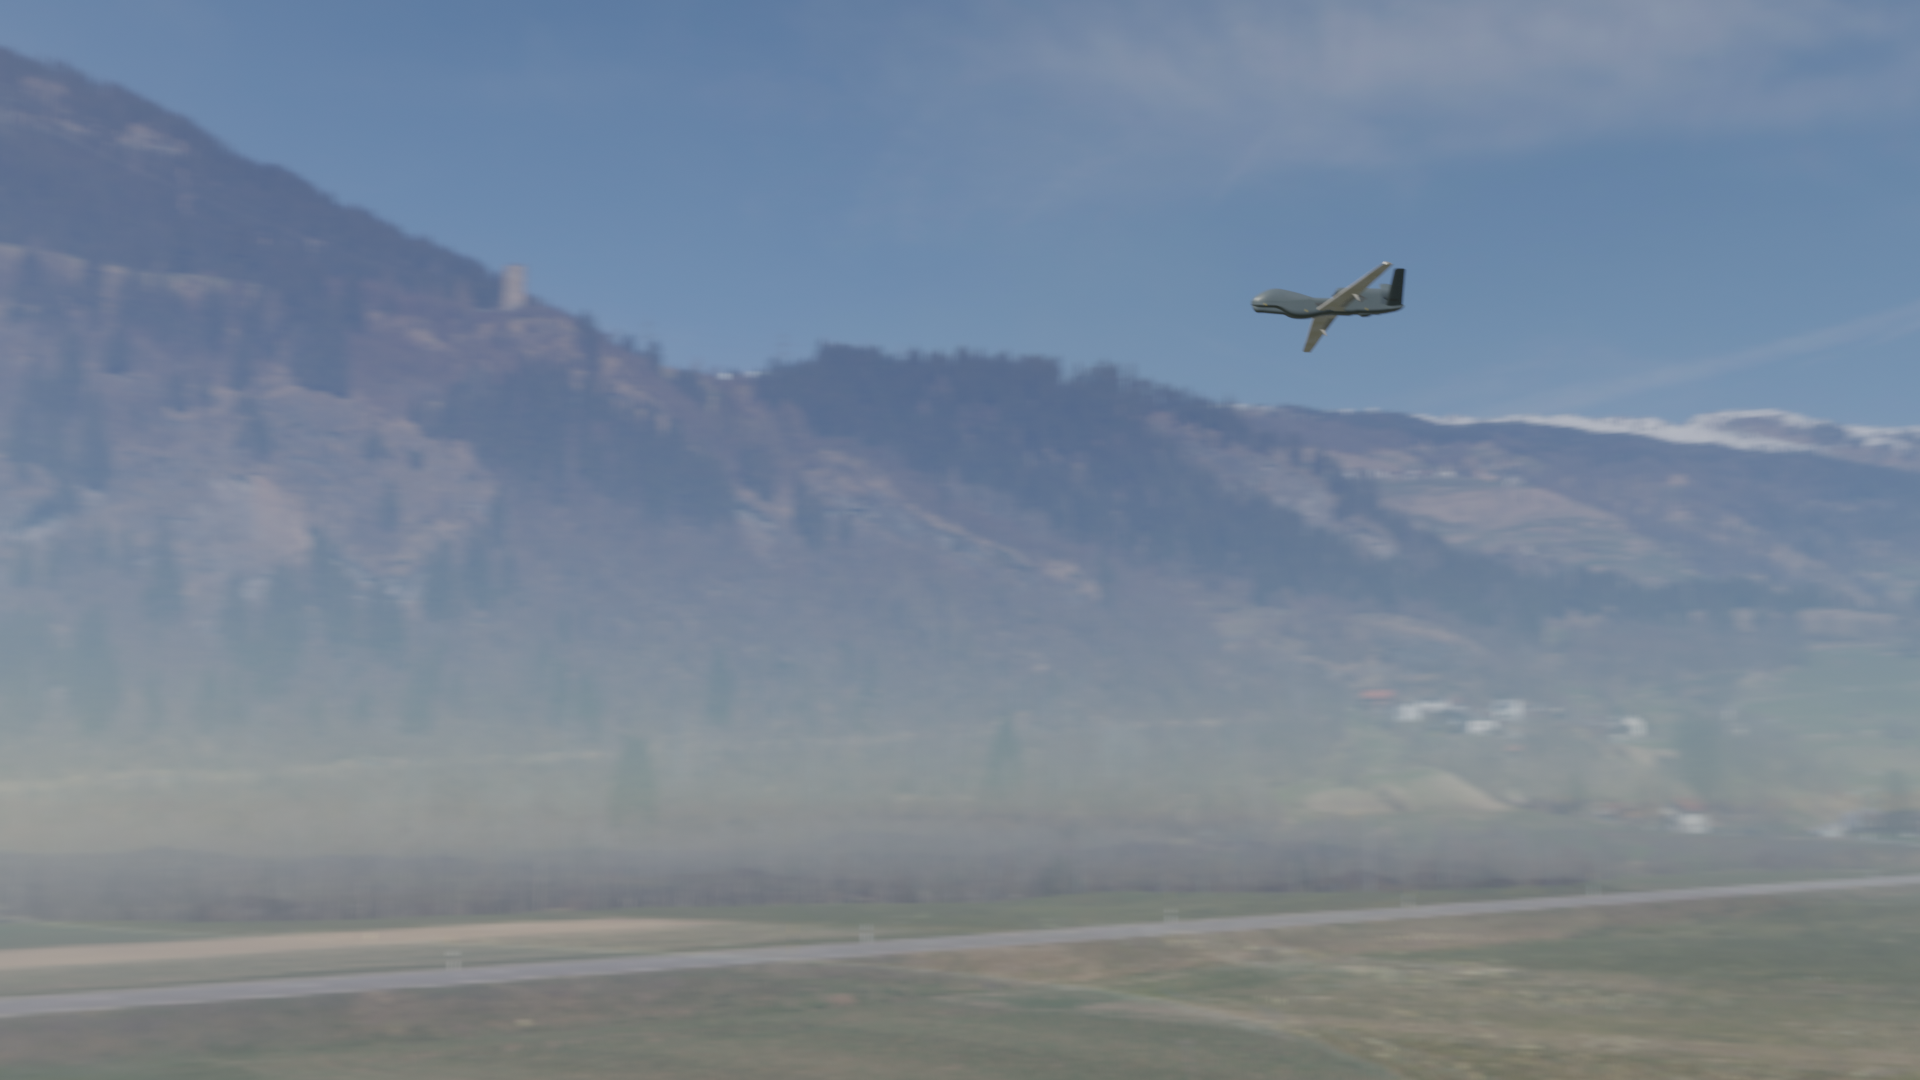
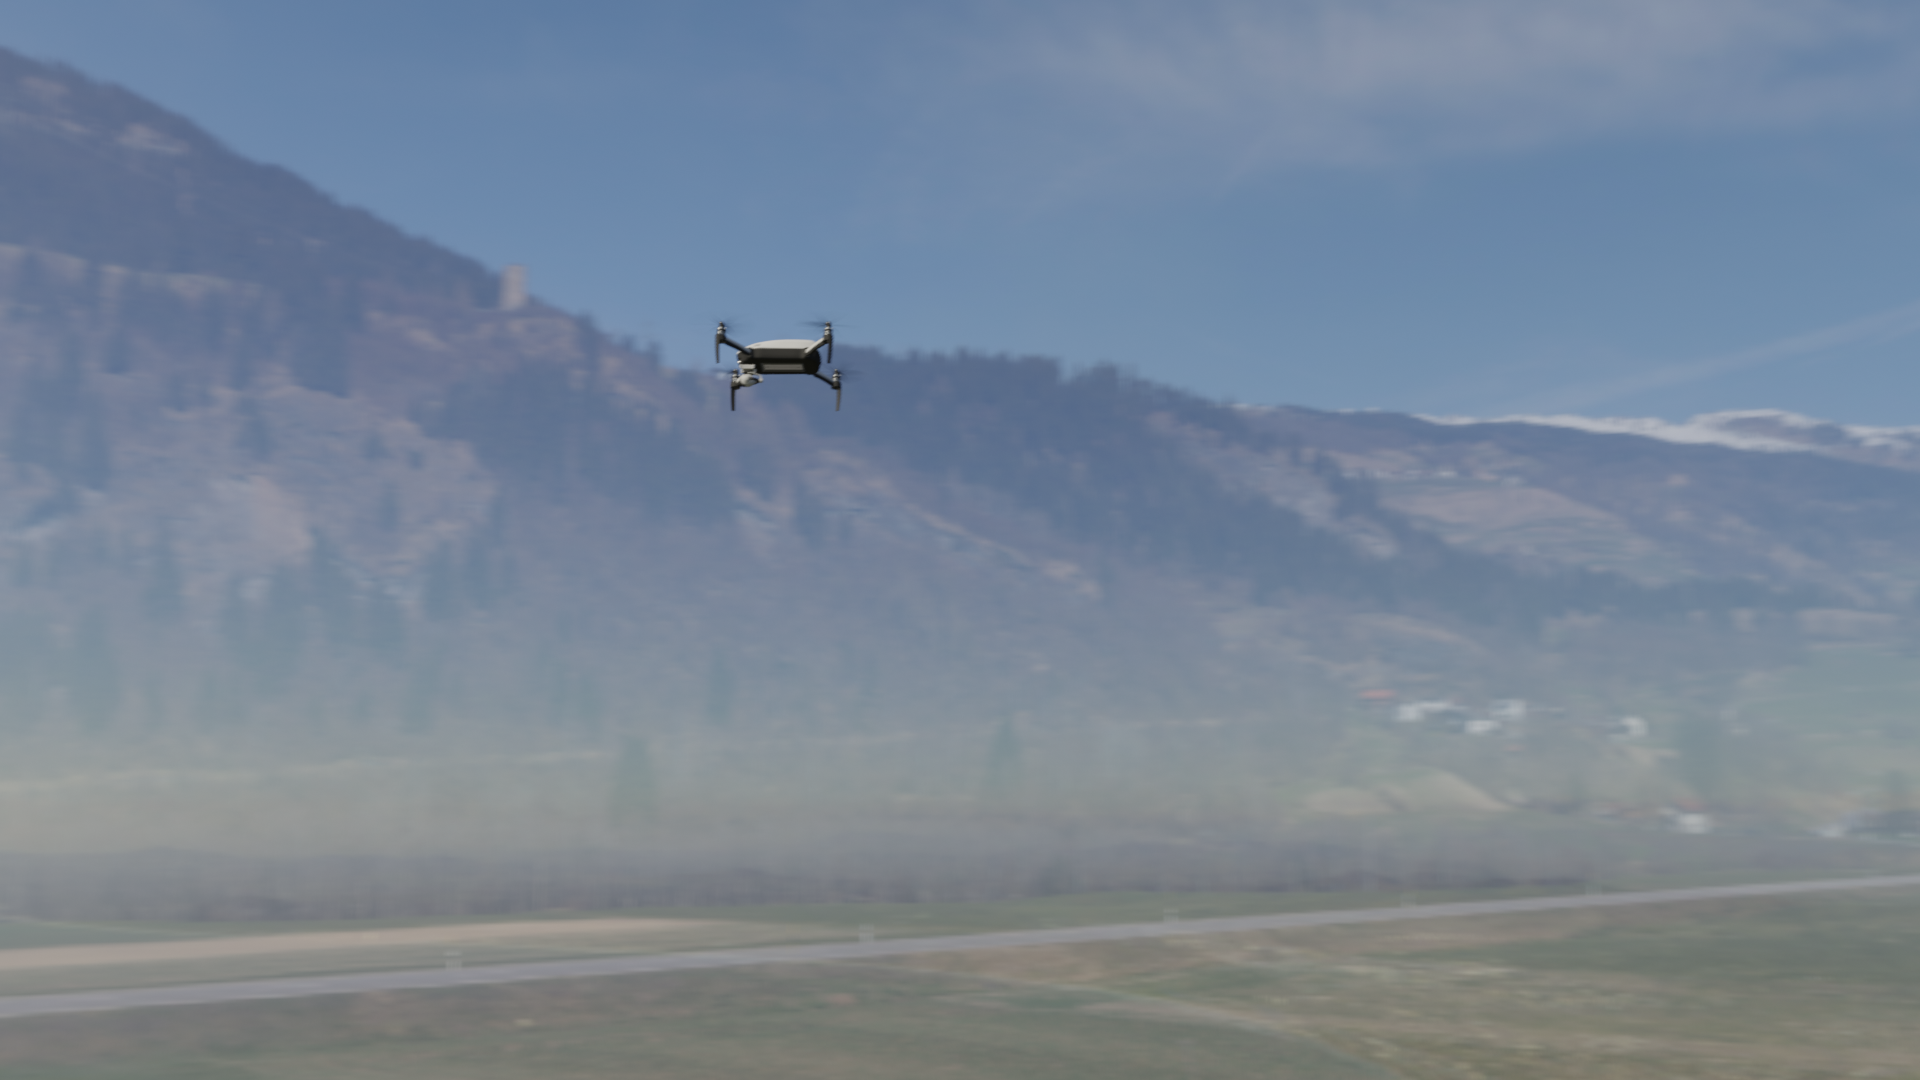
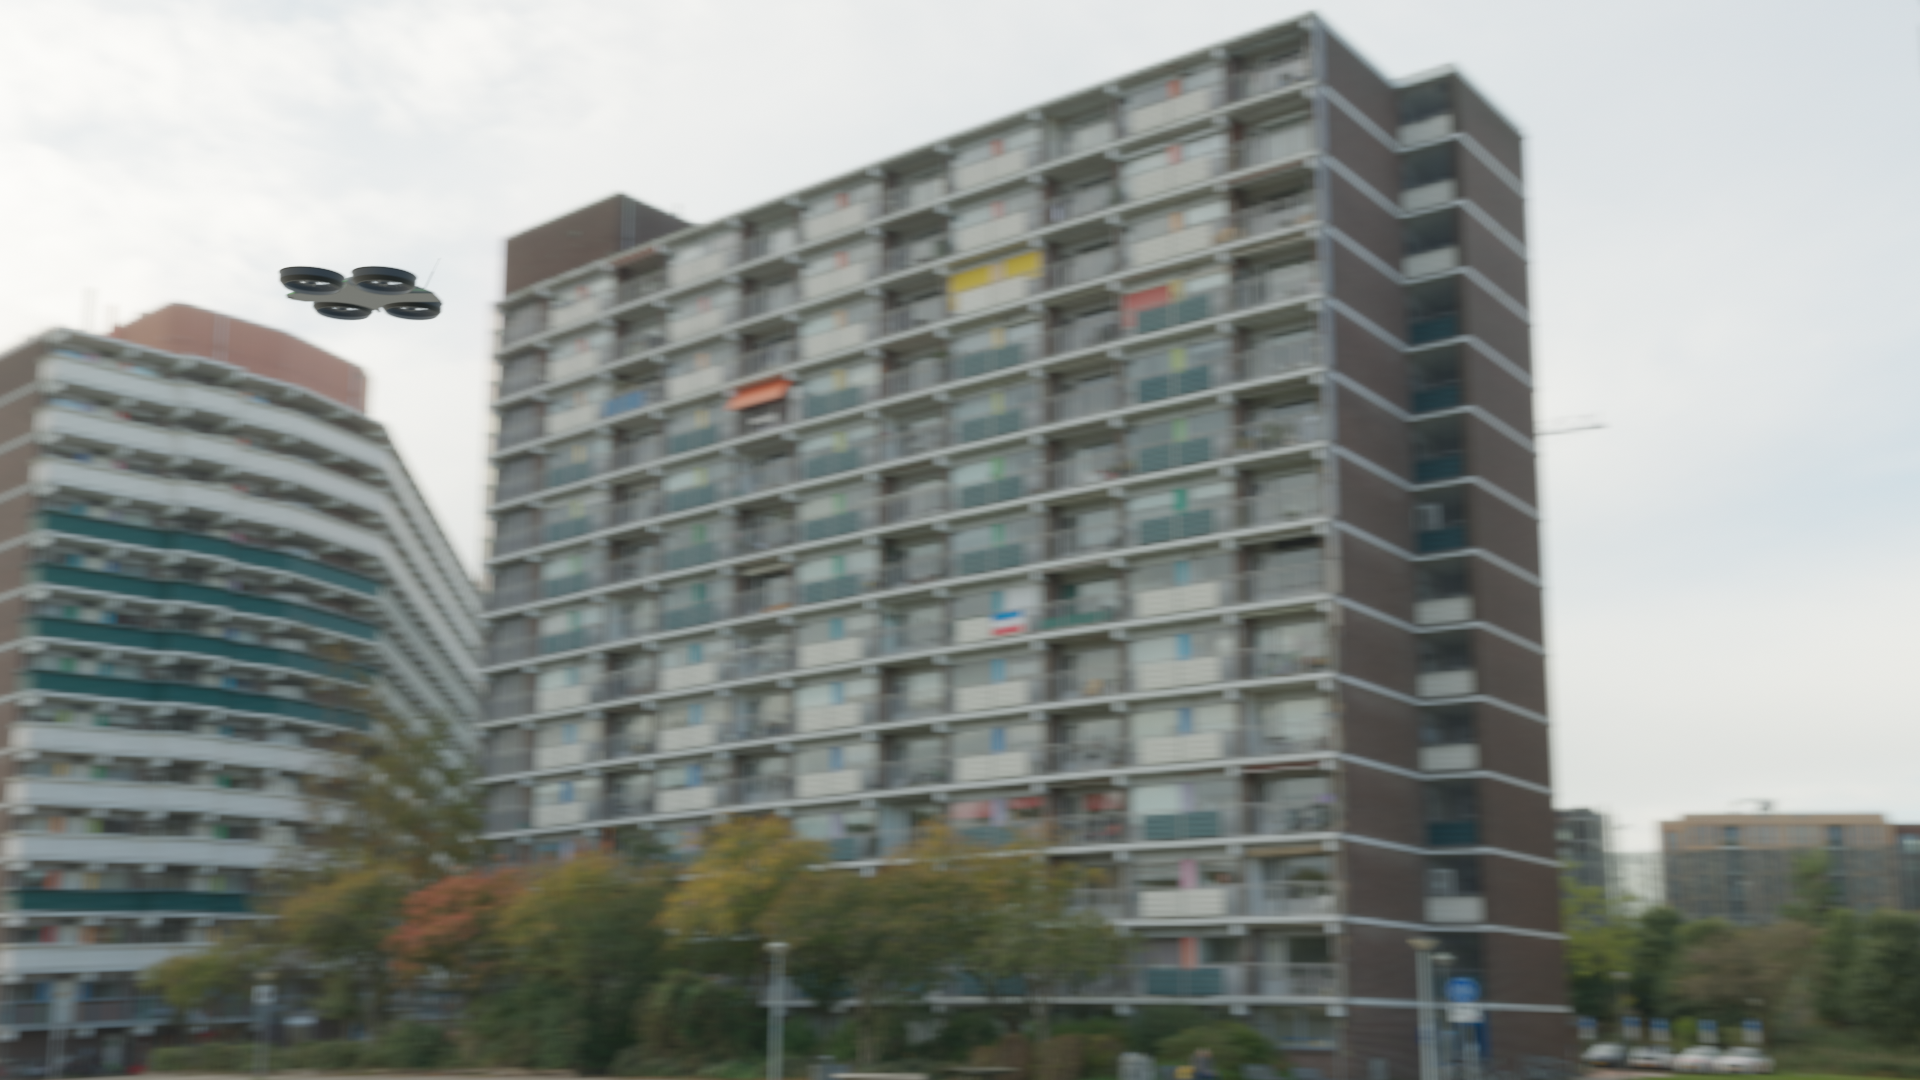
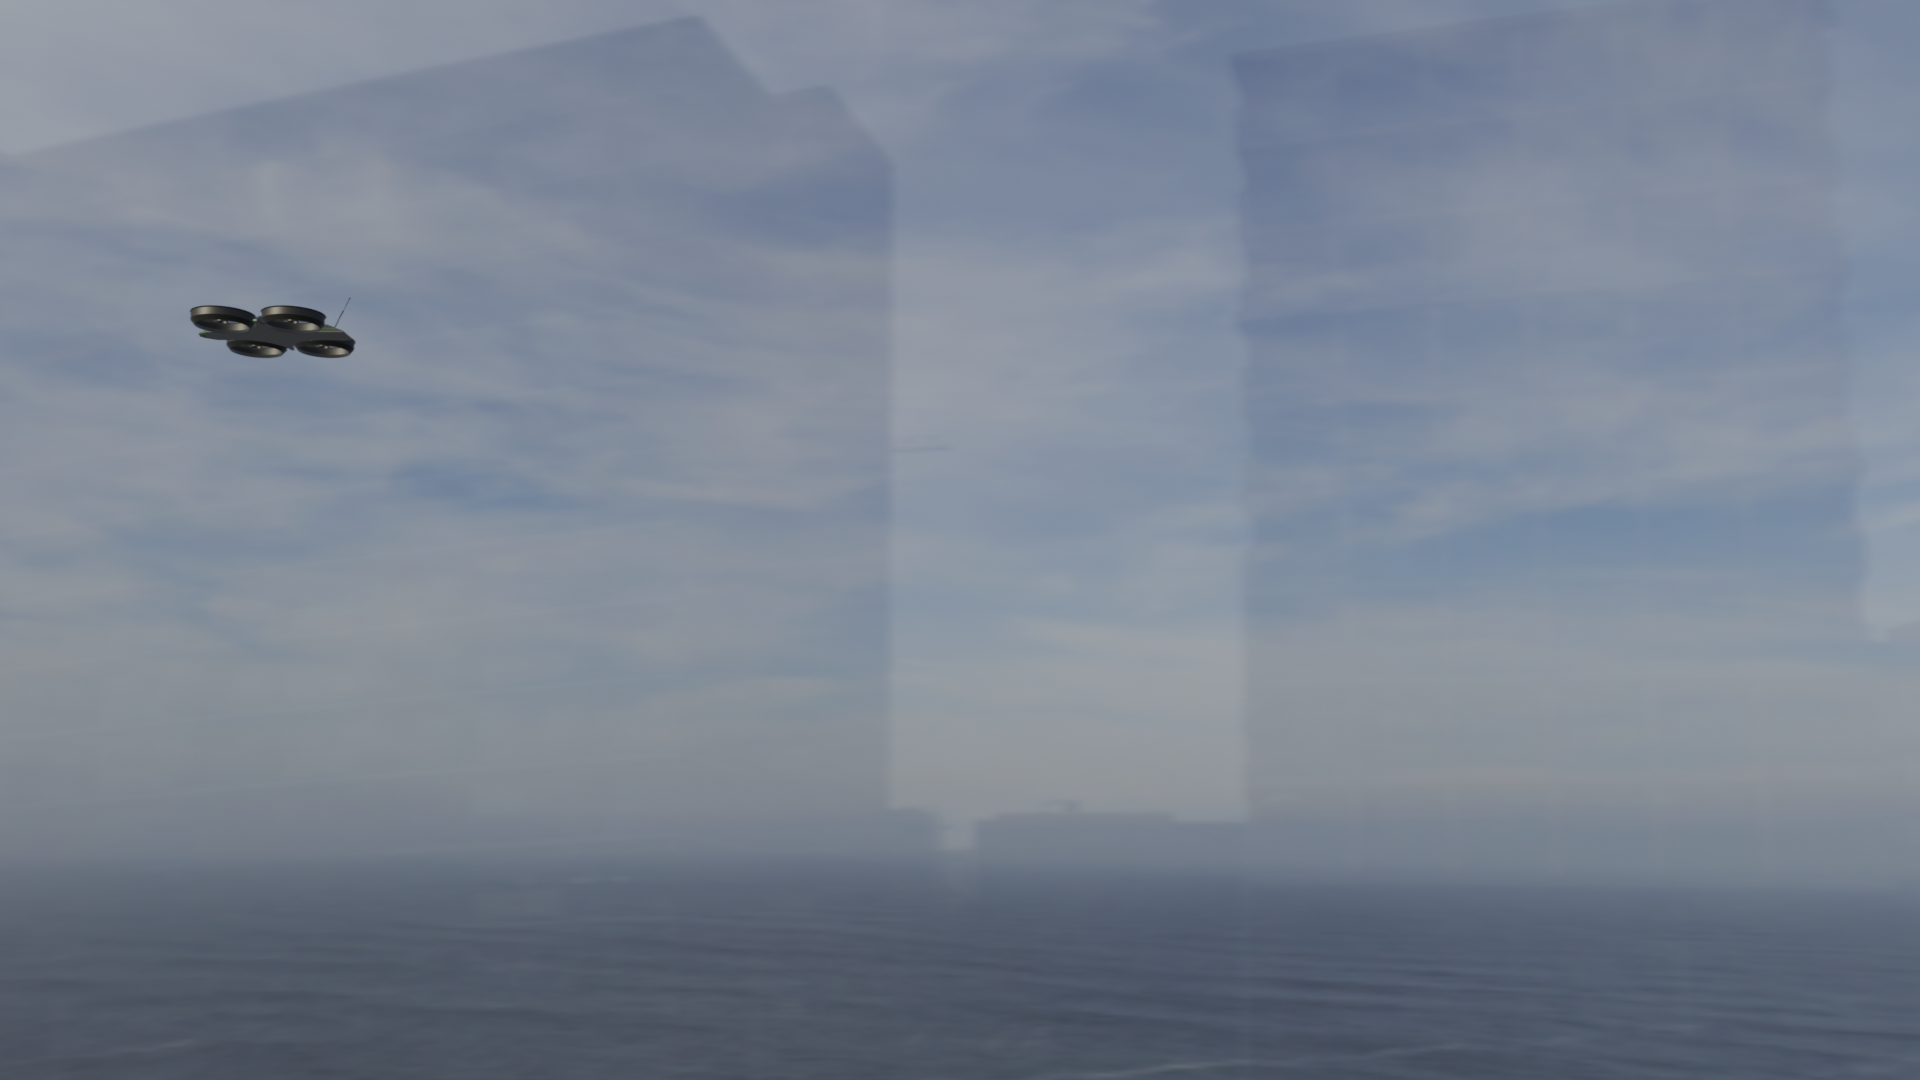
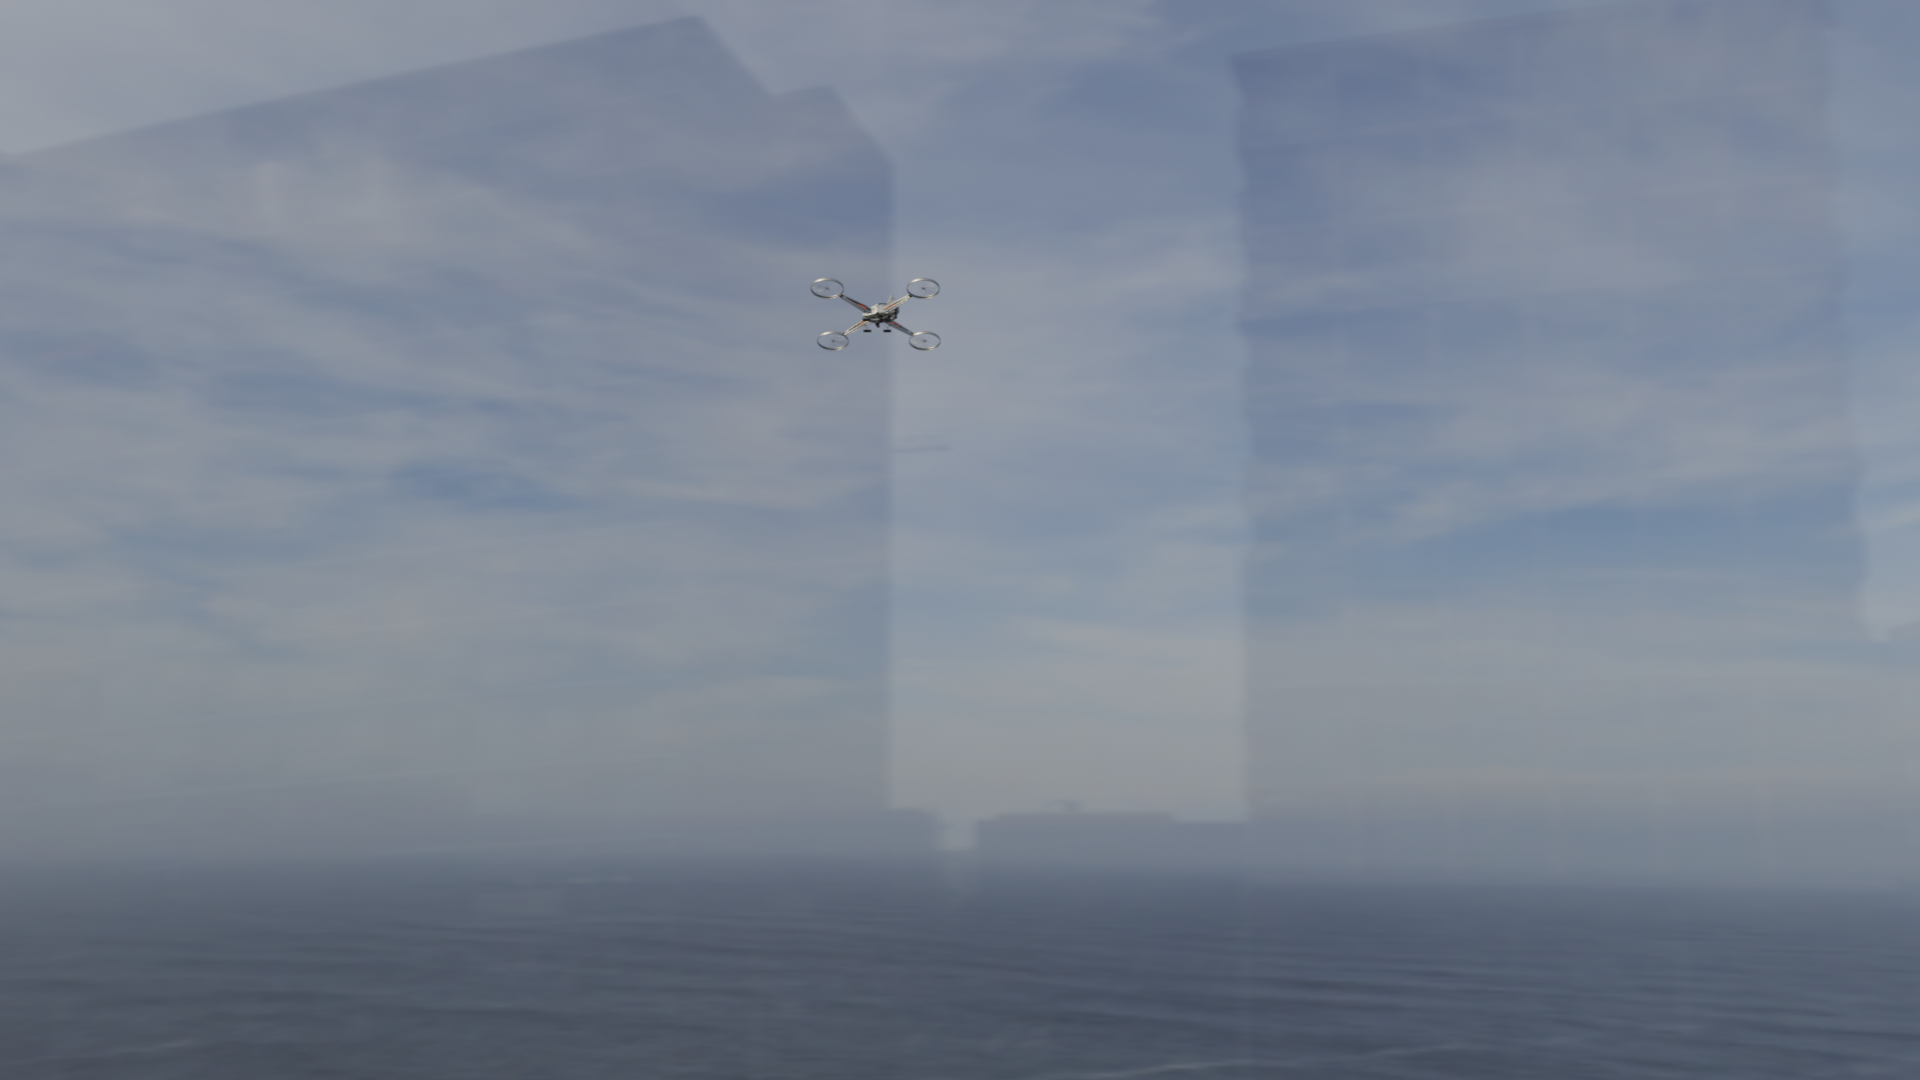
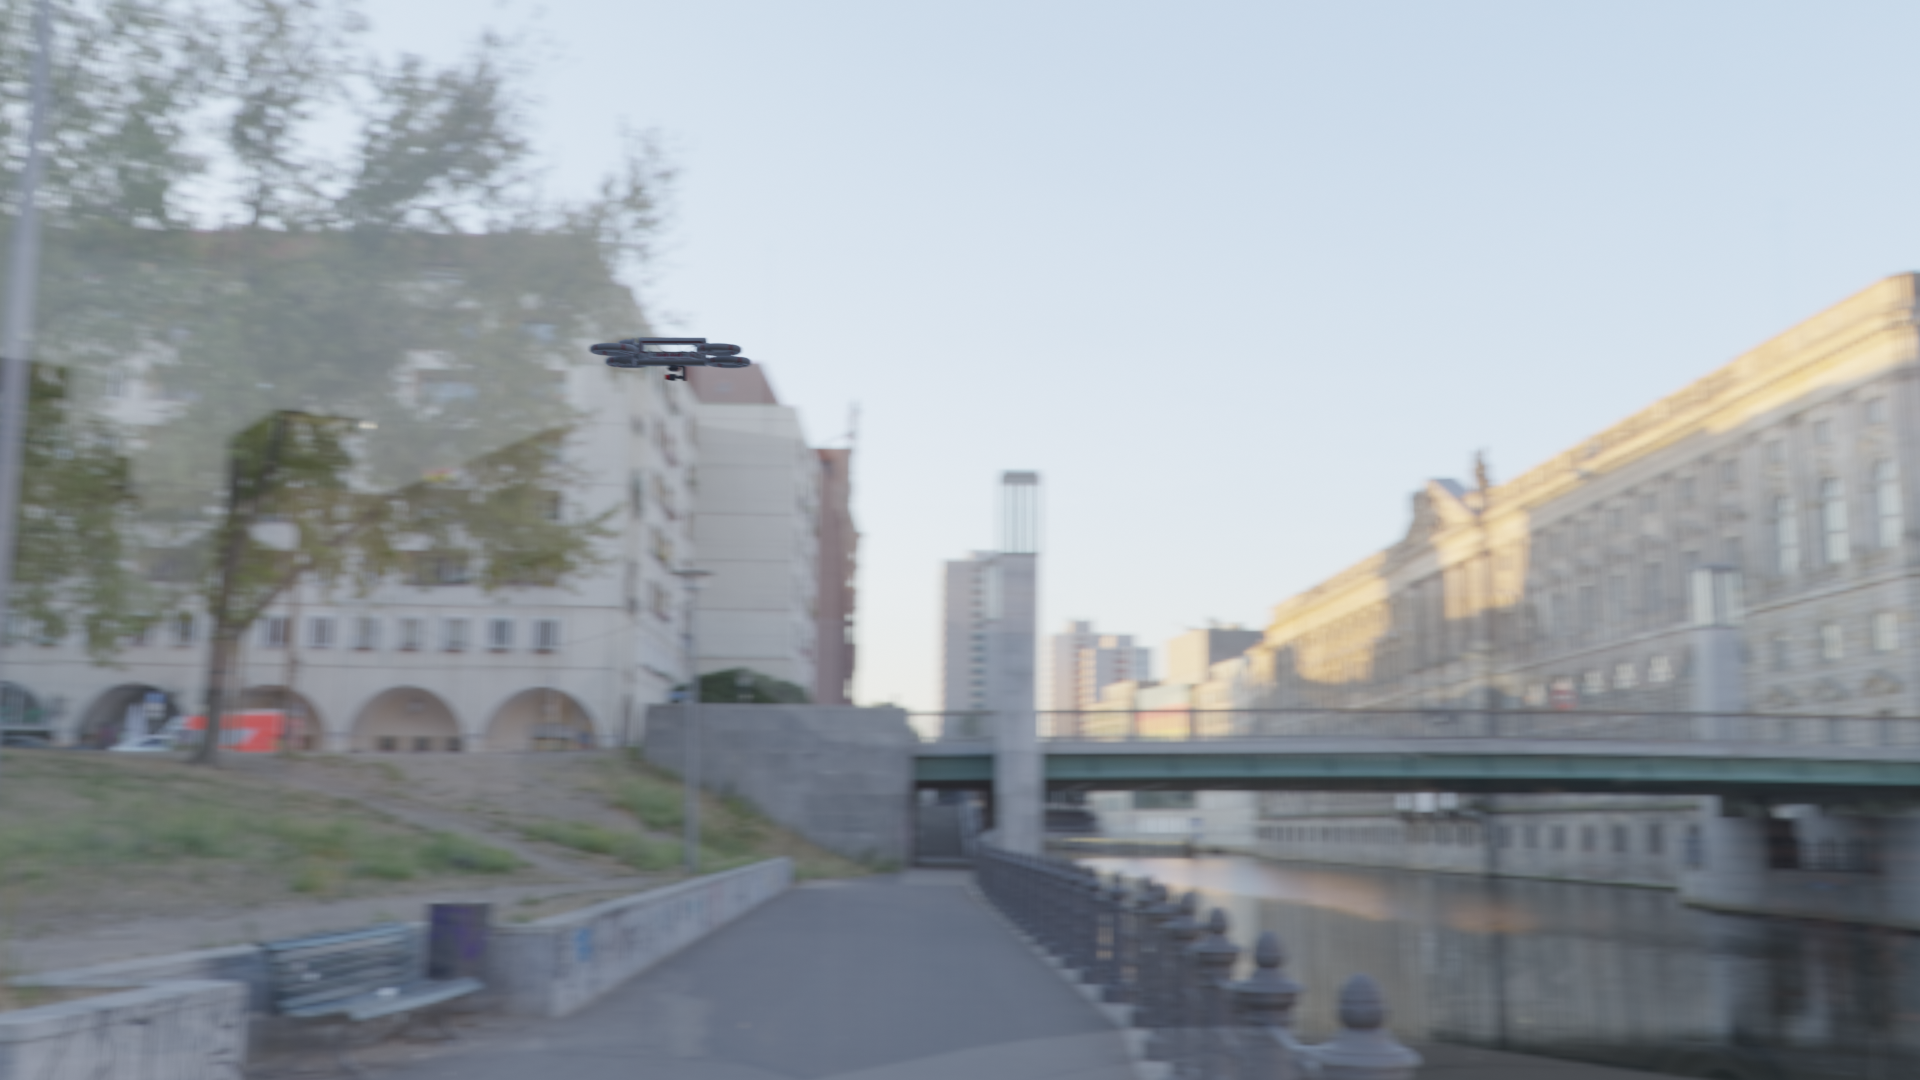
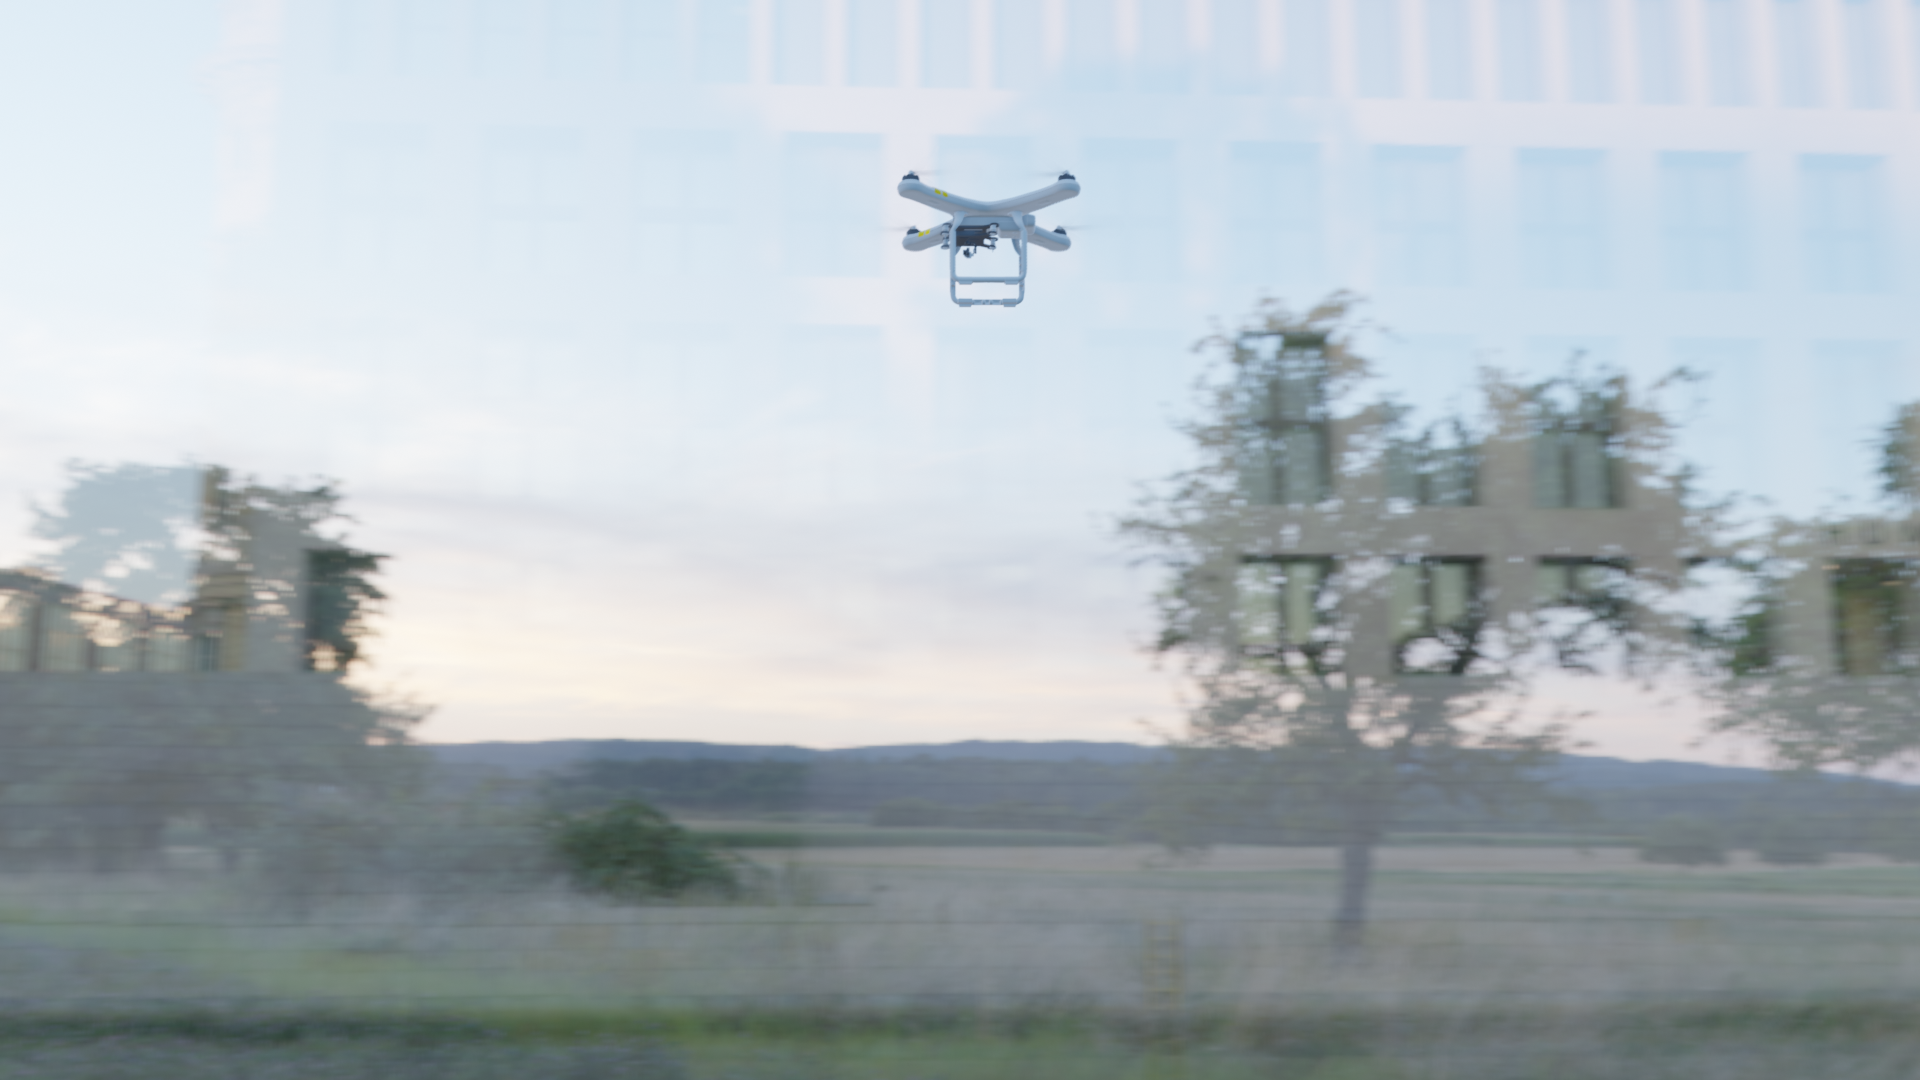
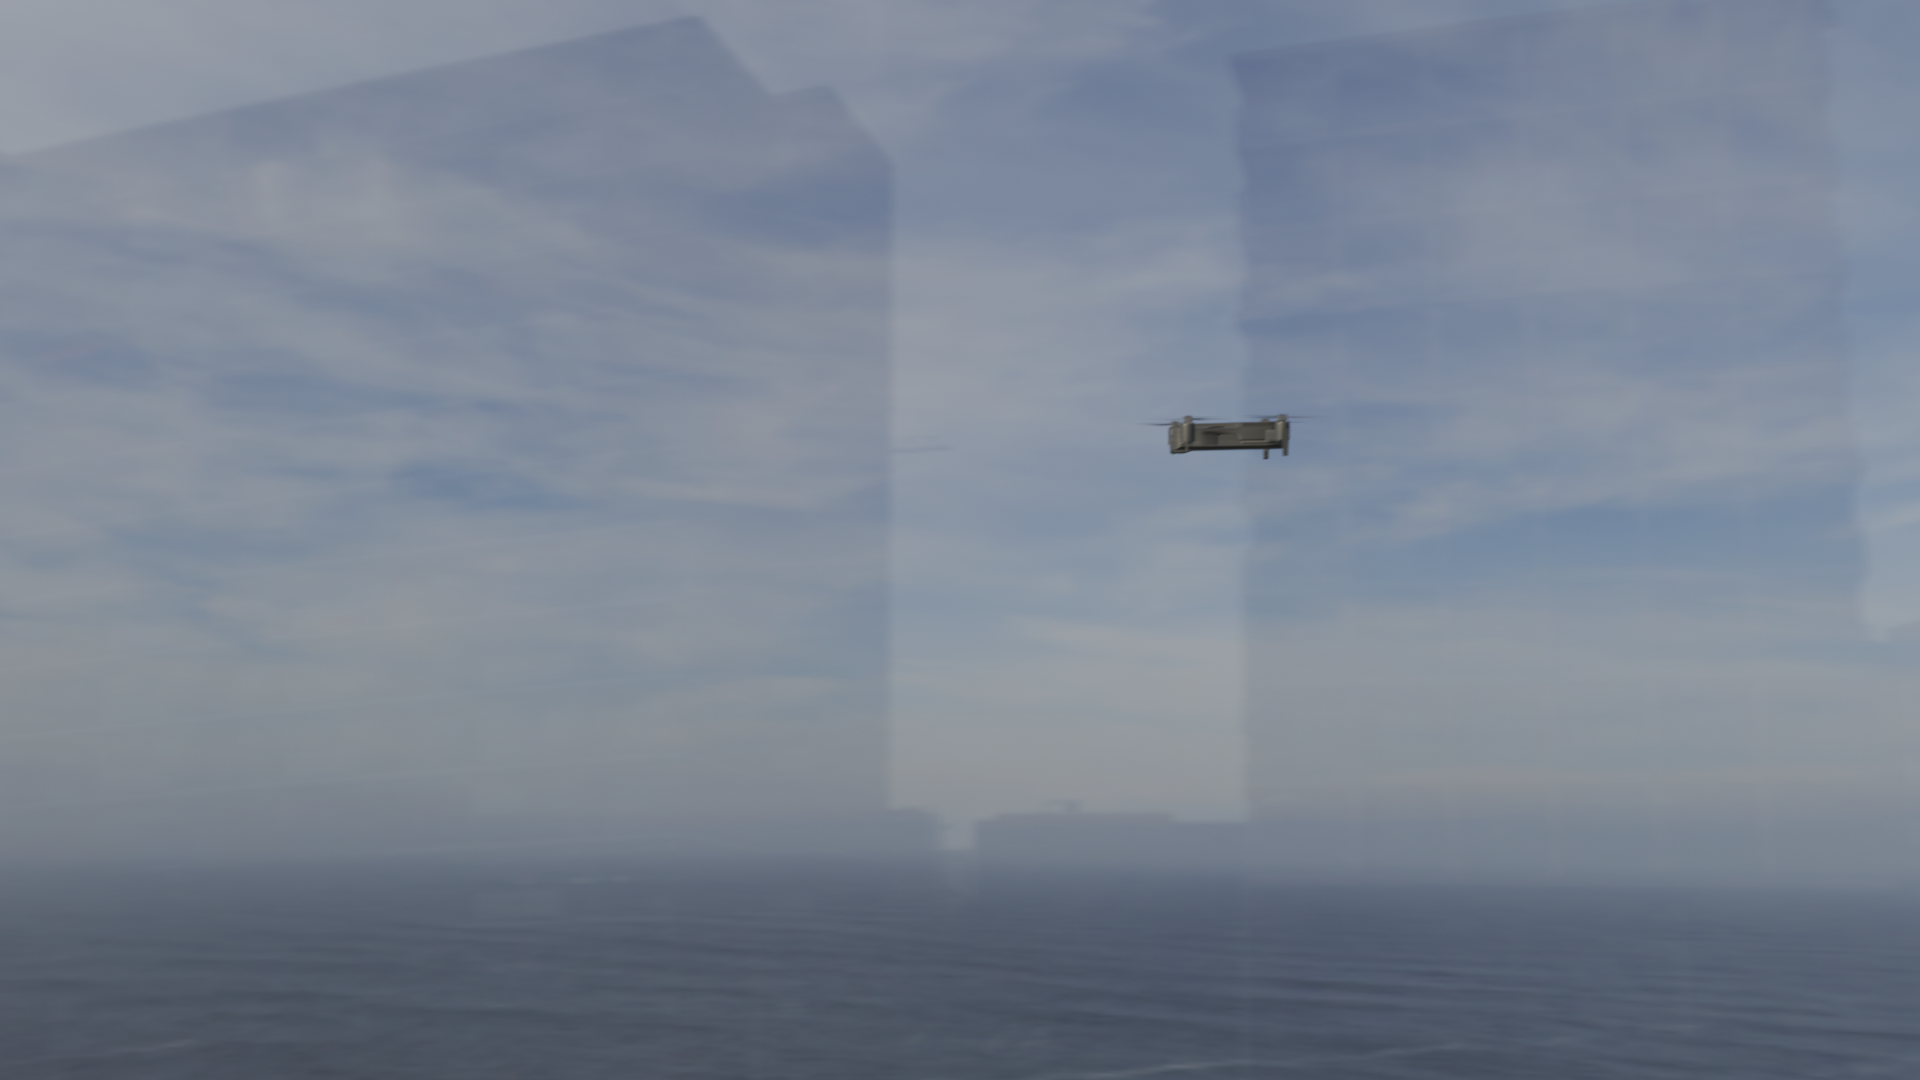
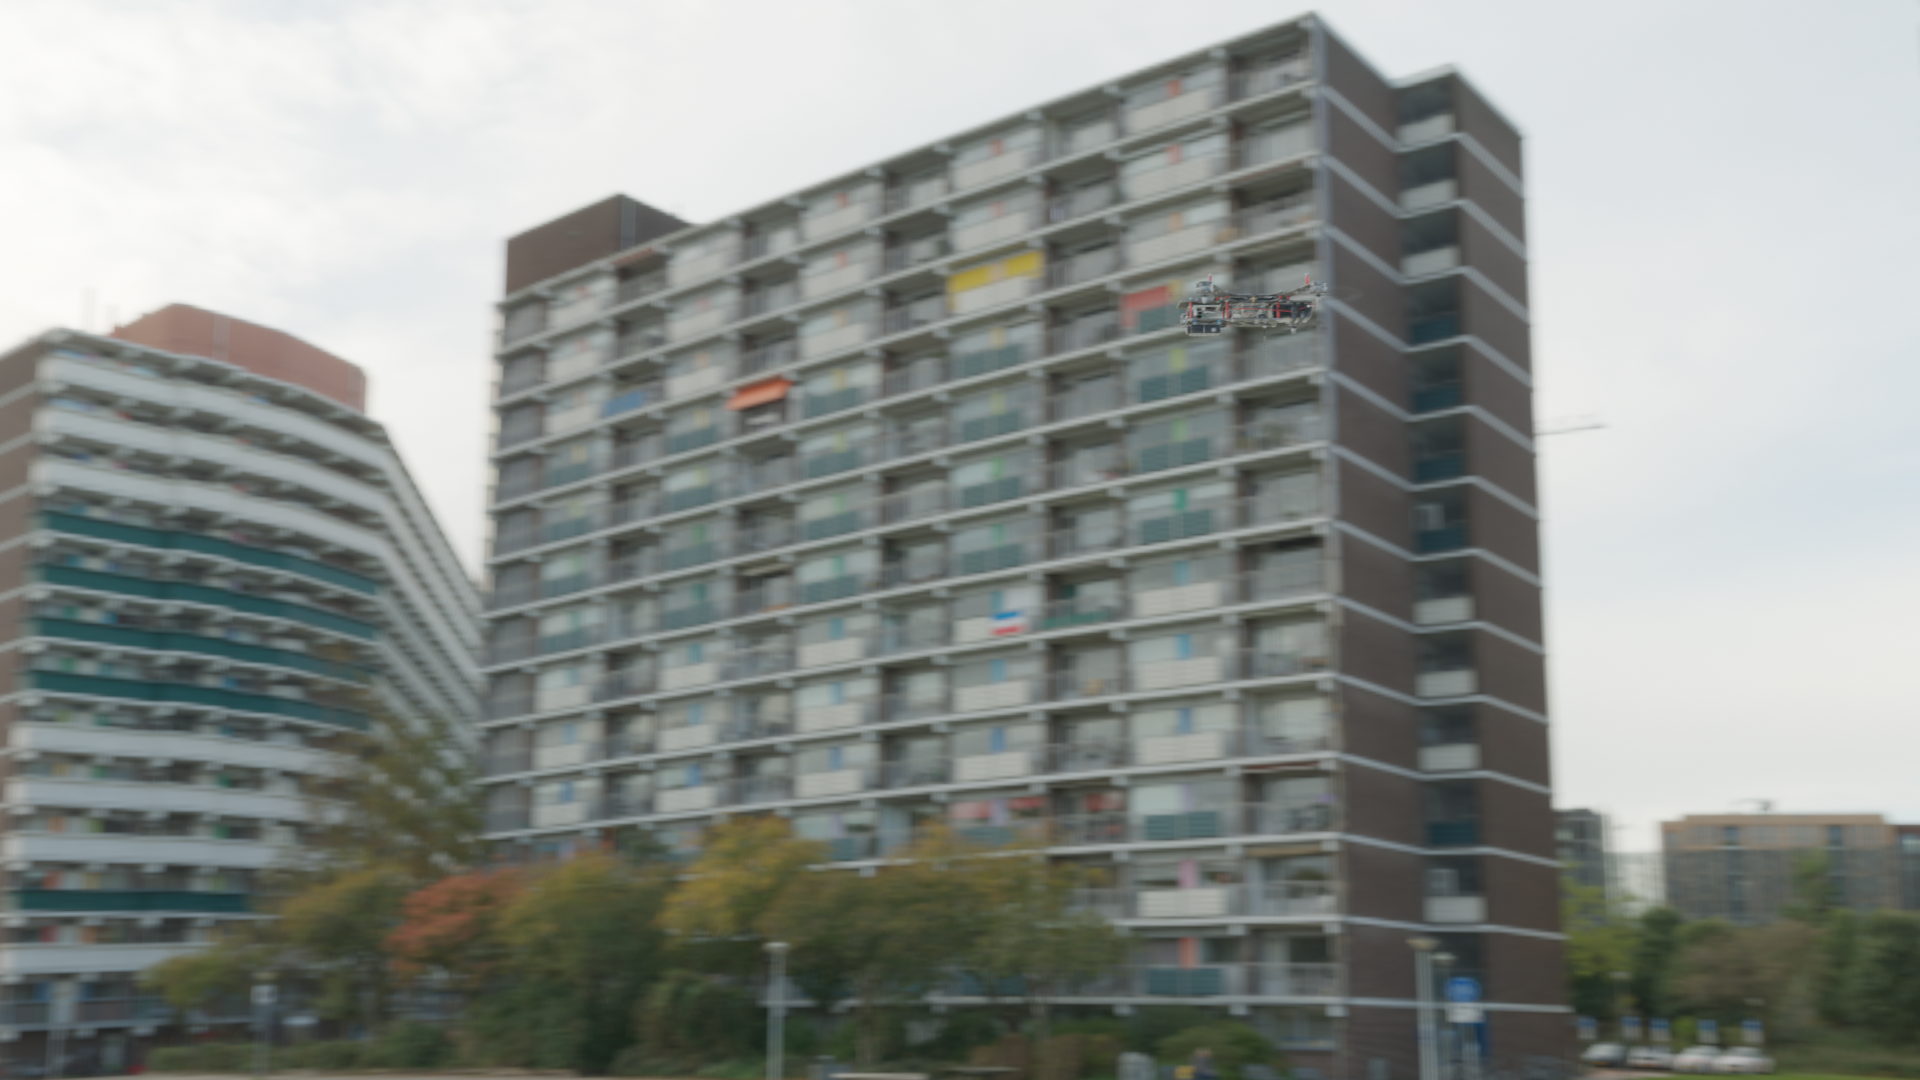
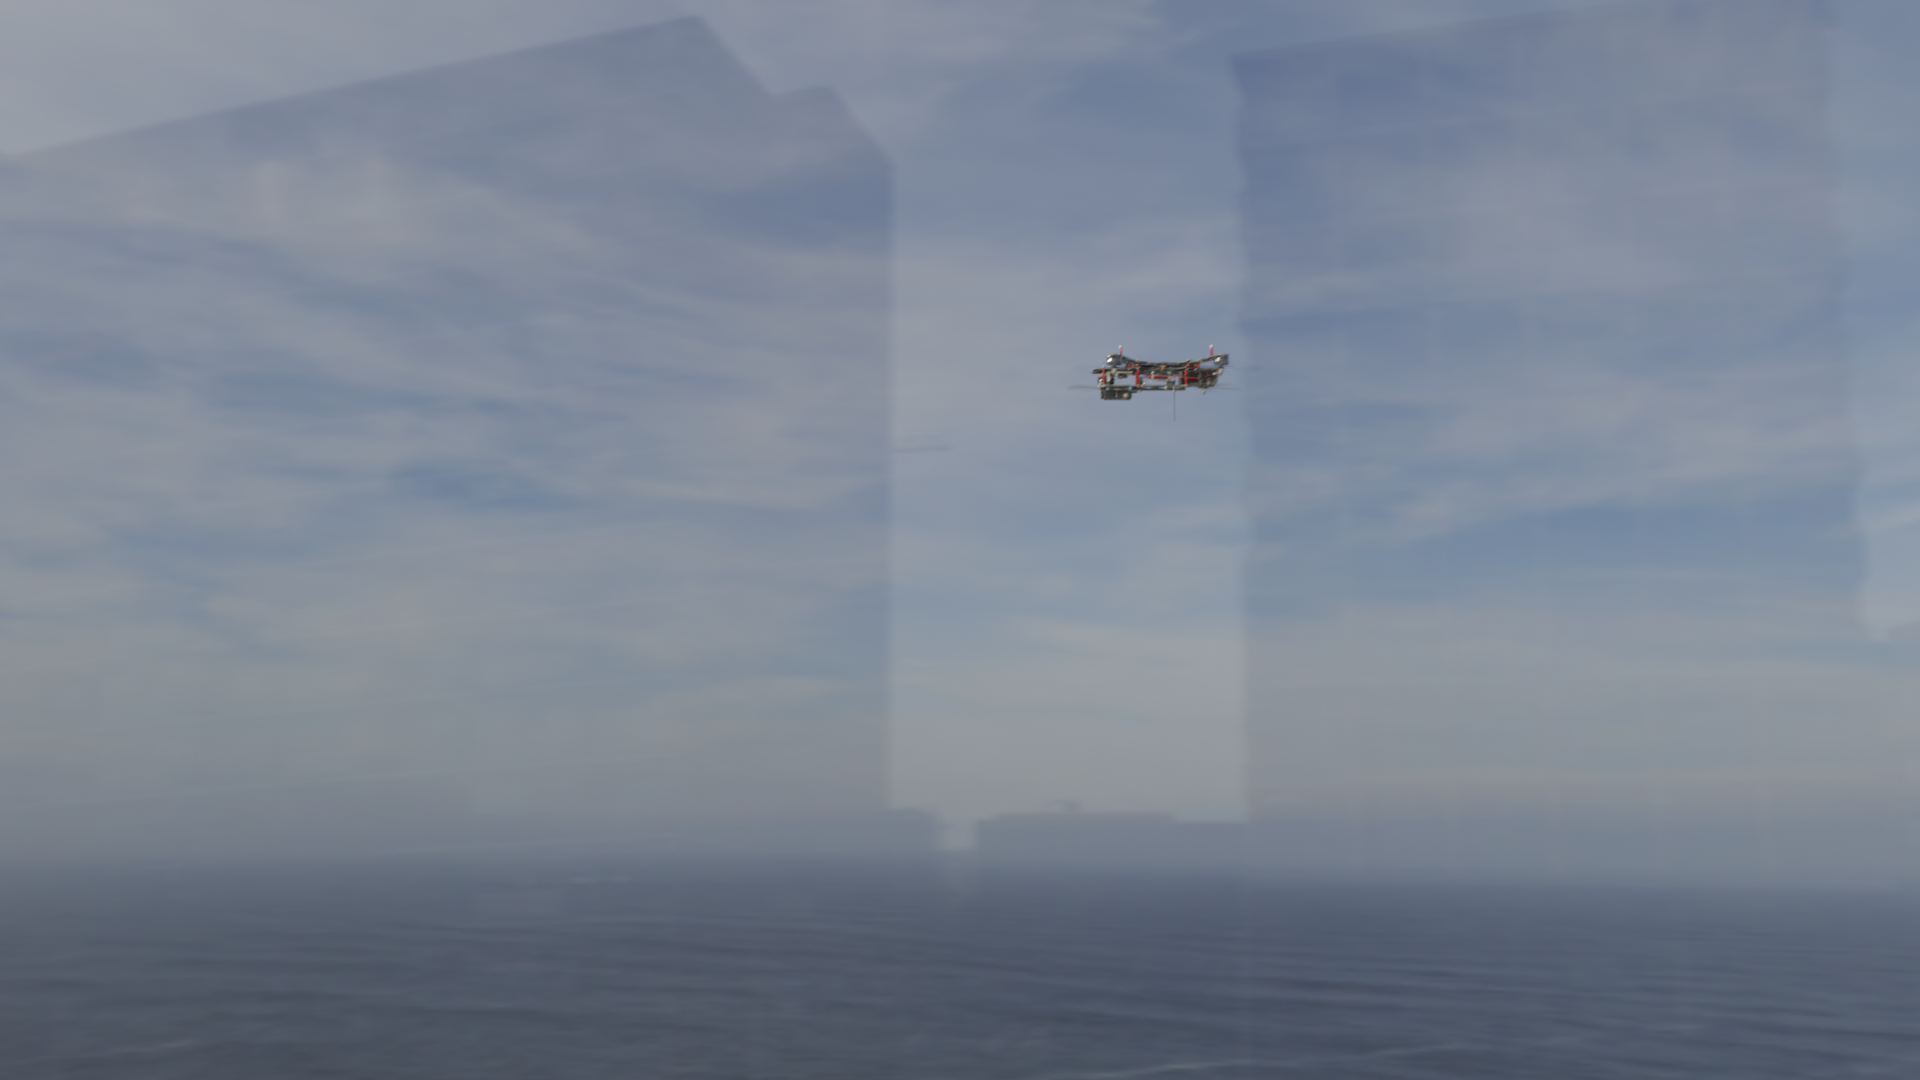
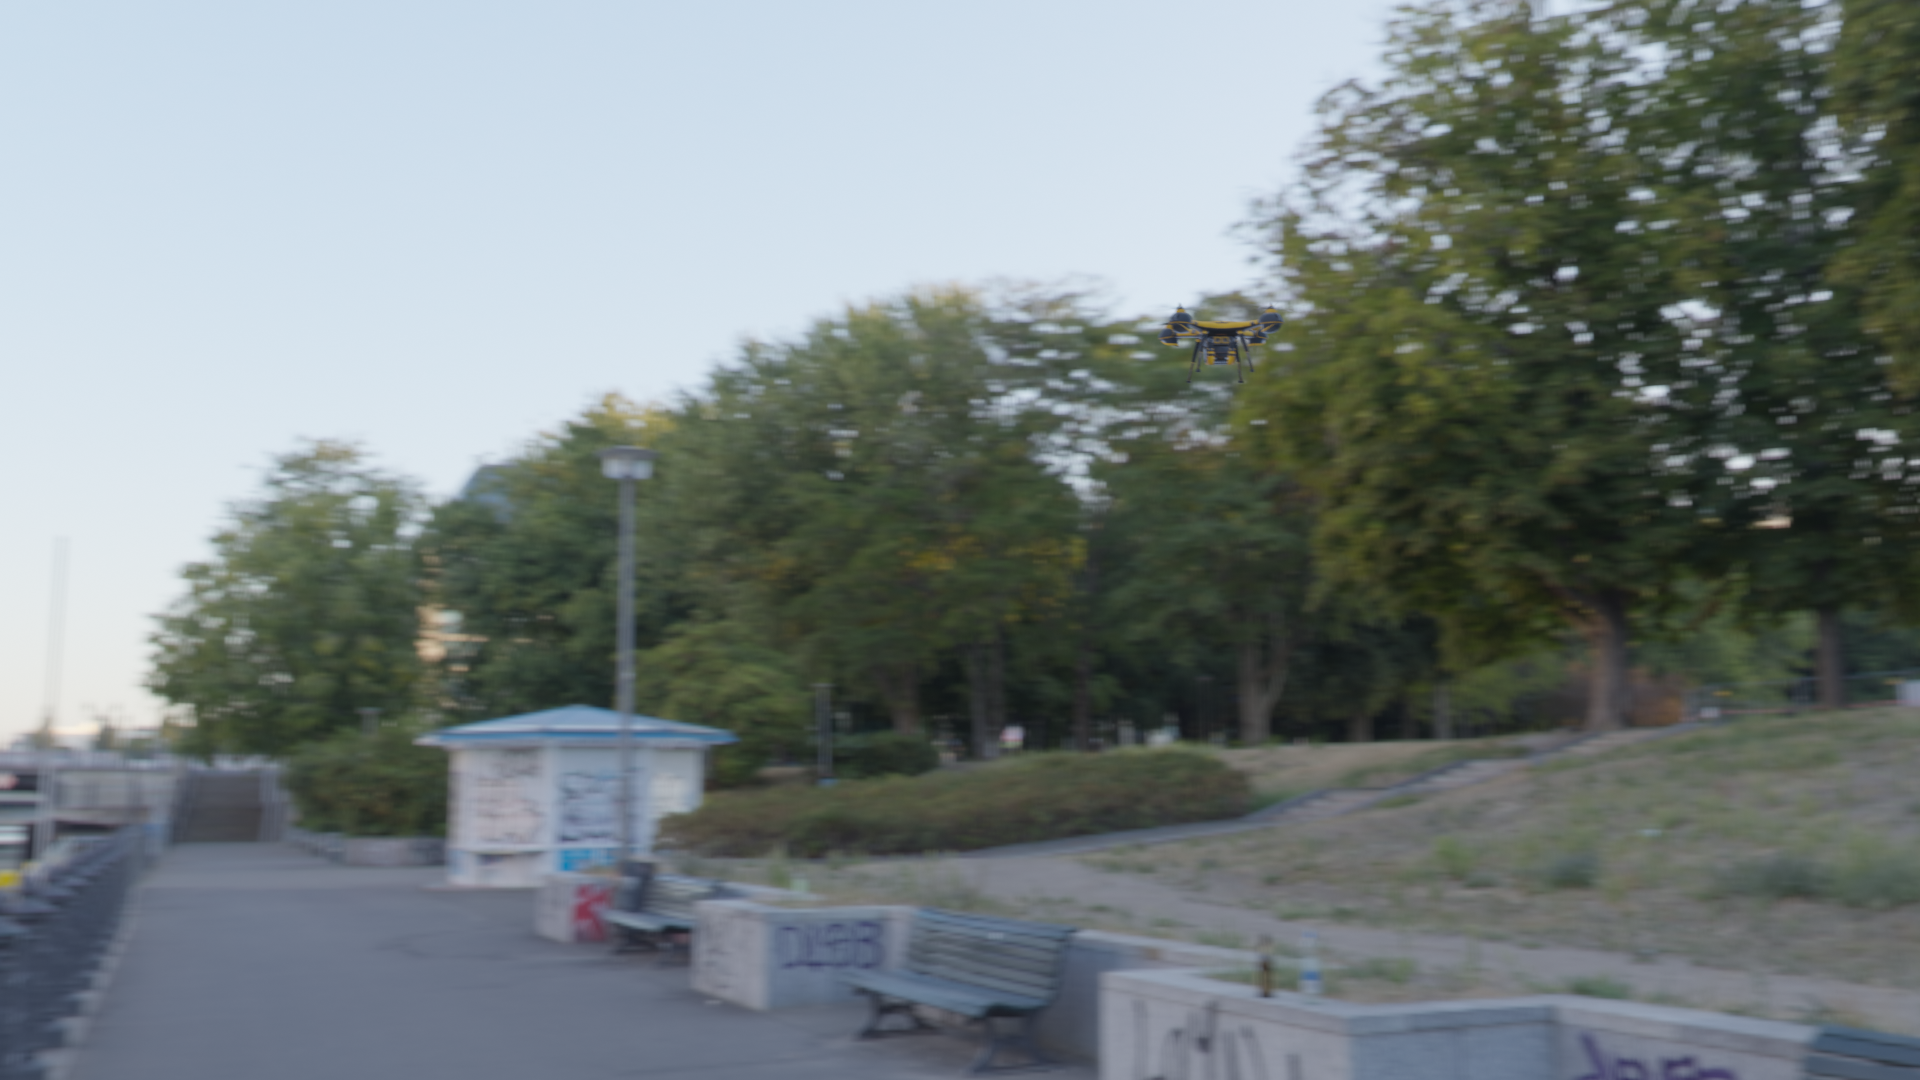
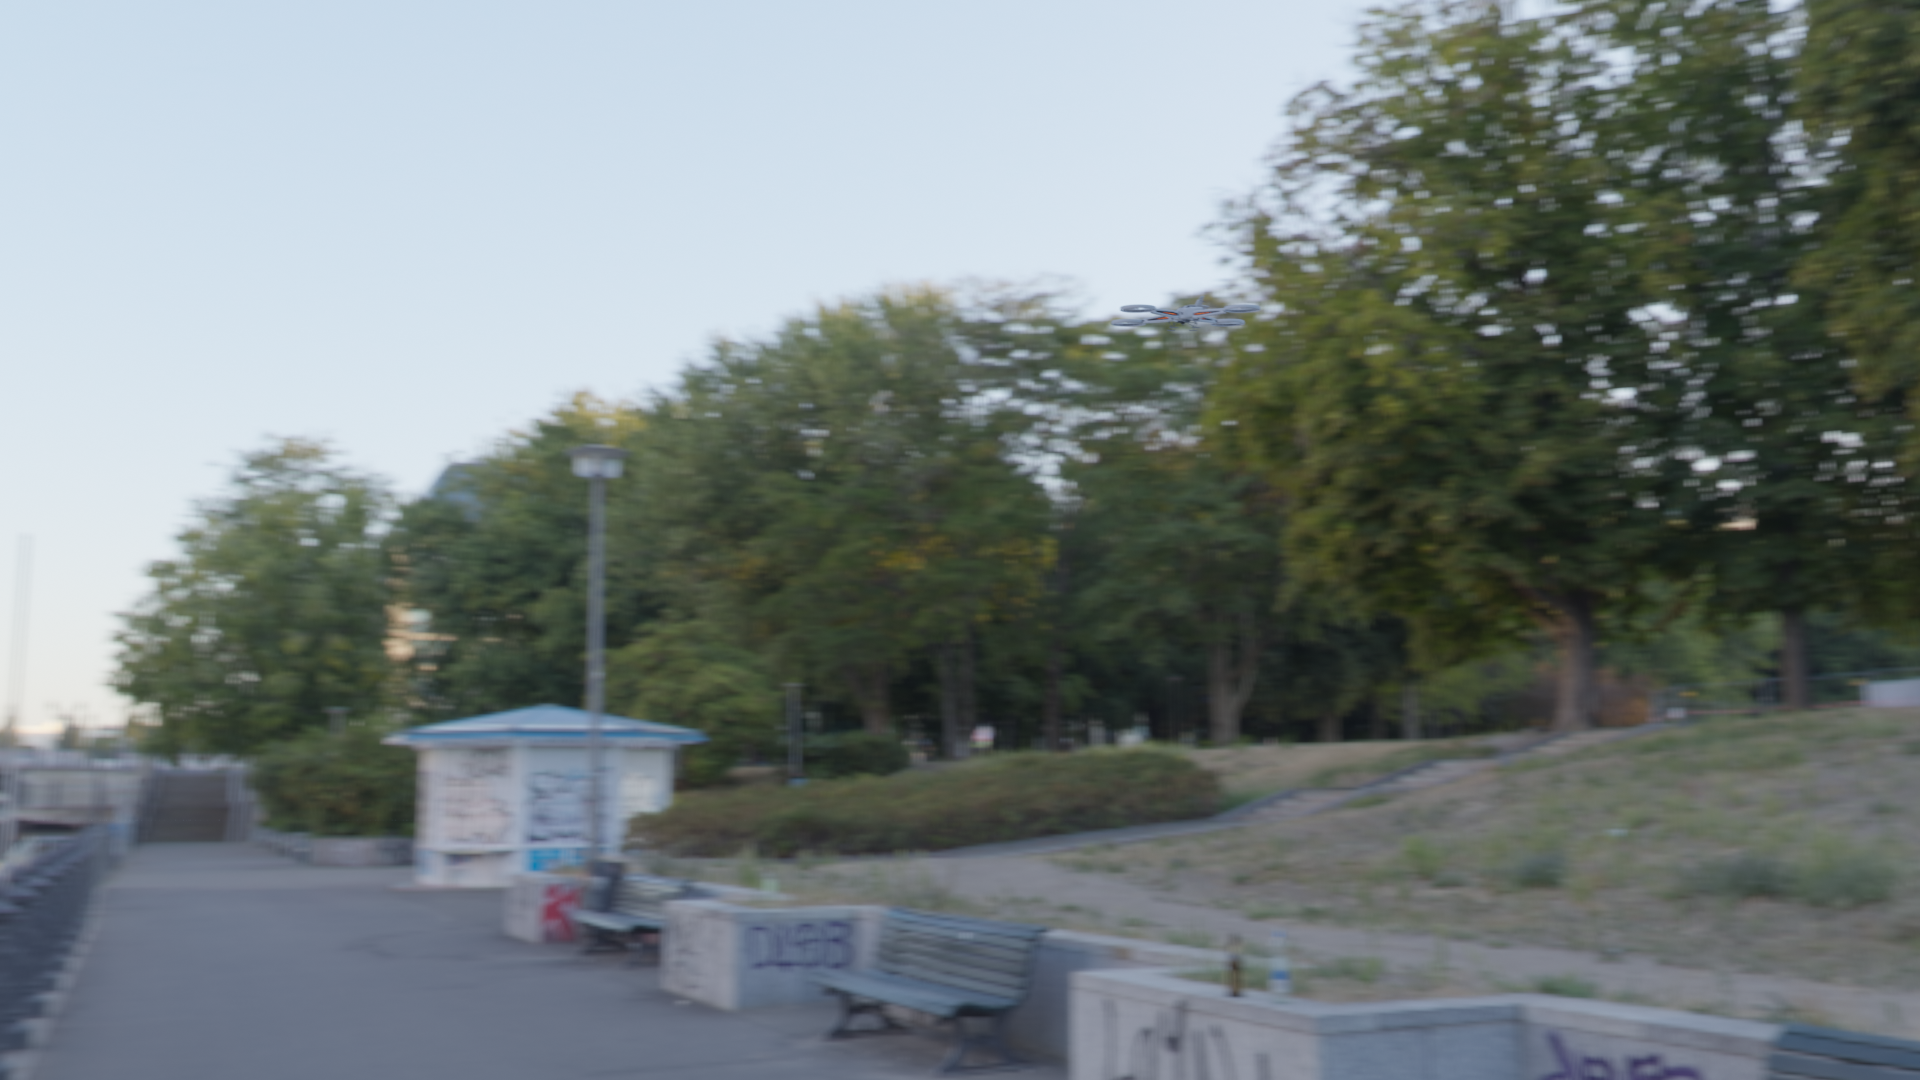
12-Class Drone Gallery
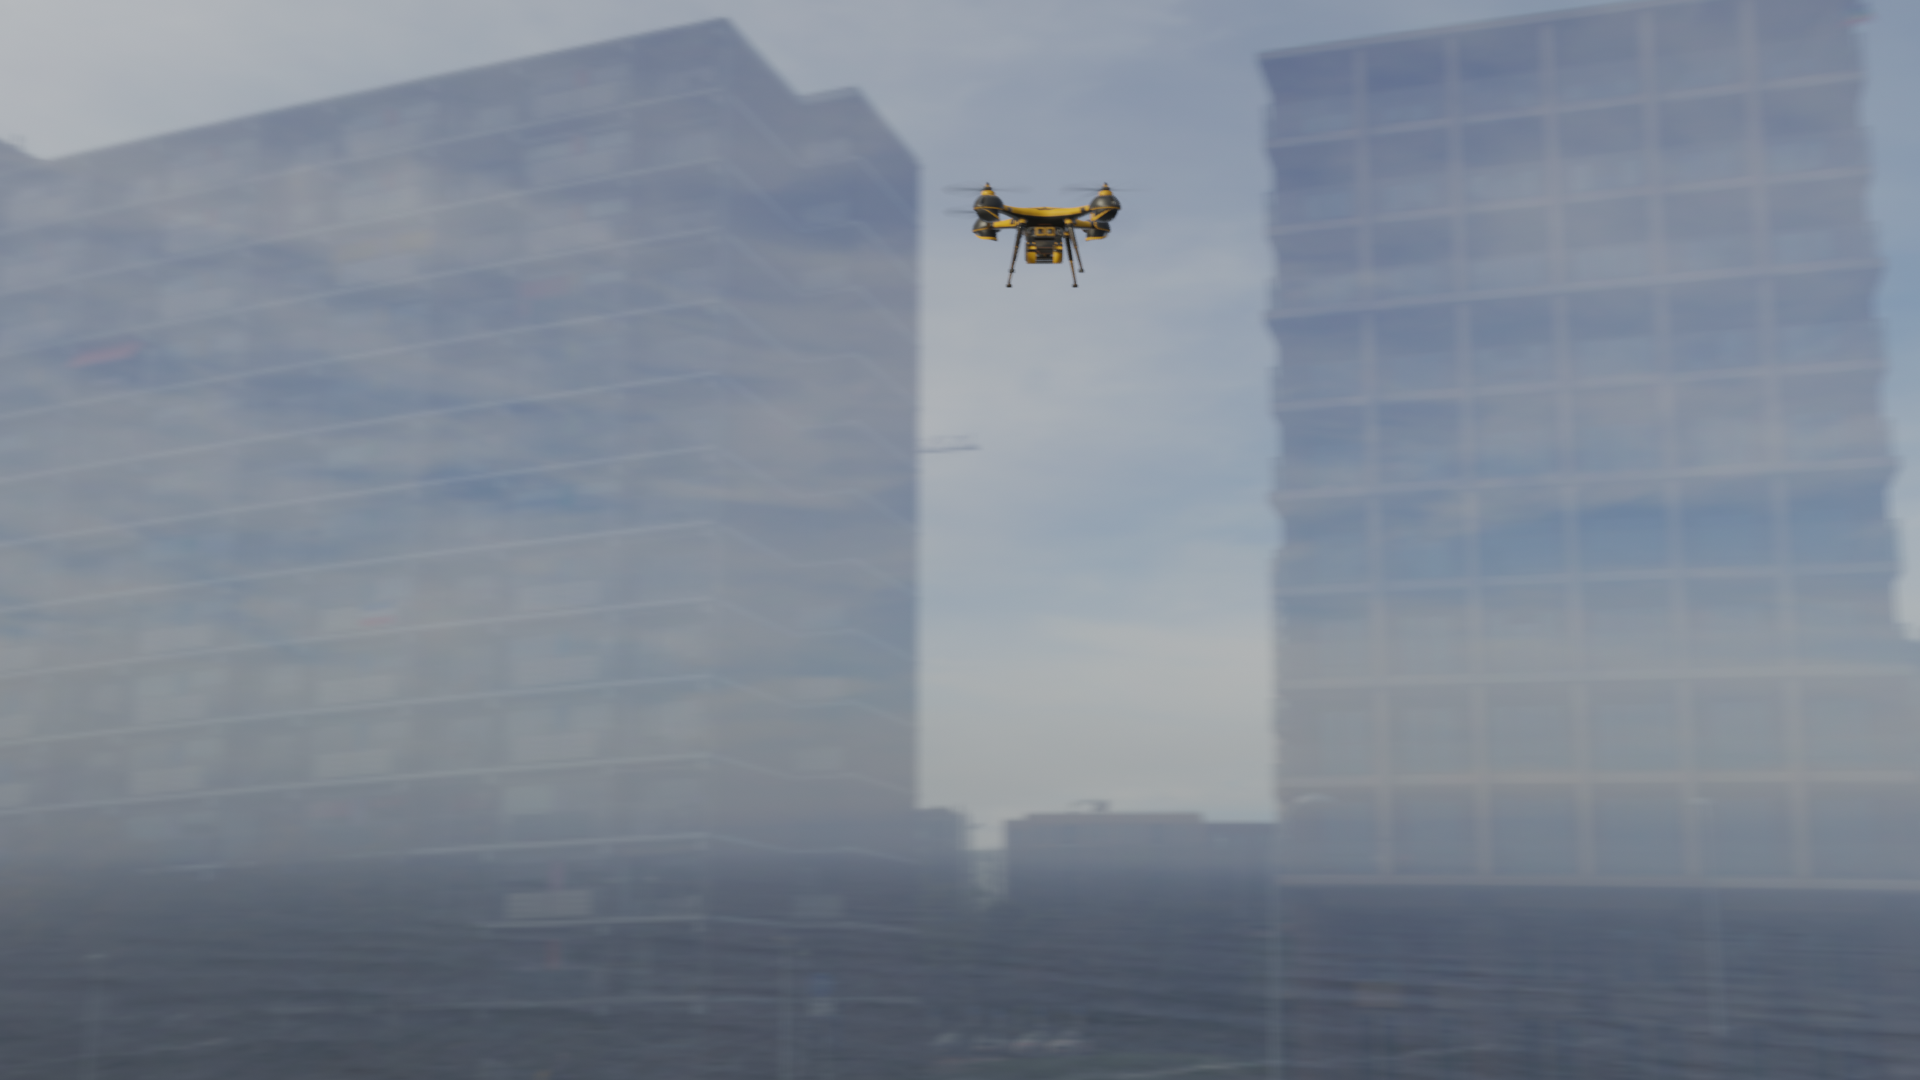
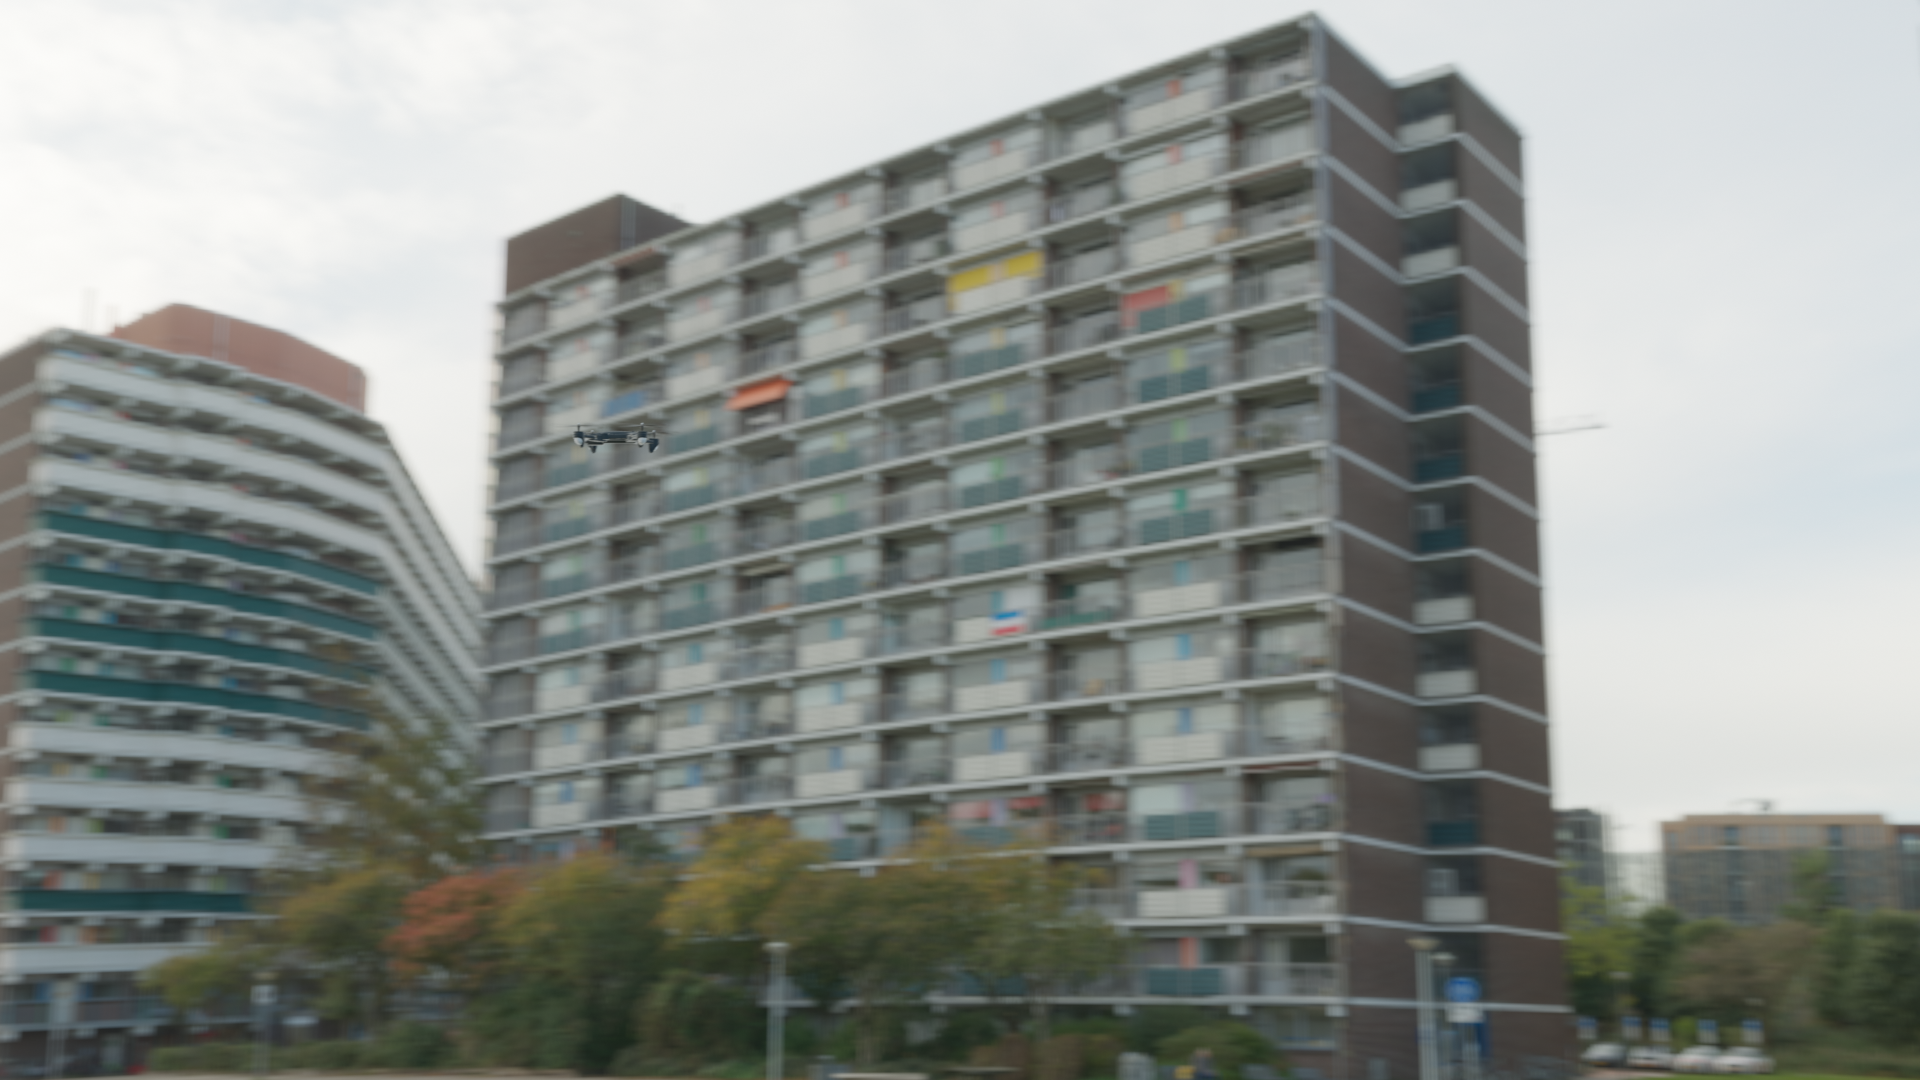
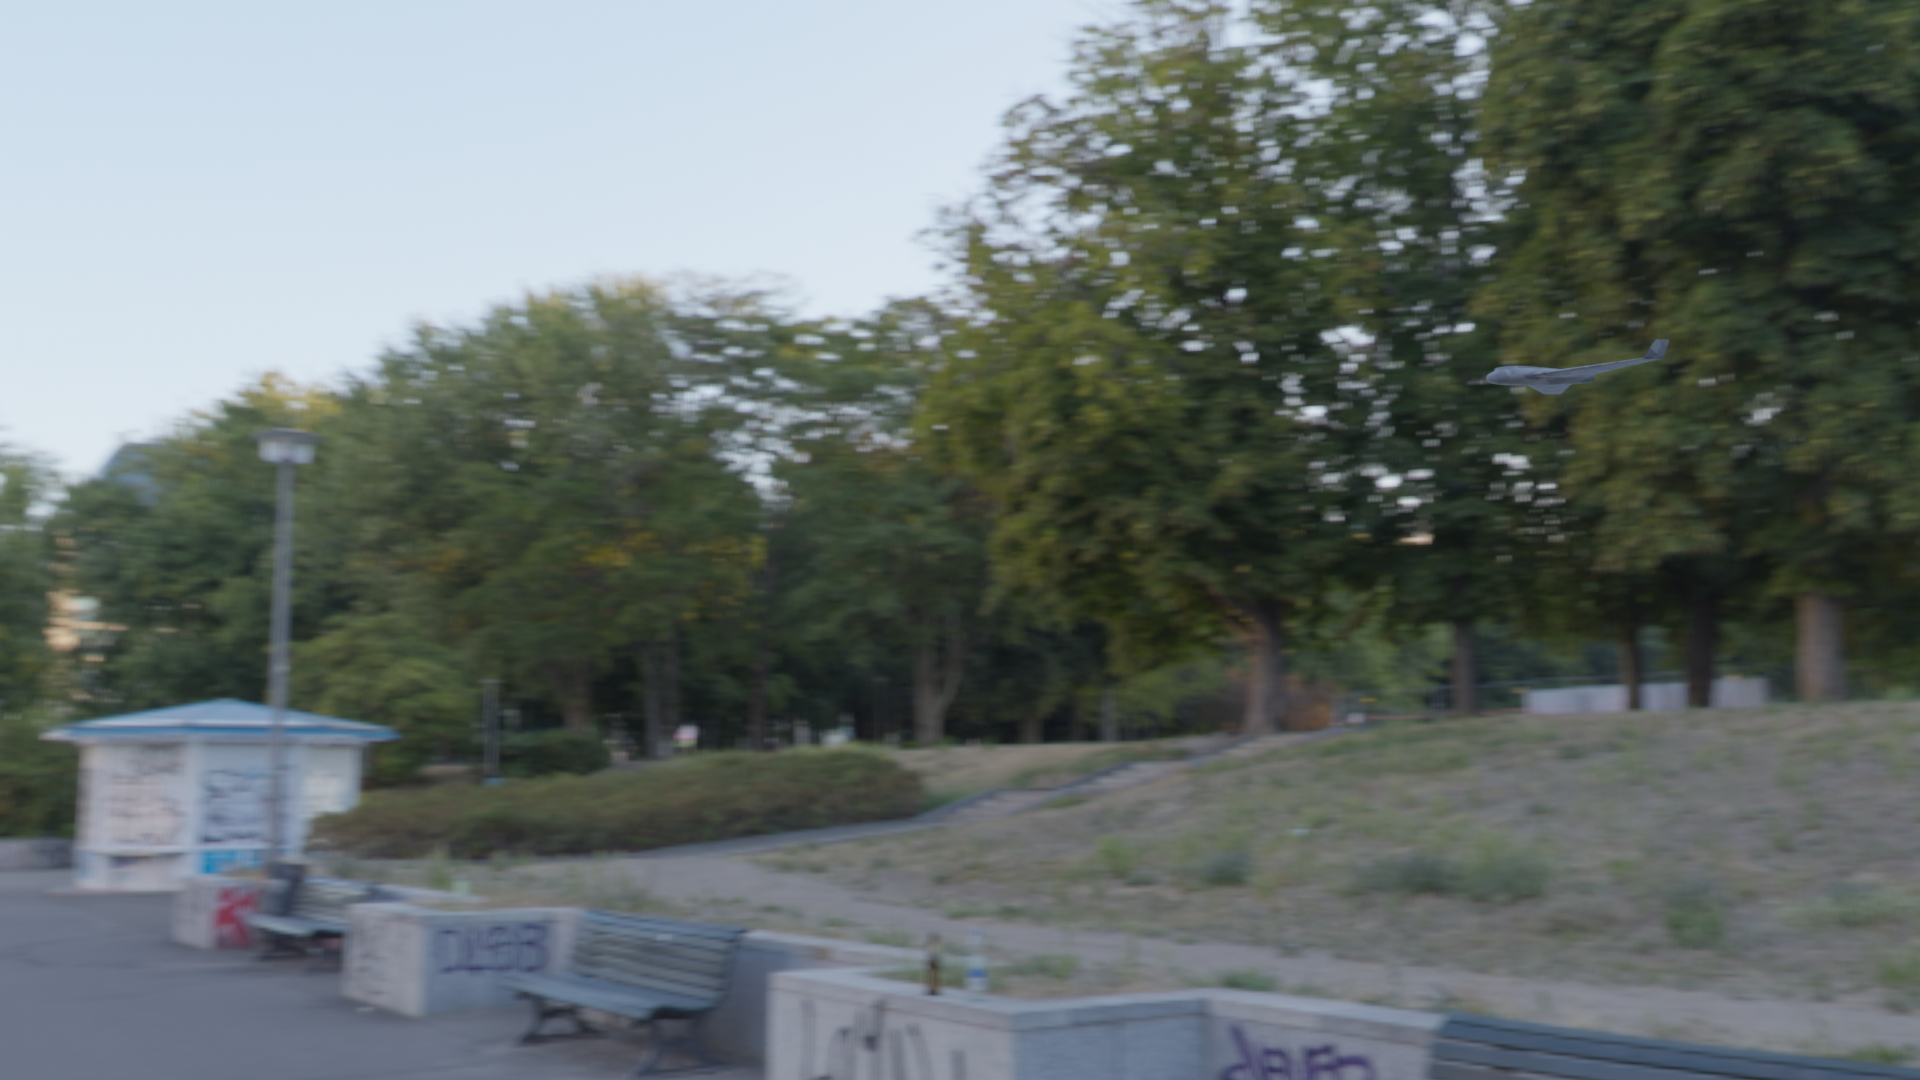
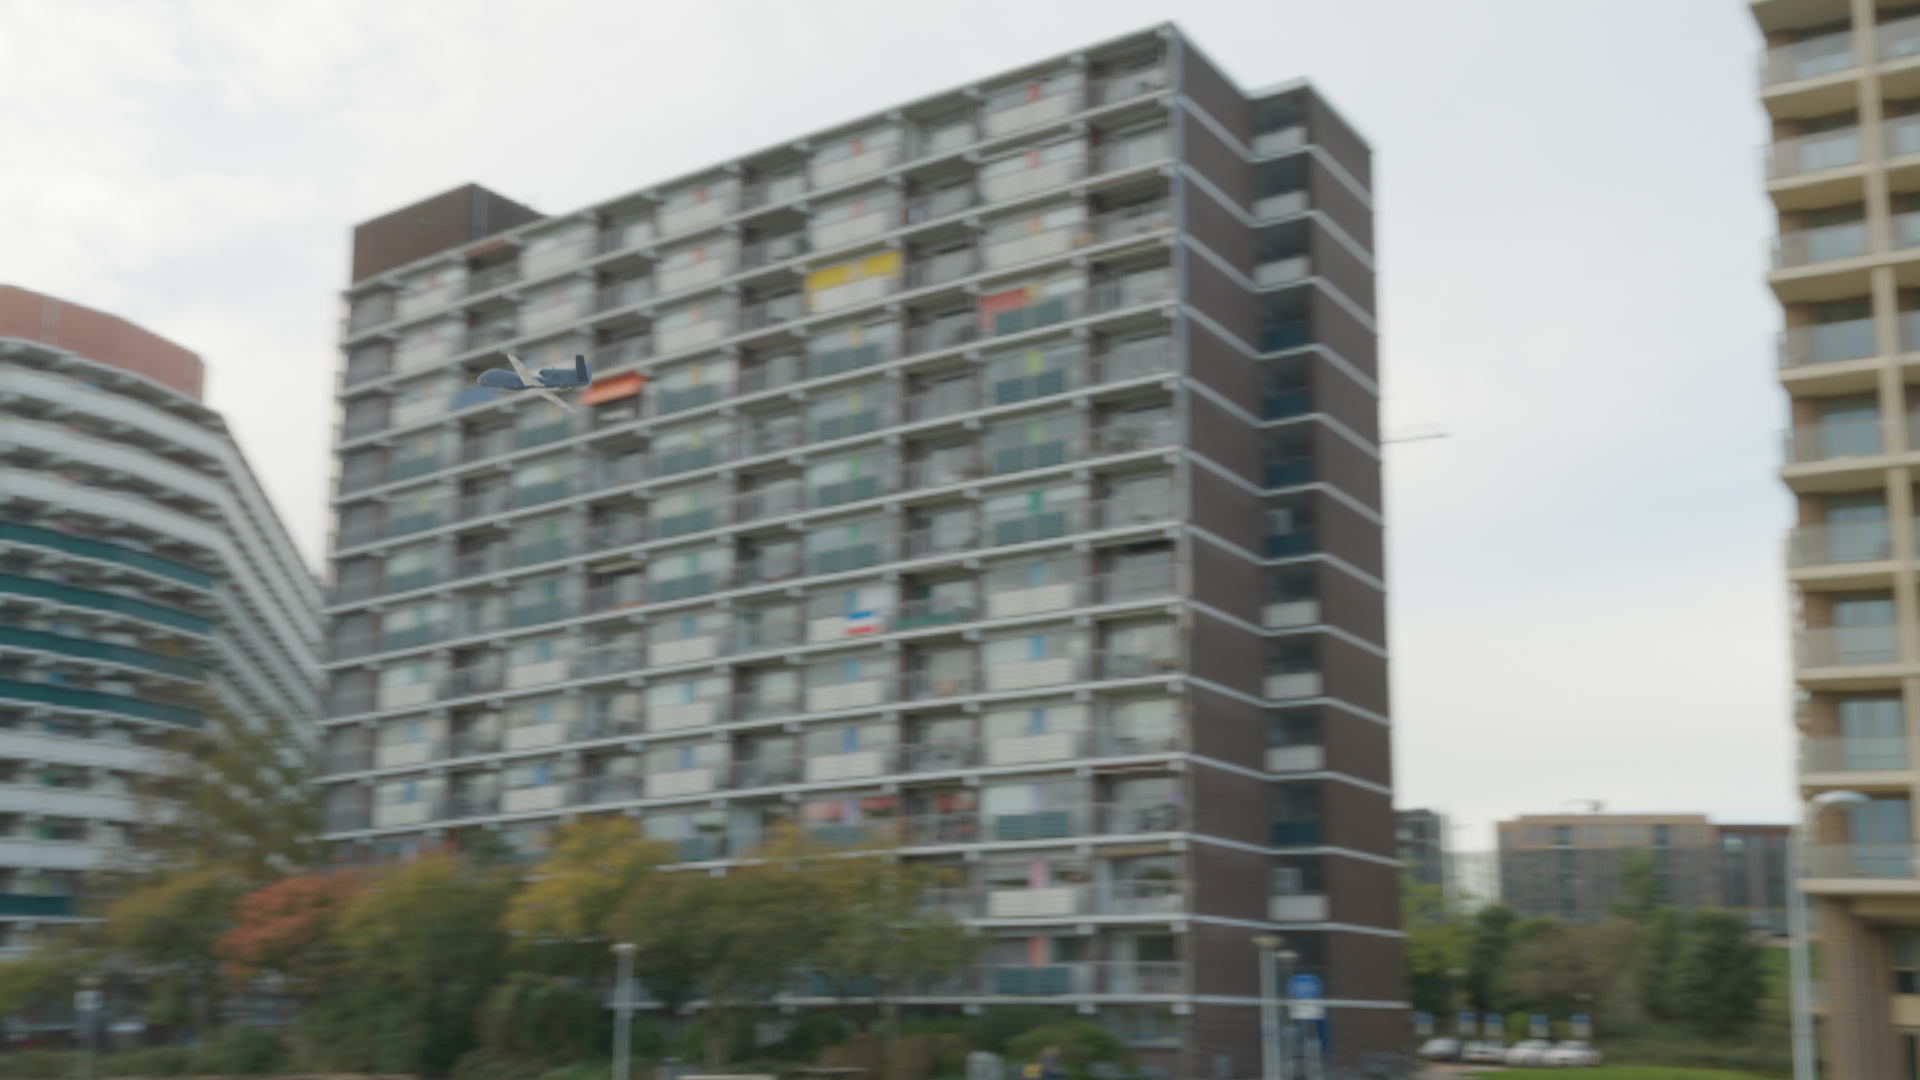
From DR01 through DR12, each class represents a drone with a distinct form factor, size, and operational role. Small reconnaissance multicopters, loitering munitions, and fixed-wing UAVs — together they span the full spectrum of drone threats encountered on the modern battlefield.
Each card shows two frames — canonical the most typical frame (high density) · outlier the most anomalous frame (low density)
 canonical
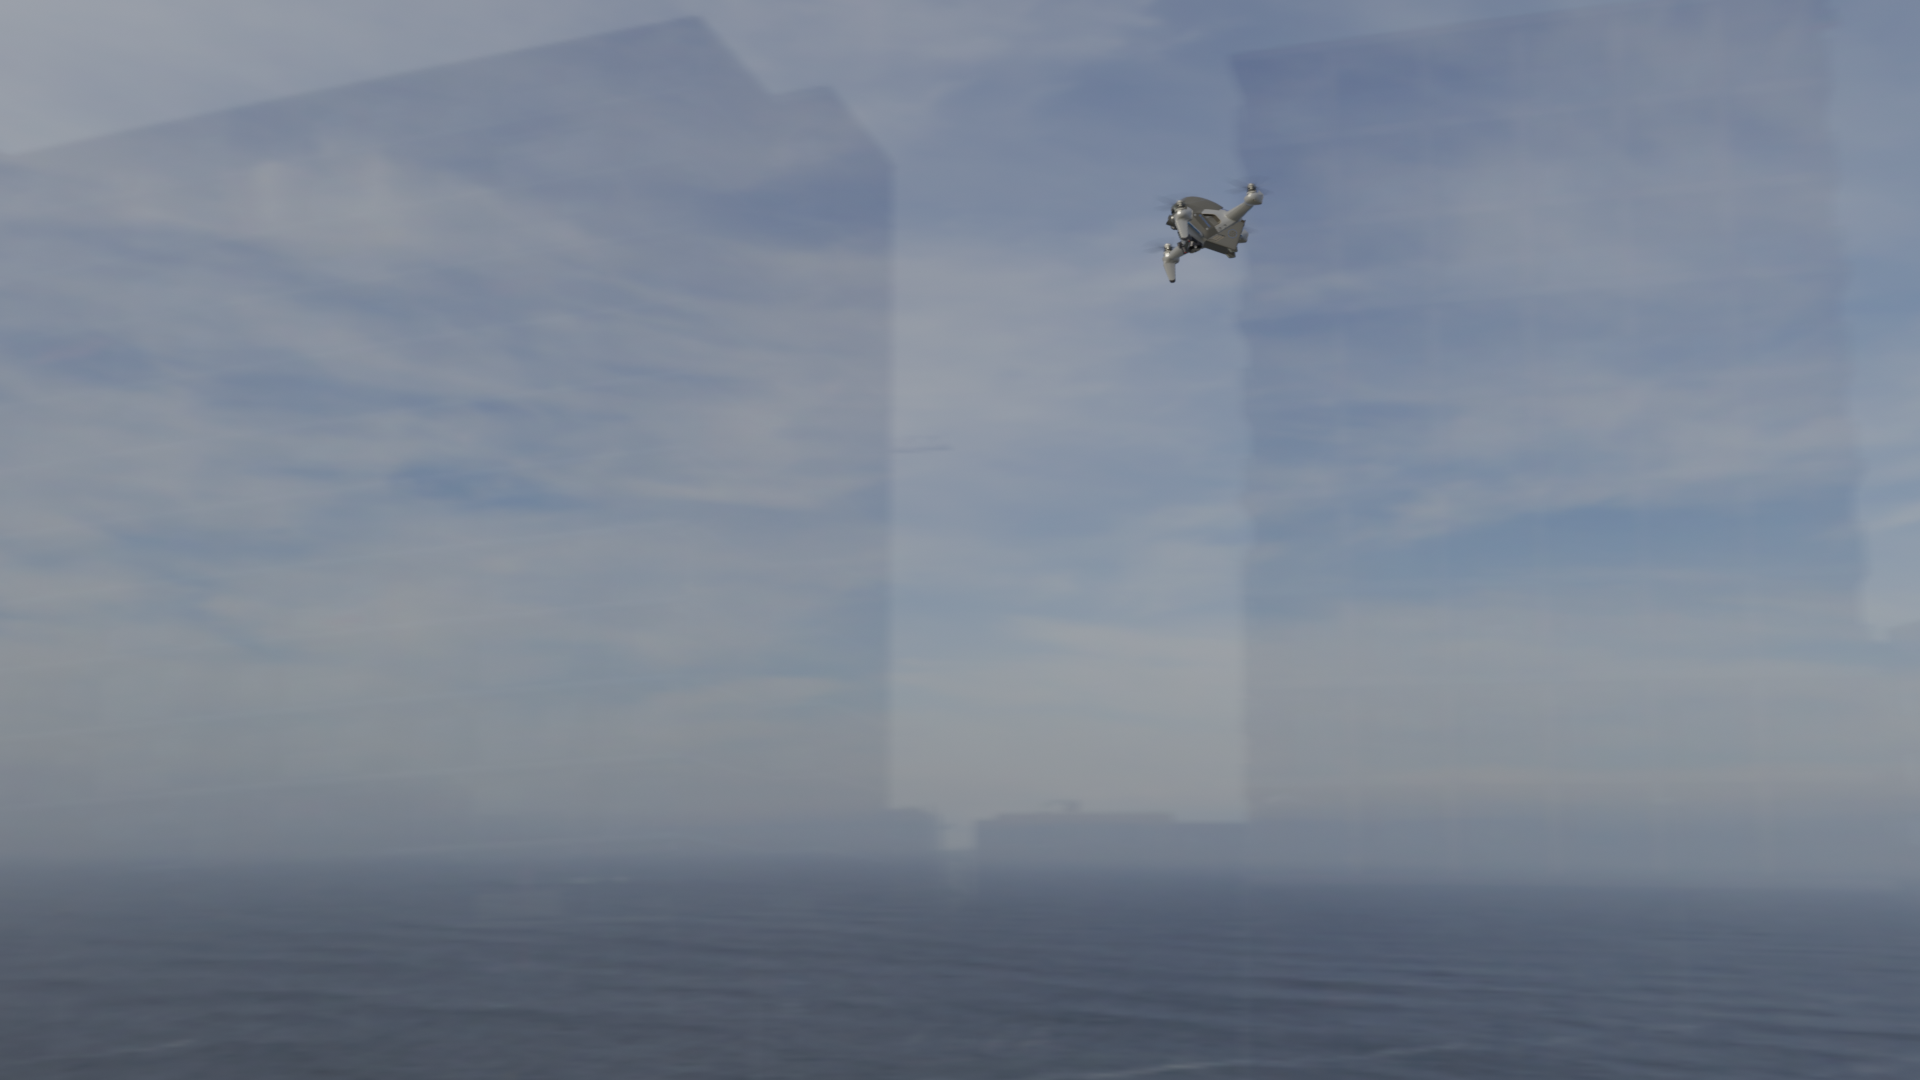 outlier
 canonical
 outlier
 canonical
 outlier
 canonical
 outlier
 canonical
 outlier
 canonical
 outlier
 canonical
 outlier
 canonical
 outlier
 canonical
 outlier
 canonical
 outlier
 canonical
 outlier
 canonical
 outlier
Intentional design of perfect balance: Exactly 2,399 images for each of the 12 classes. Standard deviation σ=0. This is not coincidental — it is the result of precise control within the synthetic data generation pipeline. This level of perfect balance is simply impossible with real-world footage, and it is one of synthetic data's defining strengths.
Level 1 — Basic Quality: All Checks Pass
Level 1 examines fundamental image integrity, missing values, class balance, and statistics. PBLS_Drone_classification earned a Good rating across all four checks.
✅ Image Integrity
All images fixed at 1920×1080 px. Min equals max — zero size variance. 100% consistent RGB channels. Ready for training without any preprocessing.
✅ Class Balance
12 classes × 2,399 images. Standard deviation σ = 0.0. Zero model bias from class imbalance. No class is over- or under-represented.
L1 Summary — Synthetic Data's Precision Control
If you tried to build a classification dataset from real drone footage, achieving balanced class counts would be extremely difficult on its own. Certain drone types are rarely captured on camera; certain environments and angles produce skewed distributions. PBLS_Drone_classification eliminates this problem entirely through its CG generation pipeline — you simply render each of the 12 drone types exactly 2,399 times.
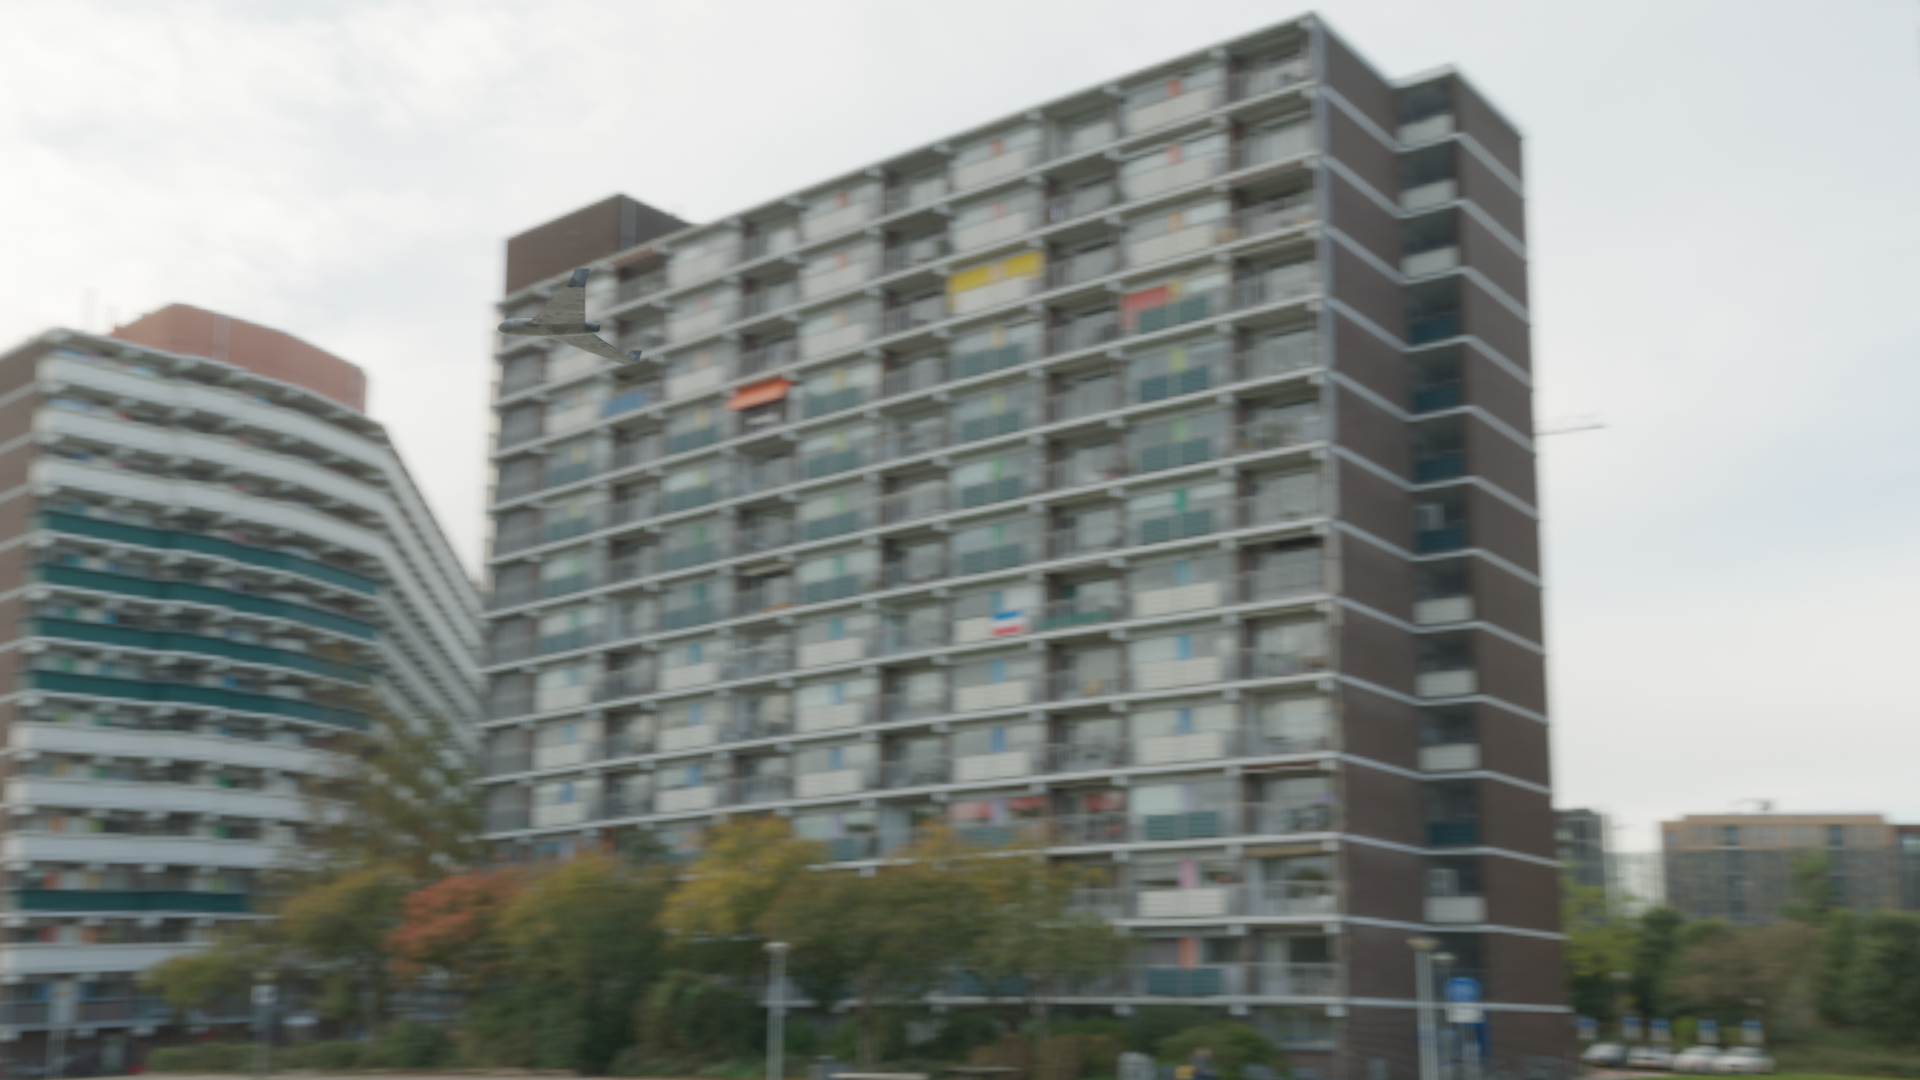
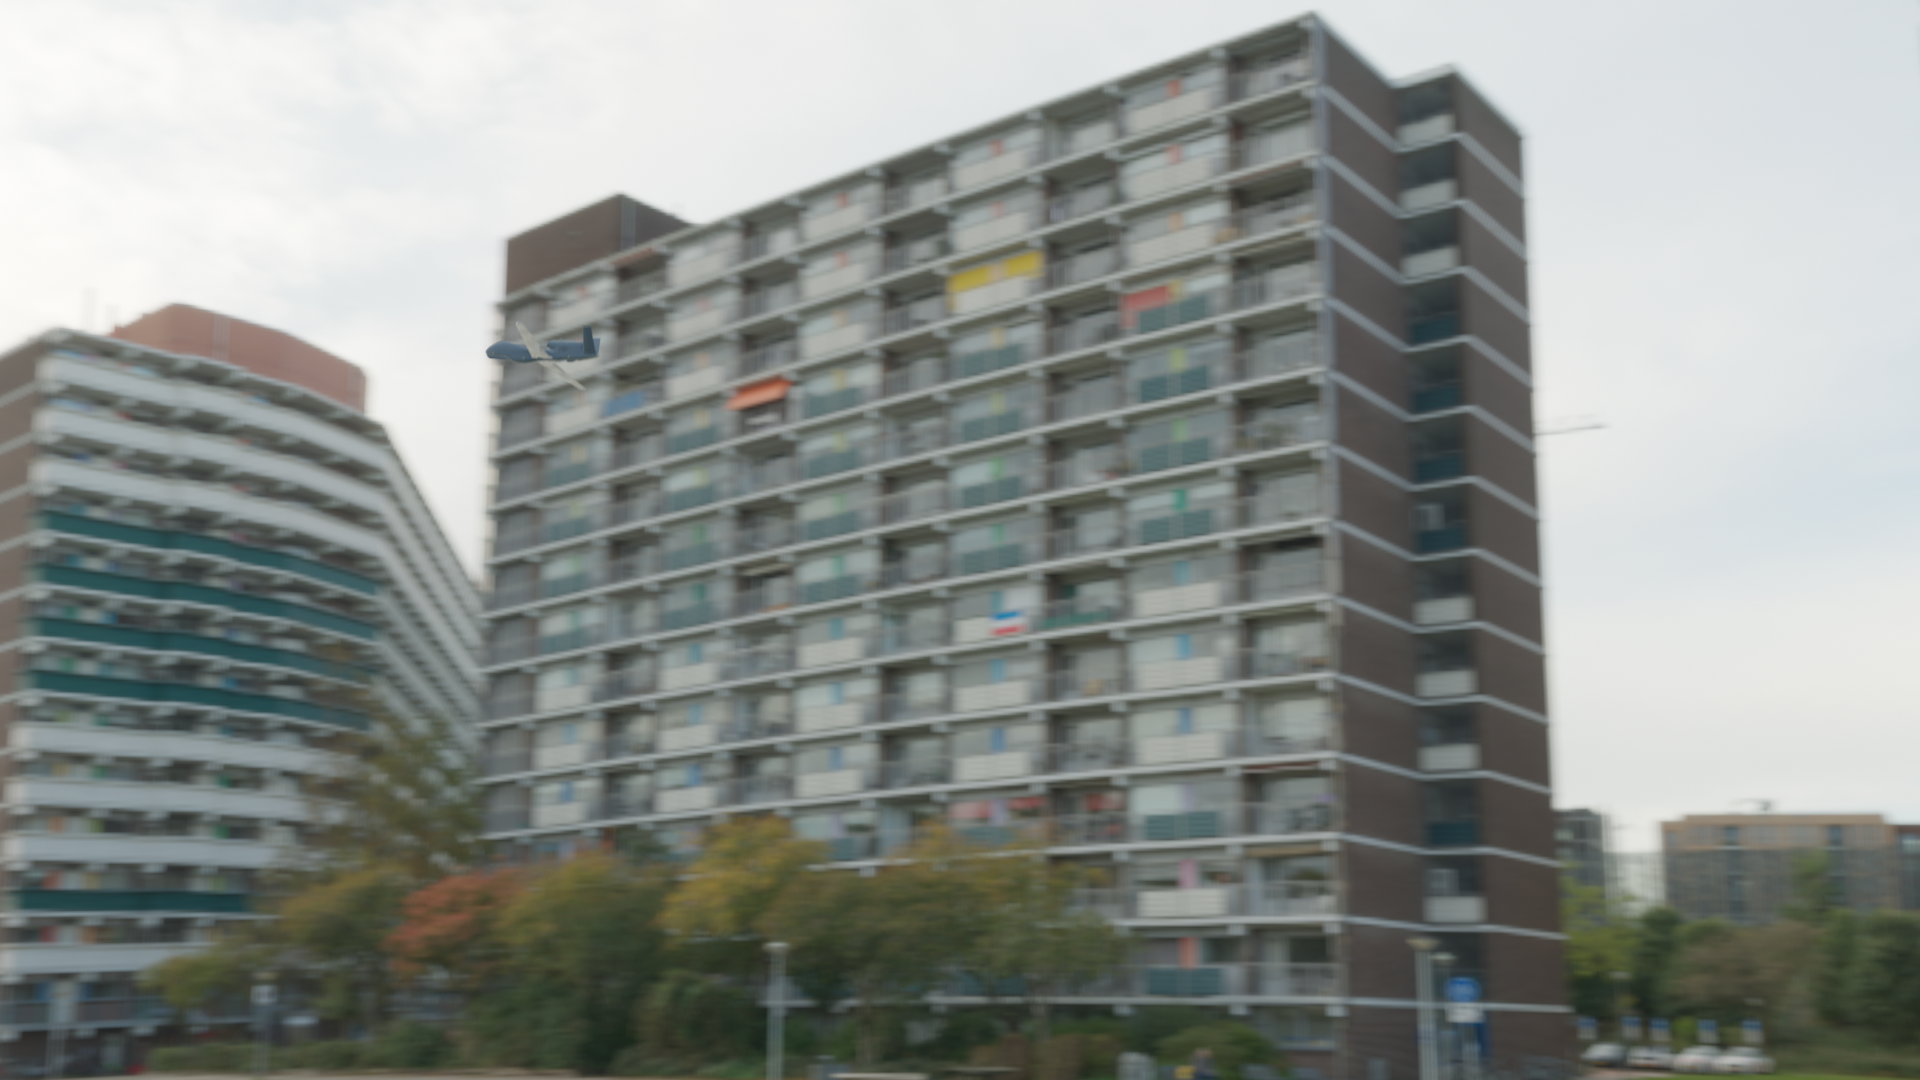
Class Mean Images — Background Repetition Made Visible
A mean image is the pixel-wise average of all images in a class. When a background repeats frequently, it appears sharp in the mean; the drone itself becomes blurred. The right-hand image in each pair shows the most canonical (high-density) real frame from the same class.

DR01 — Mean (left) · Canonical (right)

DR02 — Mean (left) · Canonical (right)
DR03 — Mean (left) · Canonical (right)
DR04 — Mean (left) · Canonical (right)

DR05 — Mean (left) · High-density canonical (right)

DR06 — Mean (left) · Canonical (right)
▲ Per-class mean images for DR01–DR06 (DataClinic L1) alongside high-density canonical samples. The sharper the background in the mean image, the more that background was repeated across the class.
Level 2 — DataLens Analysis: Environments Cluster, Distribution Fragments
Level 2 uses the Wolfram ImageIdentify Net V2 (1,280 dimensions) as its lens to analyze the latent-space structure of the data. This is a general-purpose lens — not drone-specific — and captures broad visual characteristics across the dataset.
▲ L2 PCA full distribution — feature space across all data (dense cluster top-left, dispersed tail right / Wolfram 1,280-dim lens)
Three Environment Clusters
Through the general-purpose lens, the data groups by shooting environment rather than drone type.
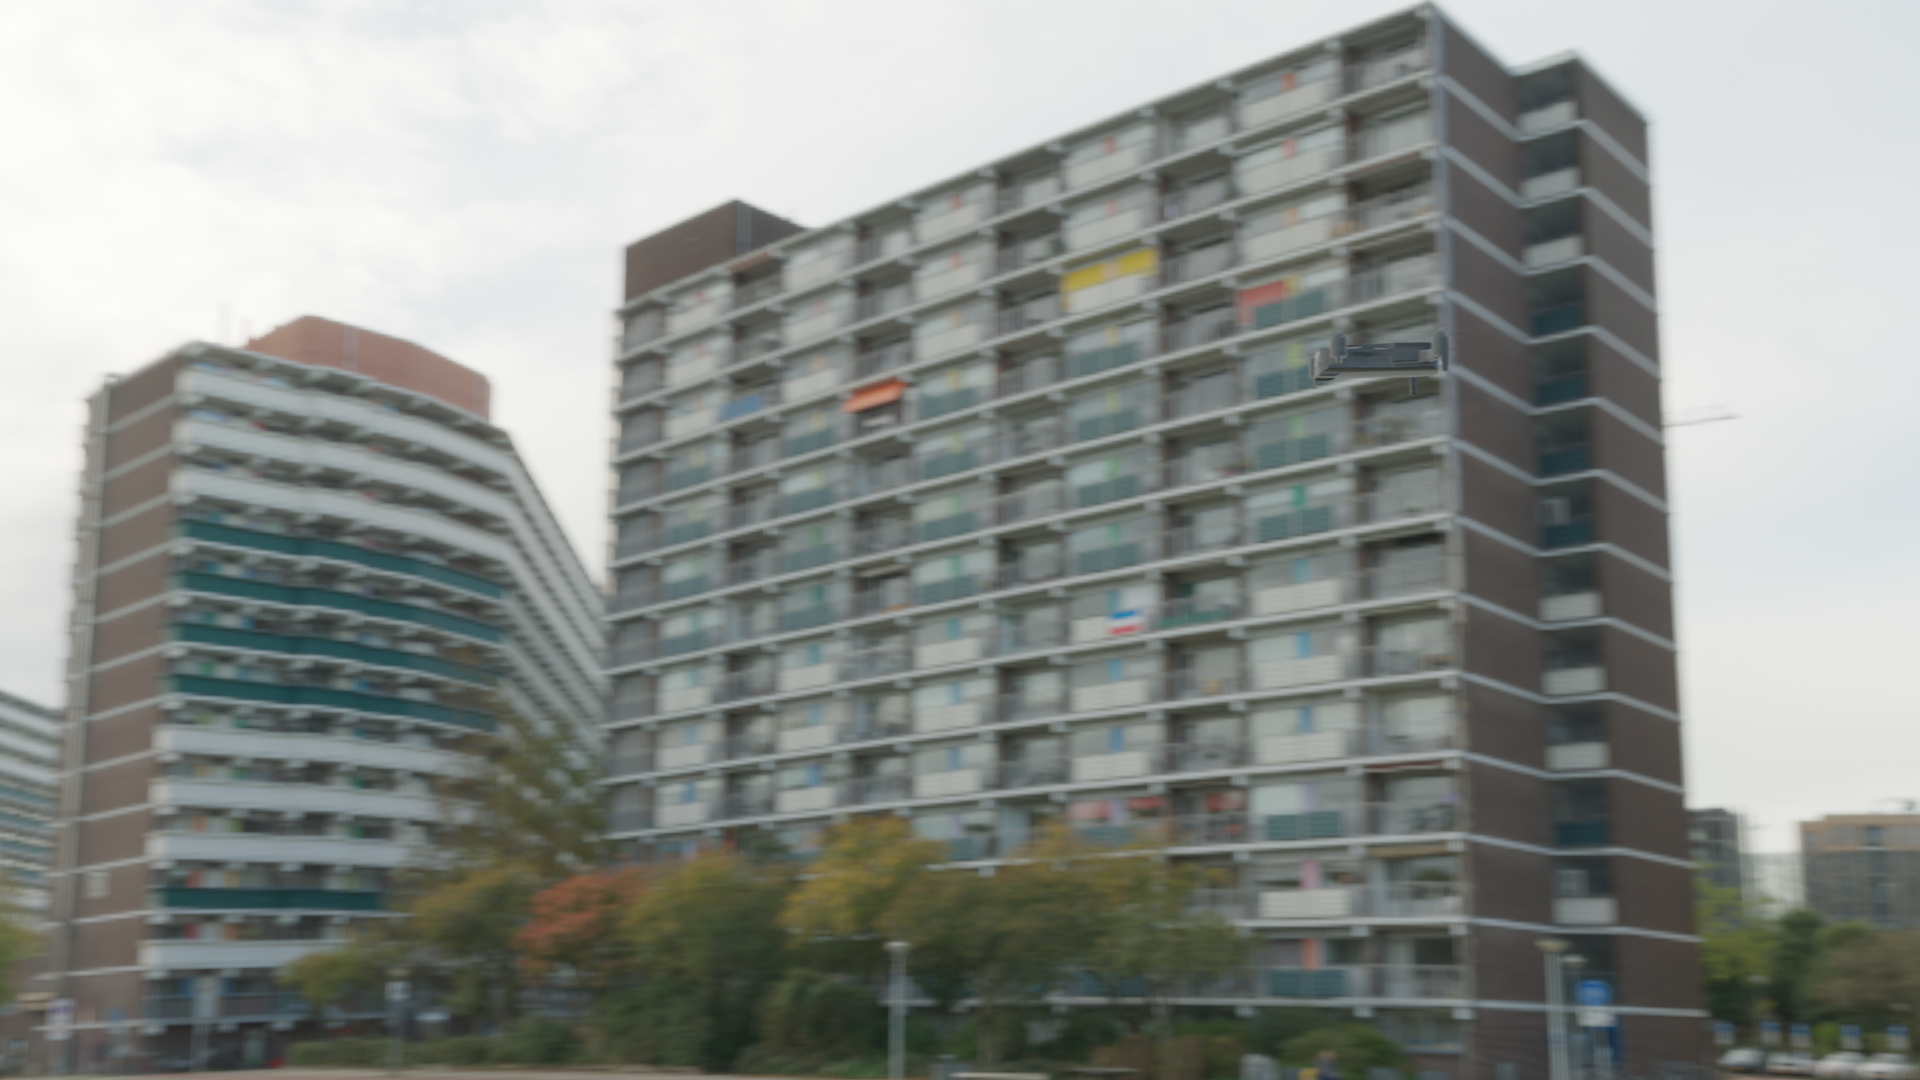
Urban Environment
High-rise buildings, city backgrounds. The dominant cluster containing the largest share of images.
Natural Environment
Forests, fields, open sky. Visually distinct from urban backgrounds.
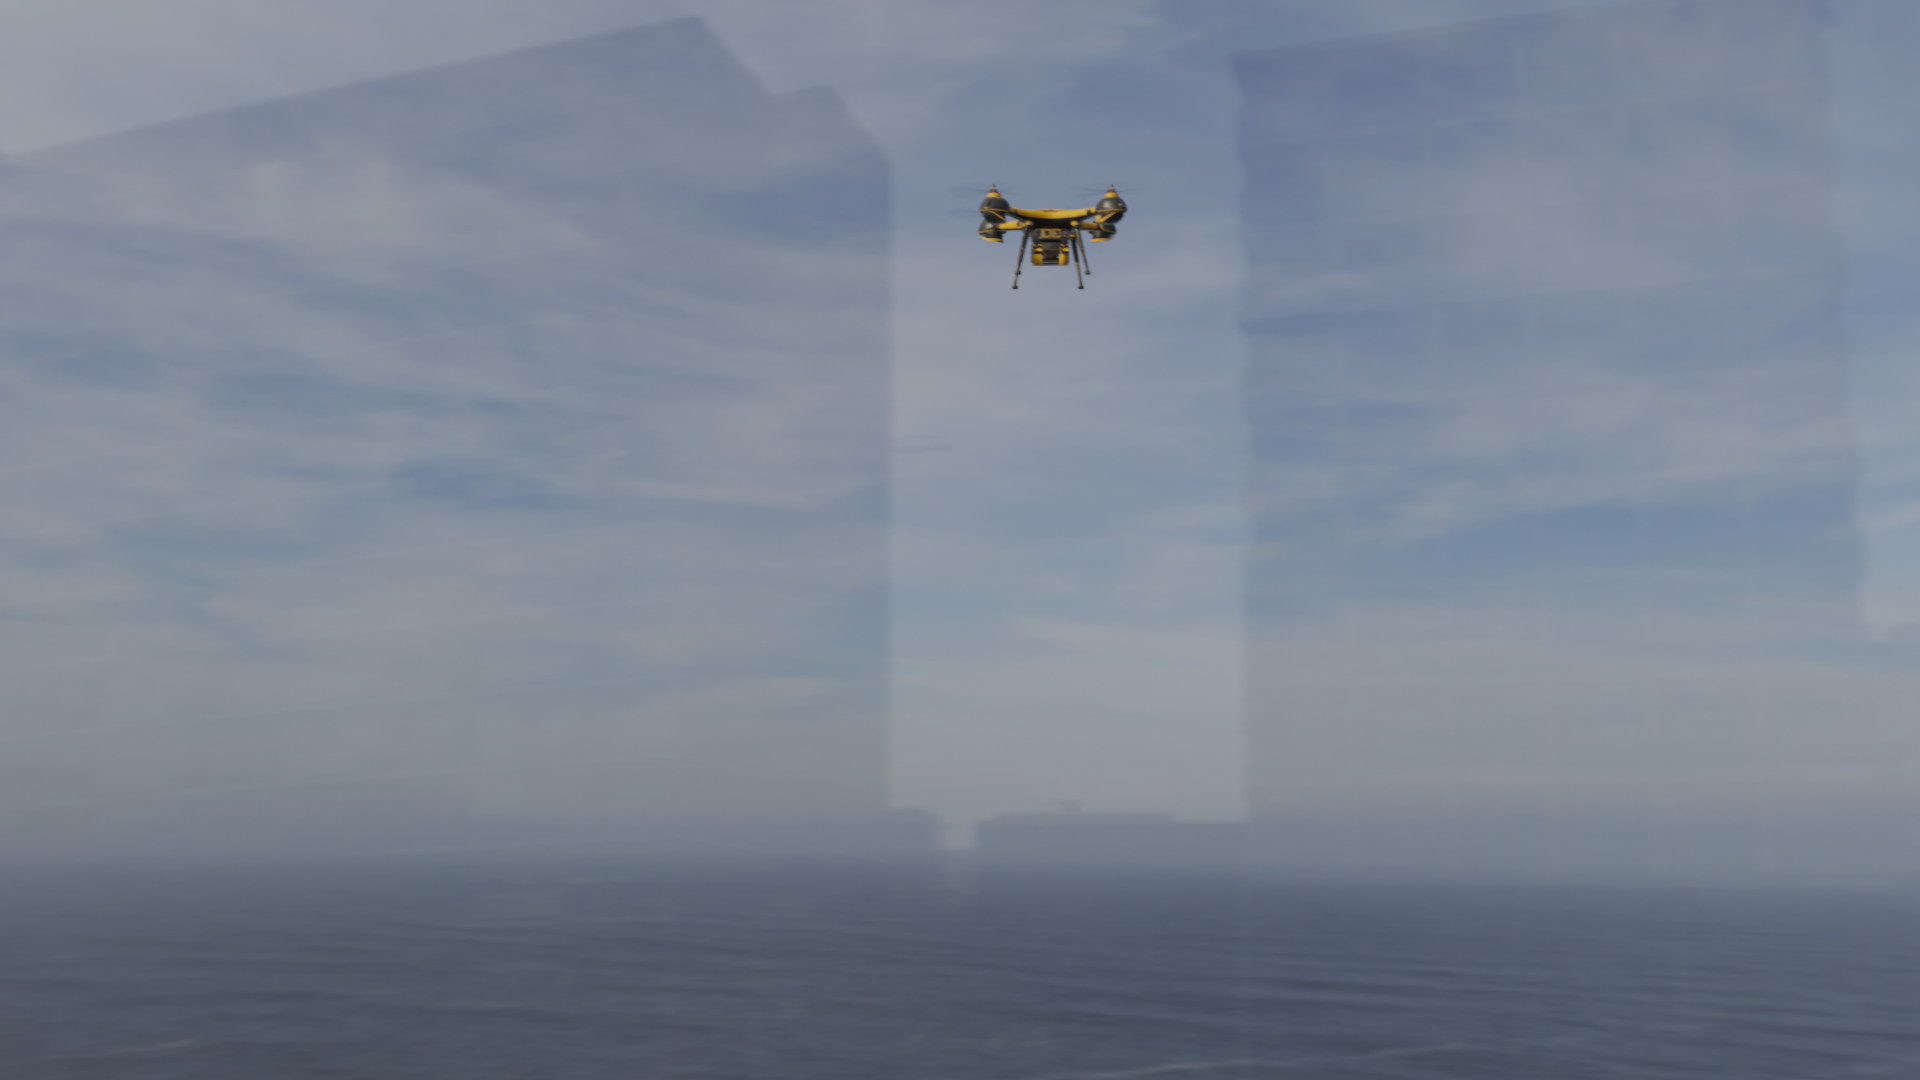
Mixed Environment
Coastal, suburban, and composite backgrounds. Positioned between the two main clusters.
▲ L2 density terrain map — positions and densities of the three environment clusters
L2 Distribution: Poor — What Multimodality Means
The Poor rating on L2 distribution is caused by a multimodal distribution. The data does not form a single continuous distribution; instead, it breaks into multiple discrete clusters. Three environment clusters sit disconnected from one another — meaning the dataset is fragmented. For a model to generalize robustly across varying environments, it needs in-between data that bridges those clusters.
Level 3 — Even the Domain-Specific Lens Can't Resolve the Split
Level 3 applies a 53-dimensional domain-specific lens. It selects only the dimensions from the 3-million-image Wolfram model that retain discriminative power for drone classification, giving a more drone-focused view of the data than the general-purpose L2 lens.
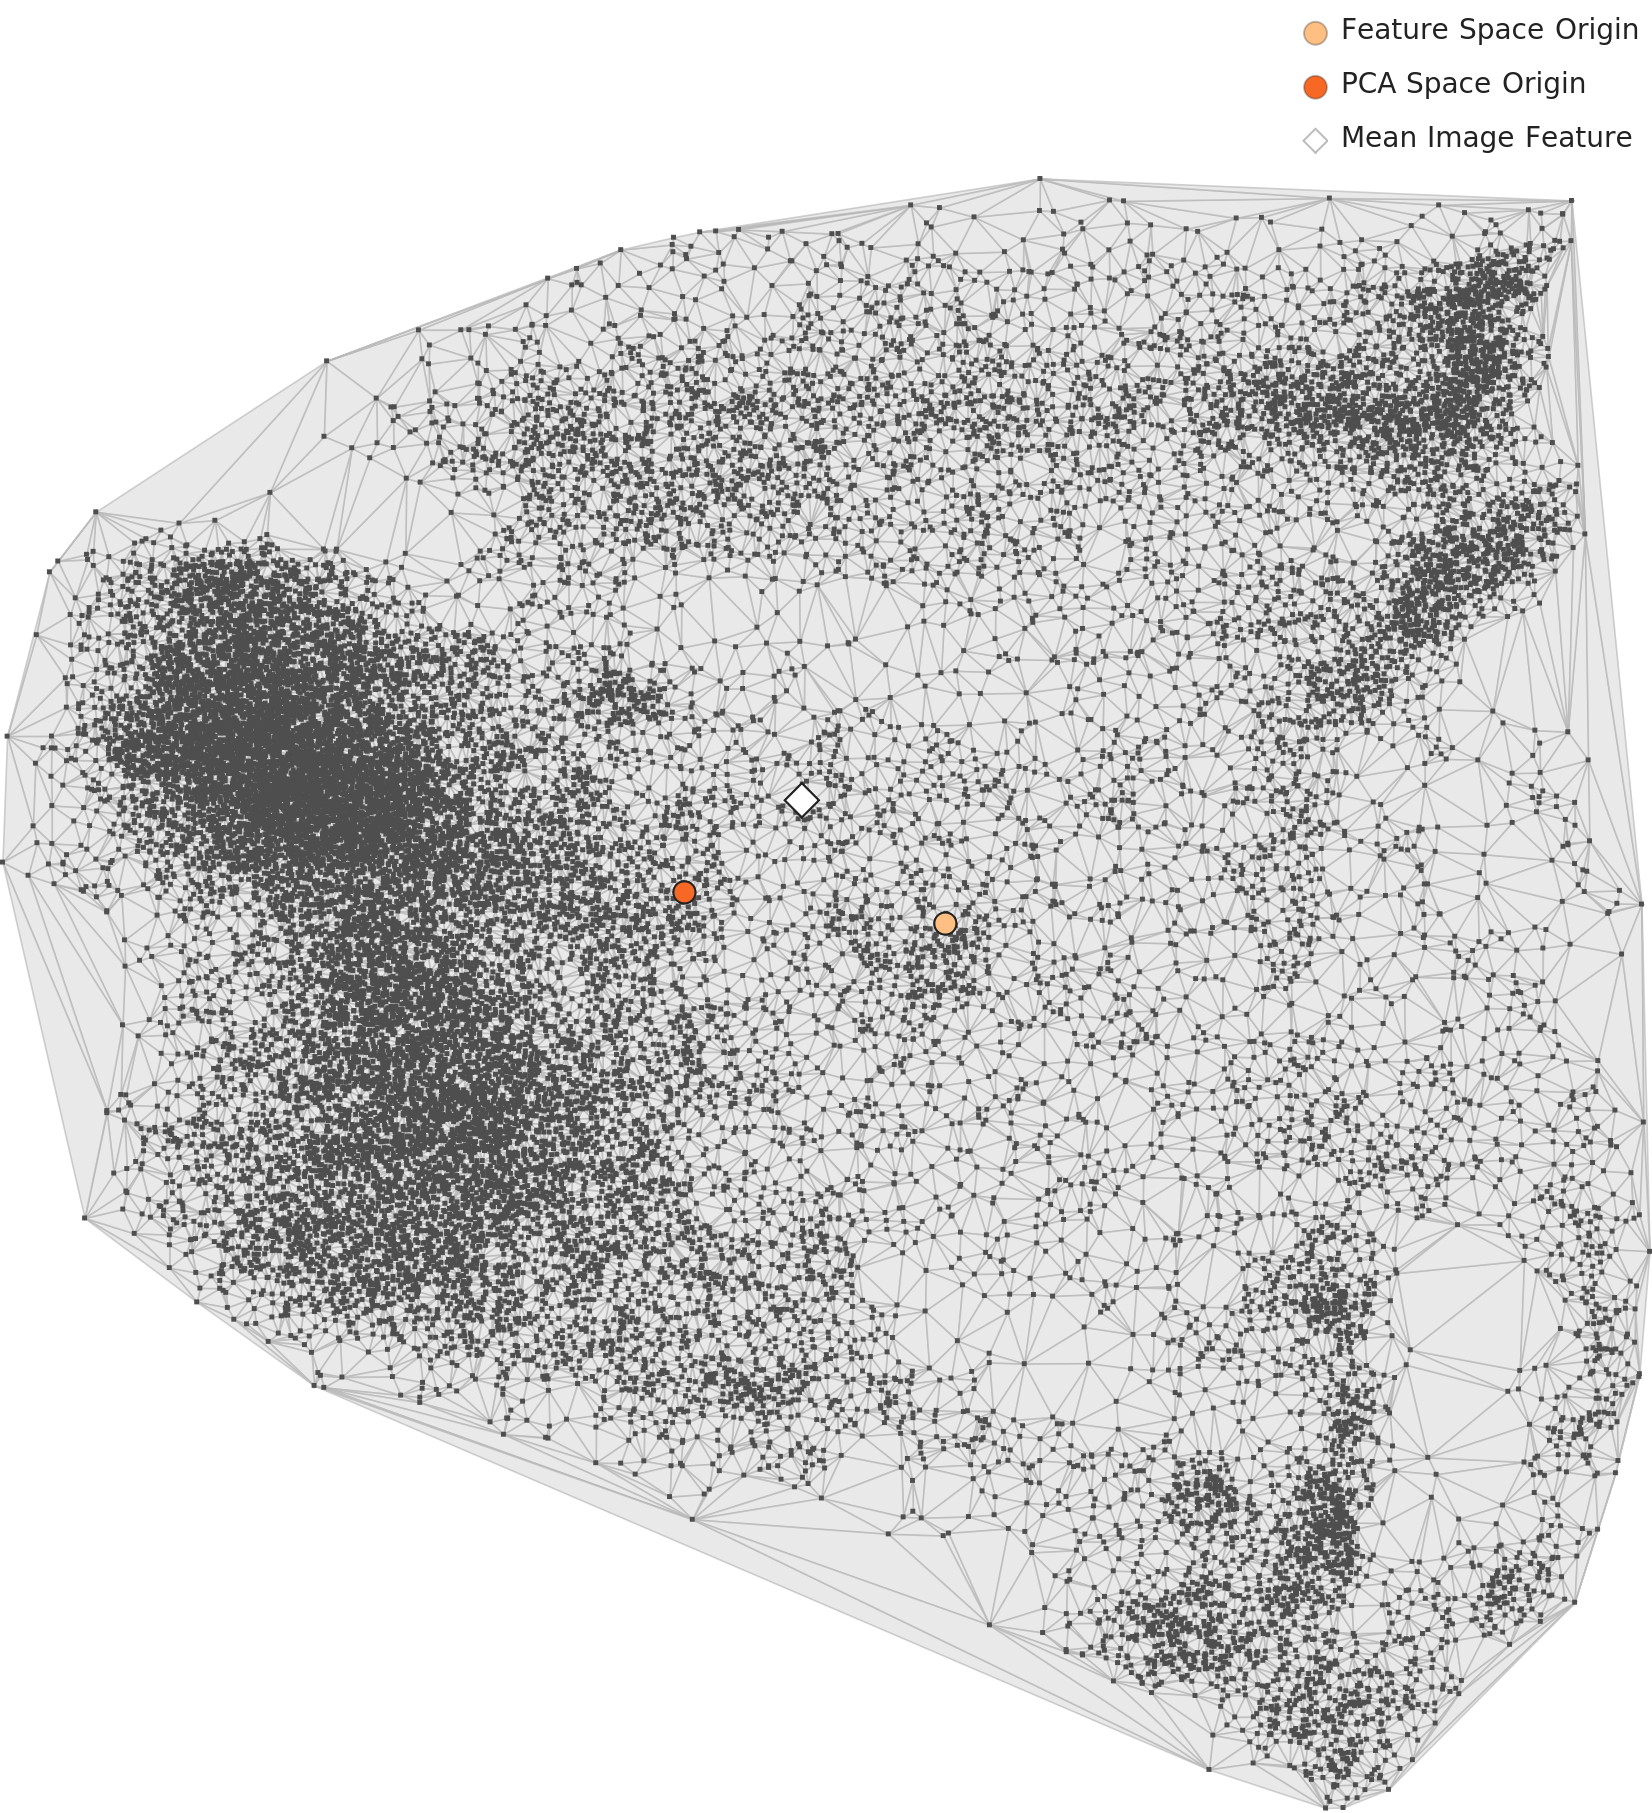
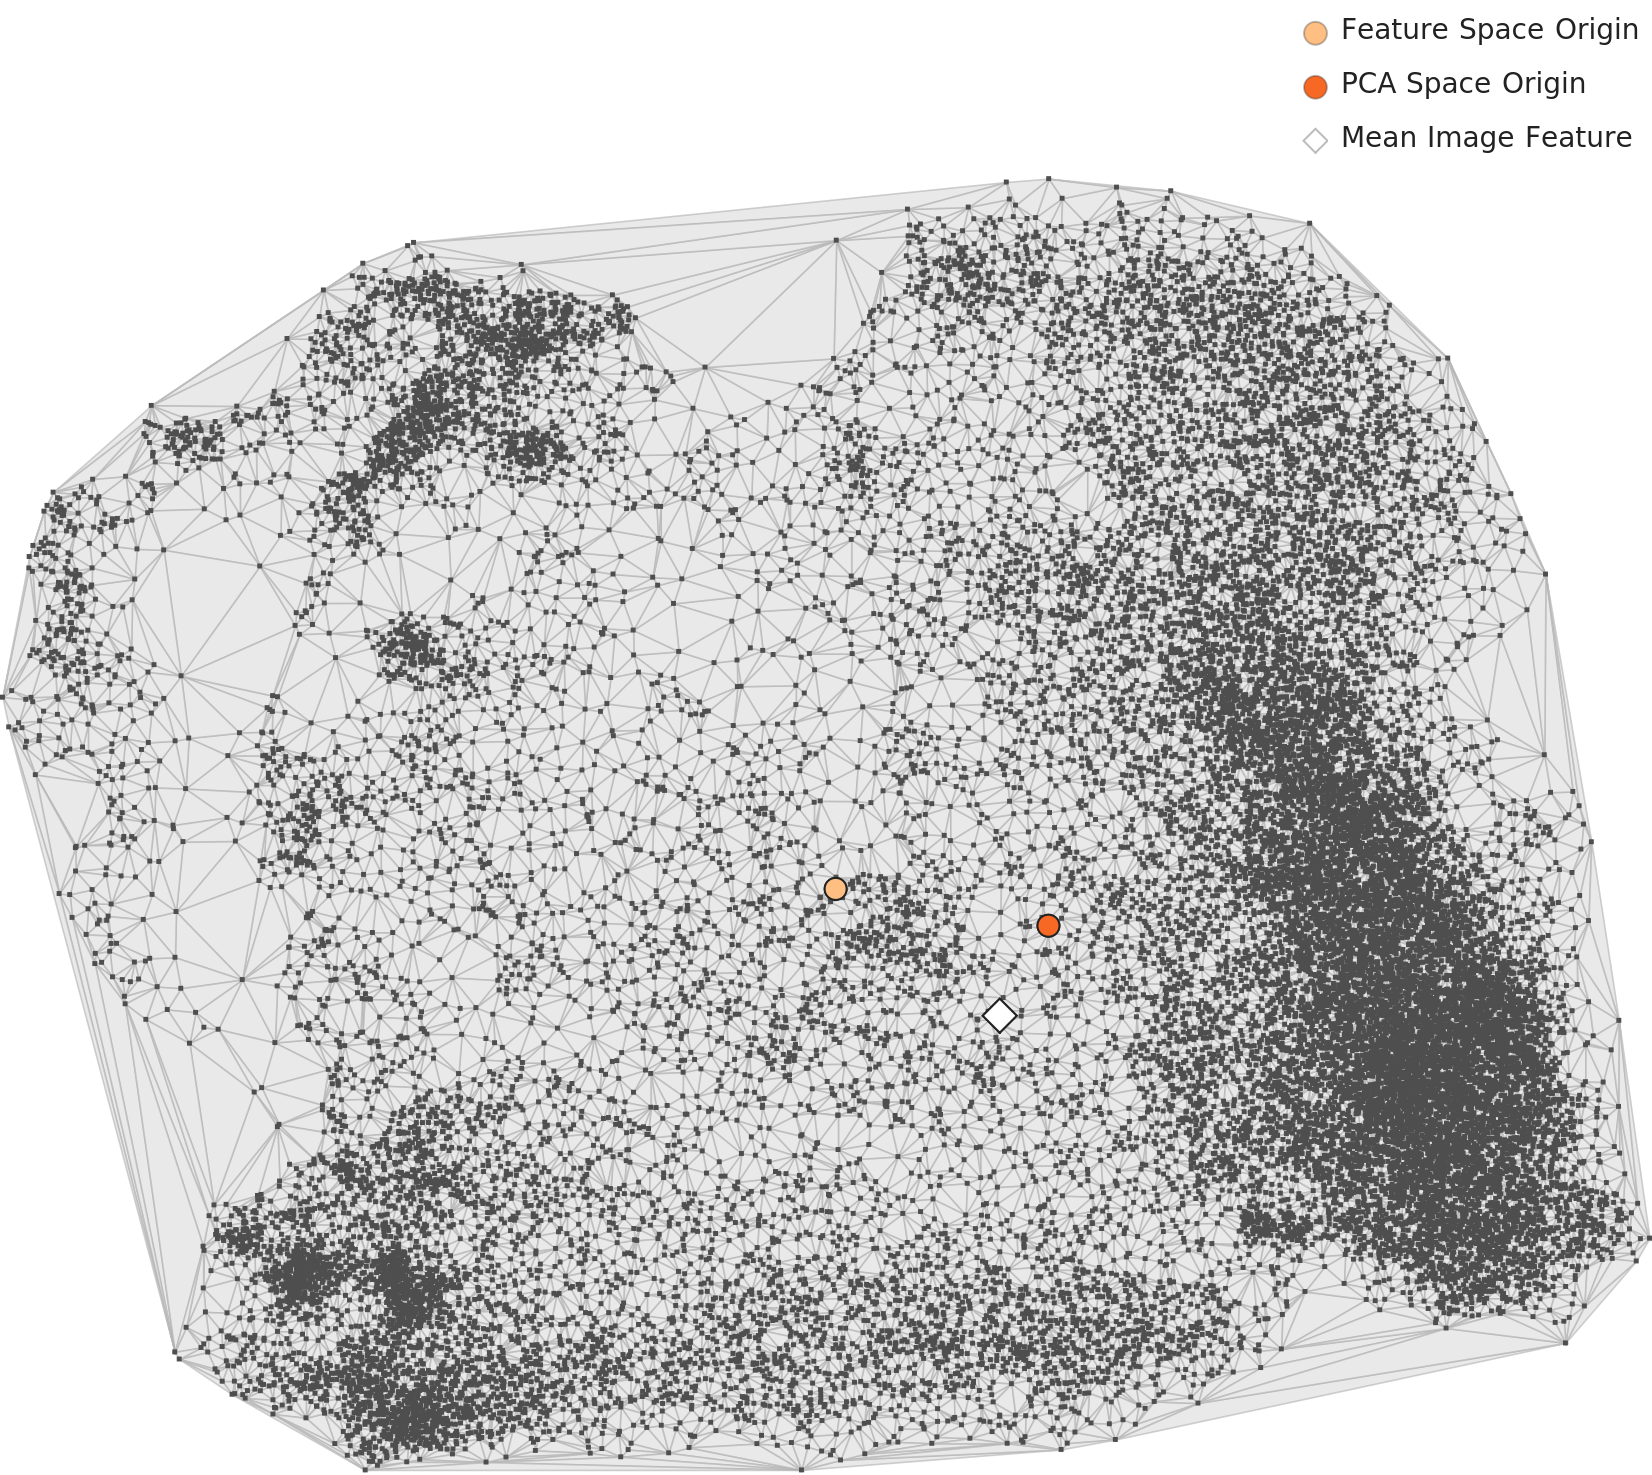
▲ L3 PCA full distribution — 53-dim drone-specific lens. Point cloud spreads widely with uneven density.
⚠️ 3-Cluster Structure Persists — Domain-Specific Lens Fails to Heal the Split
This dataset split into three clusters under the 1,280-dim general-purpose lens (L2). Under the 53-dim drone-specific lens (L3), it still maintains three separate clusters. The density contour plot below makes this unambiguously clear:
- • Primary cluster (center-left, dominant): The largest, highest-density group — the vast majority of data concentrates here
- • Secondary cluster (upper-right): Medium-sized, spatially disconnected from the primary cluster
- • Minor cluster (lower-right): Small, low-density outlier group
If the L2 split were caused purely by a general-purpose lens picking up environmental background differences, switching to a domain-specific lens should resolve it. But the fact that the split persists under a drone-classification lens indicates that visually dissimilar subgroups exist within the drone-relevant features themselves. This is the substance behind the L3 "Poor distribution" verdict.
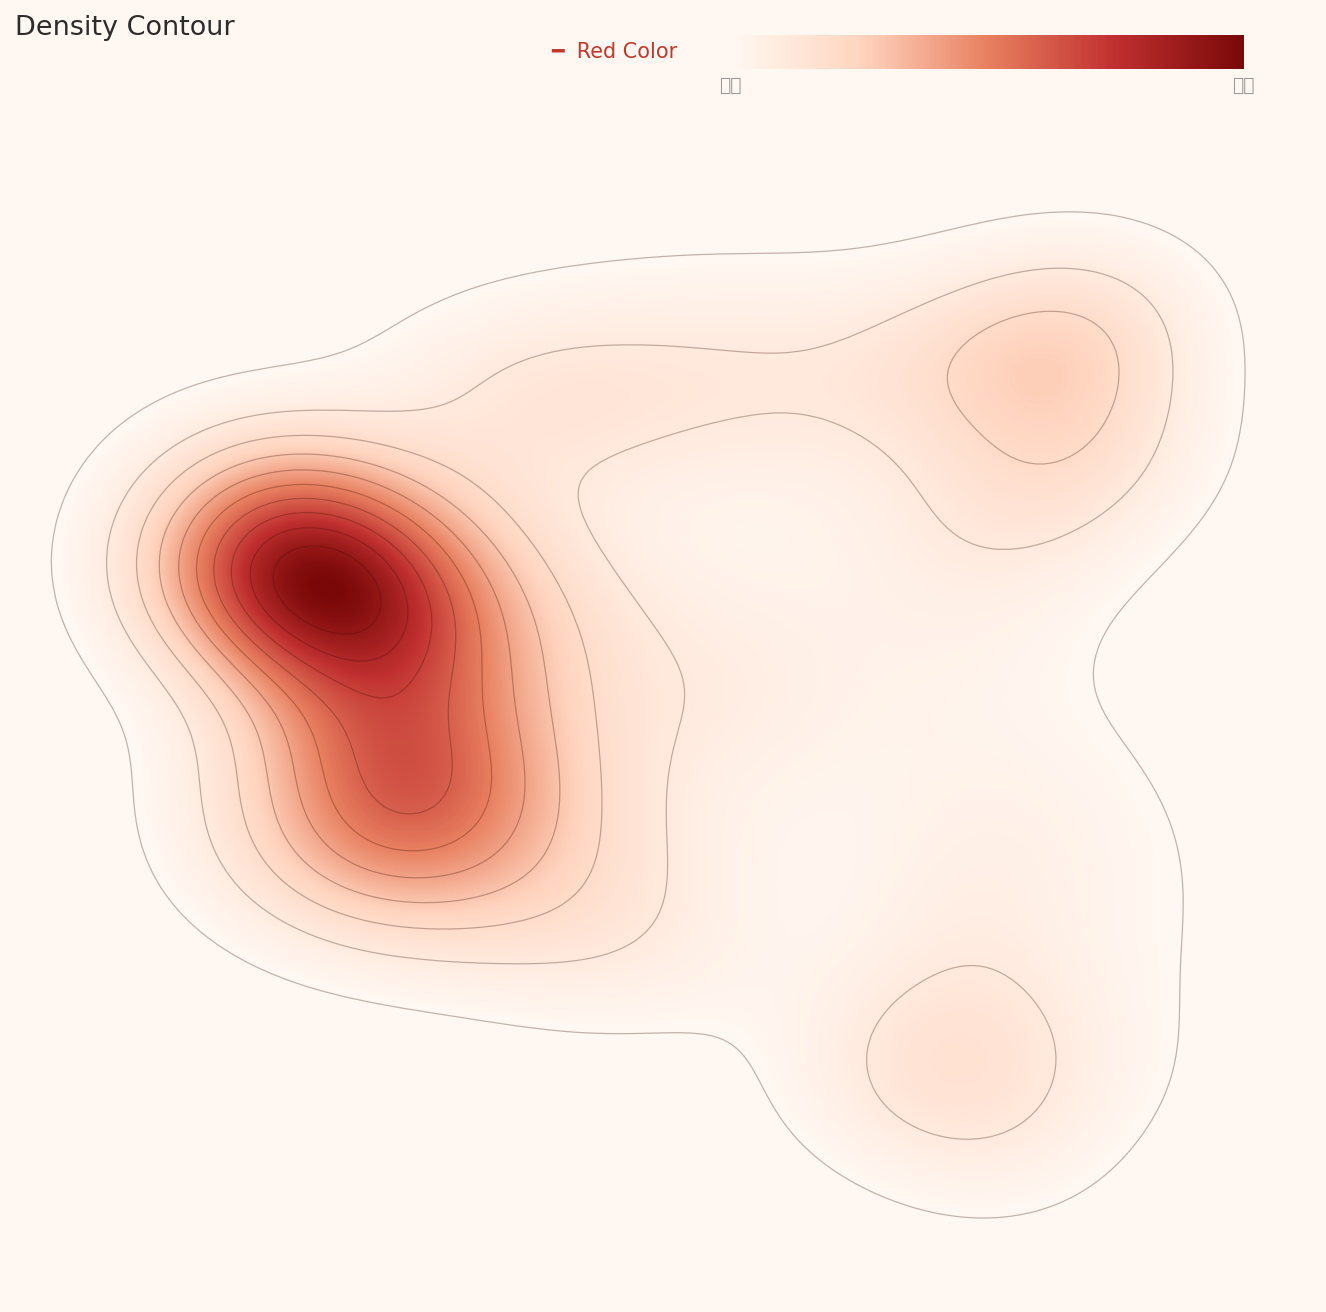
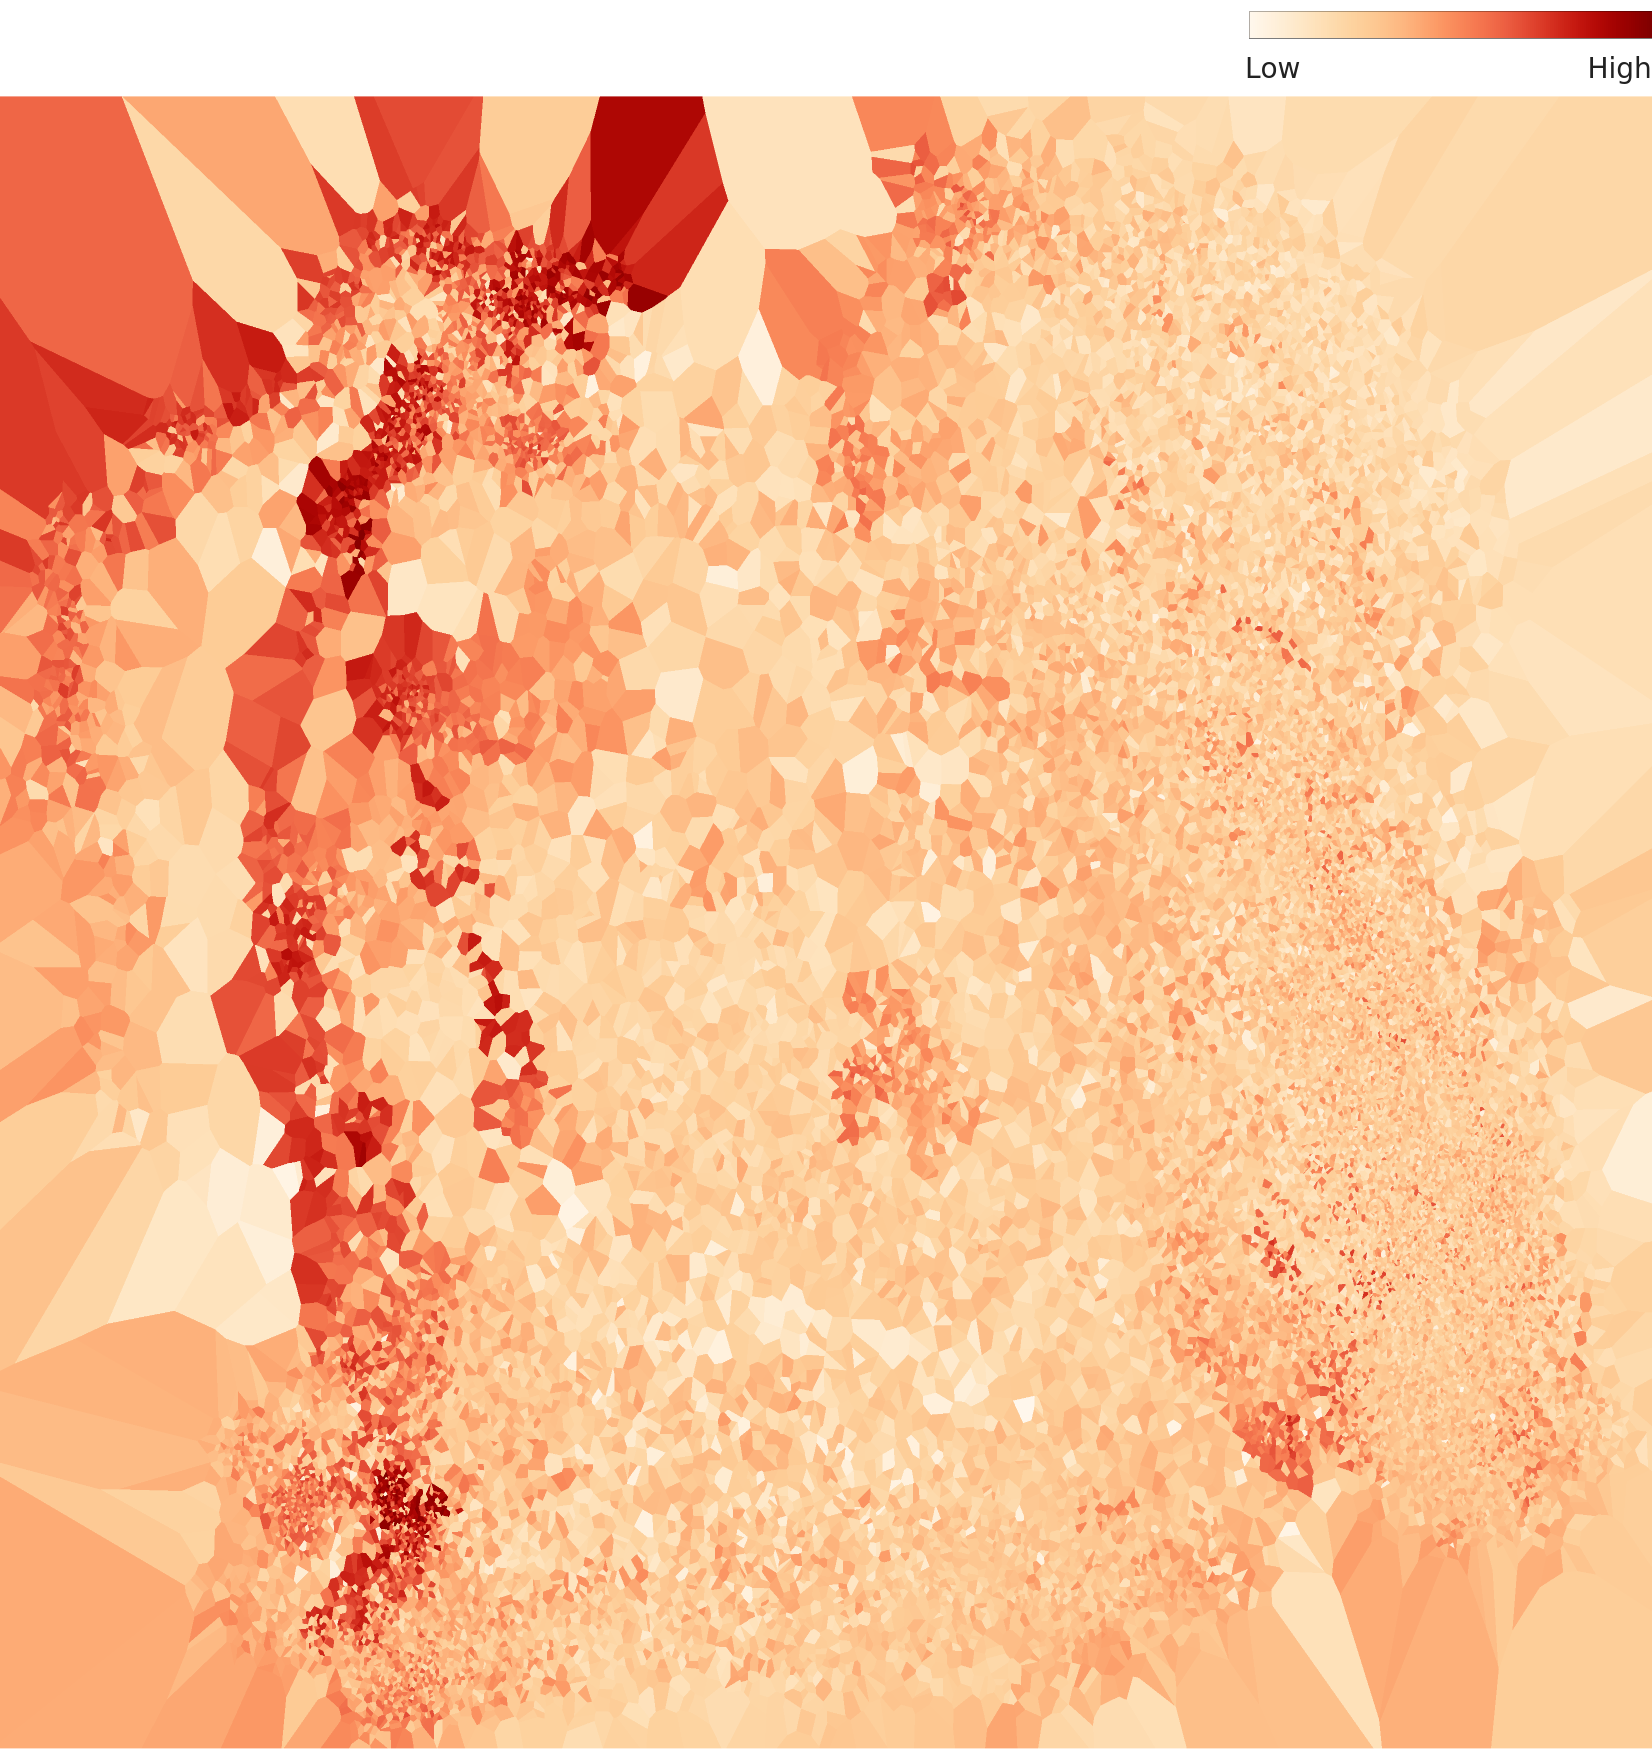
▲ L3 density contour — dominant primary cluster (deep red, center-left) + two secondary clusters (upper-right, lower-right). All three are clearly separated by the contour lines.
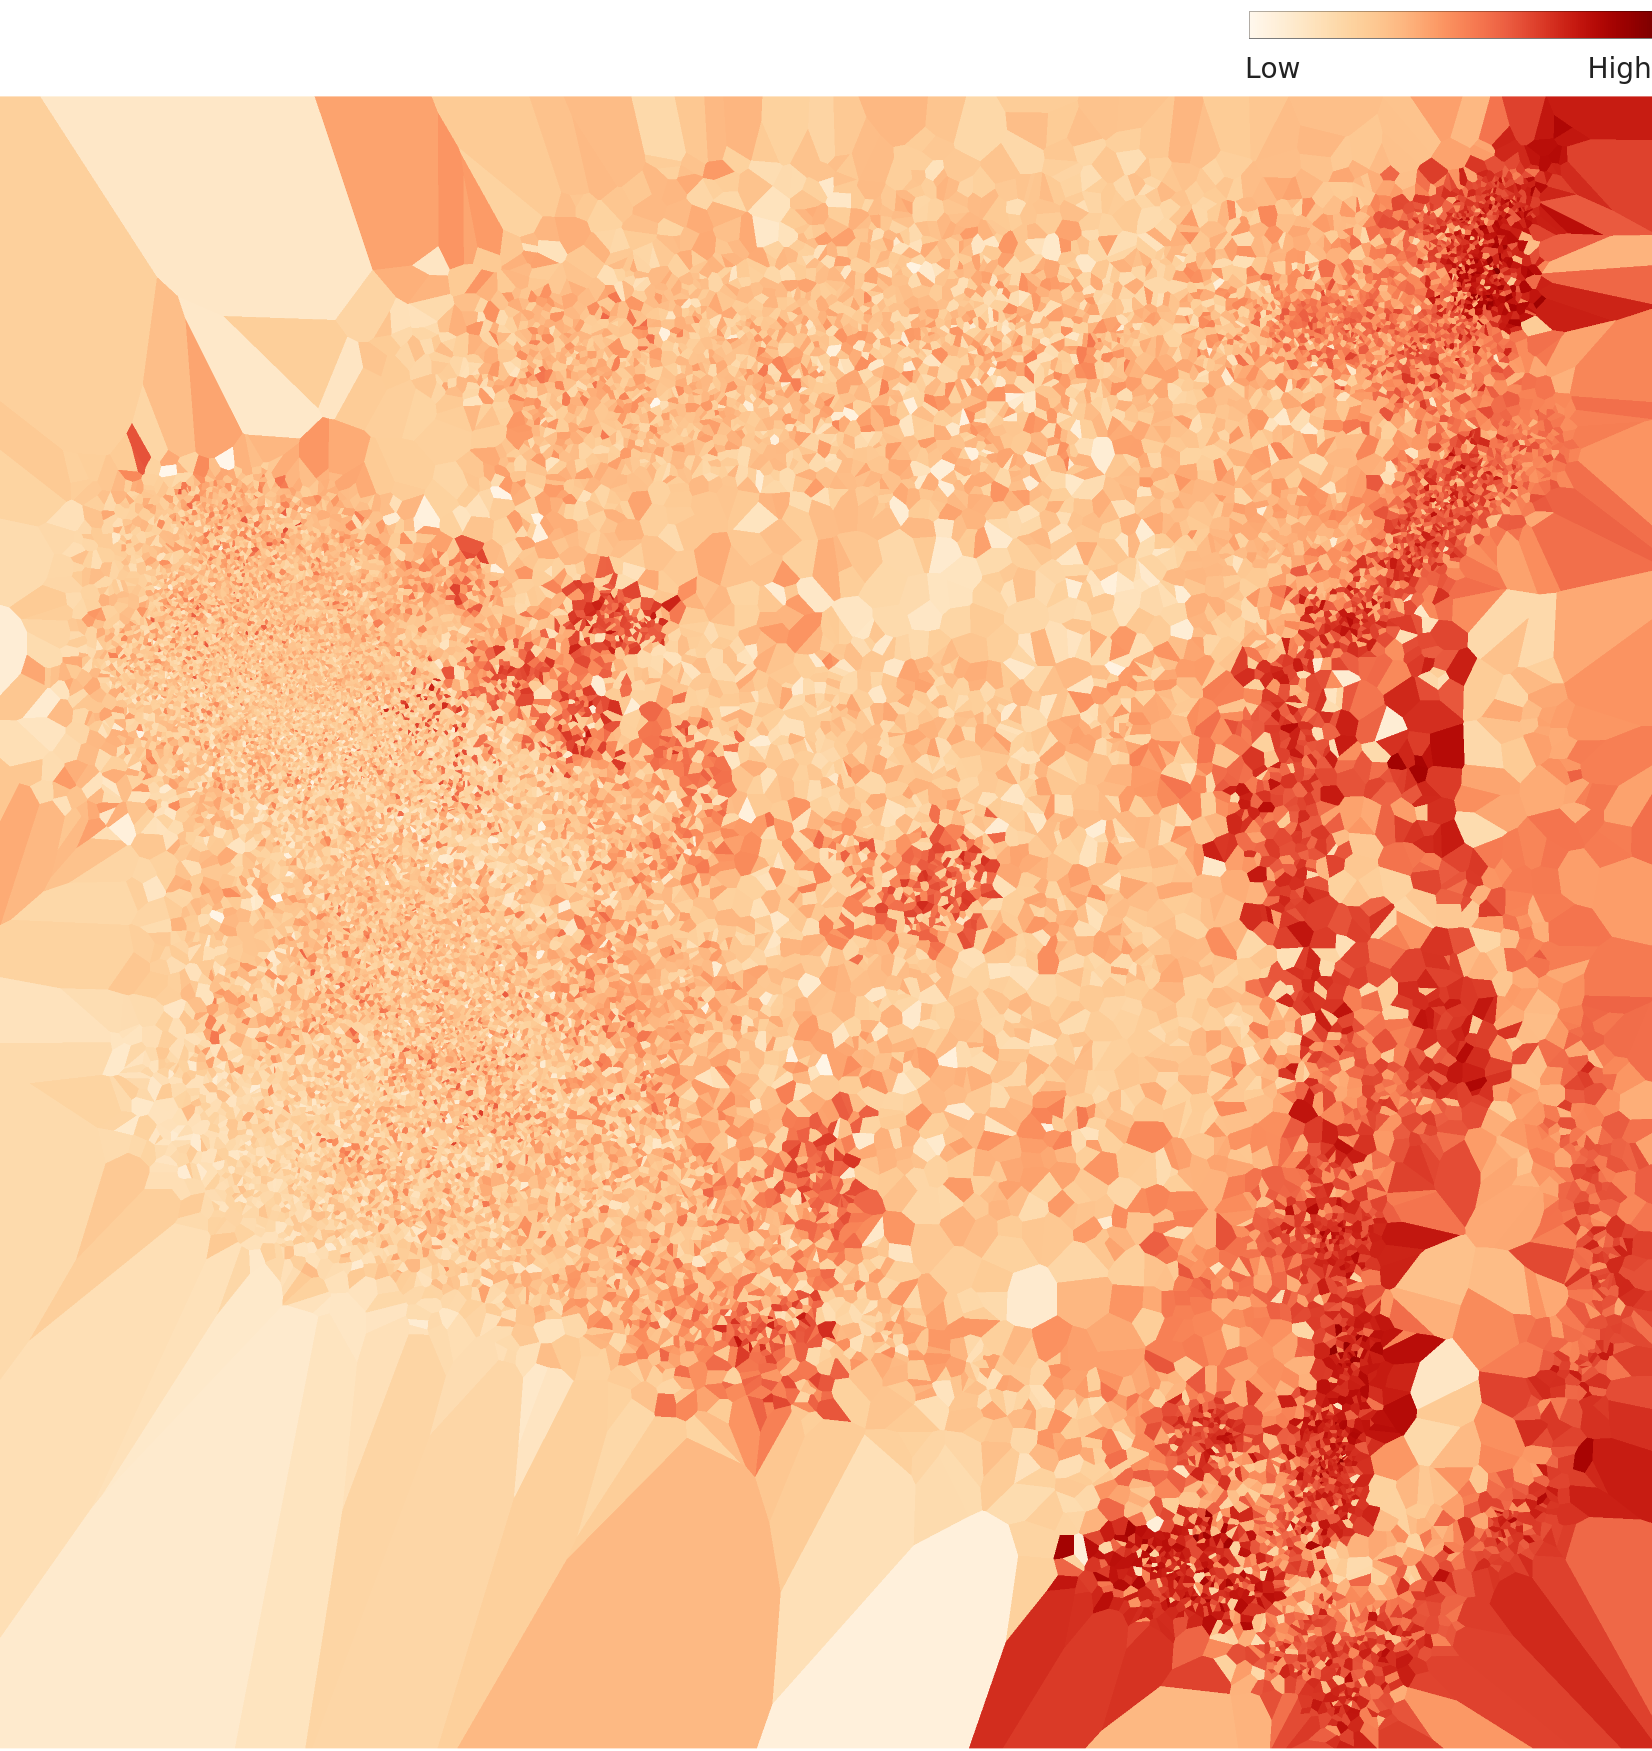
▲ L3 density terrain map — multiple high-density peaks scattered on the right, low-density dispersed area on the left. Asymmetric structure overall.
The video frame redundancy problem: Each drone's 2,399 images are extracted from consecutive frames of a flight simulation. When the interval between frames is small, adjacent frames are nearly identical — the drone has barely moved. The domain-specific lens captures how these redundant frames pack densely together in feature space. This is the concrete reality behind the diagnosis of low intra-class diversity.
Density Histograms — Comparing L2 vs L3 Lenses
These histograms visualize how "typical" each image is — i.e., its density value distribution. A tall, narrow peak means images are highly similar to one another (high redundancy); a broad spread indicates greater diversity. The indigo region marks the outlier zone; the teal region marks the long-tail (video redundancy) zone.
▲ L2 density histogram — general 1,280-dim lens. Narrow, low density range (0.1–0.7), reflecting multimodal structure.
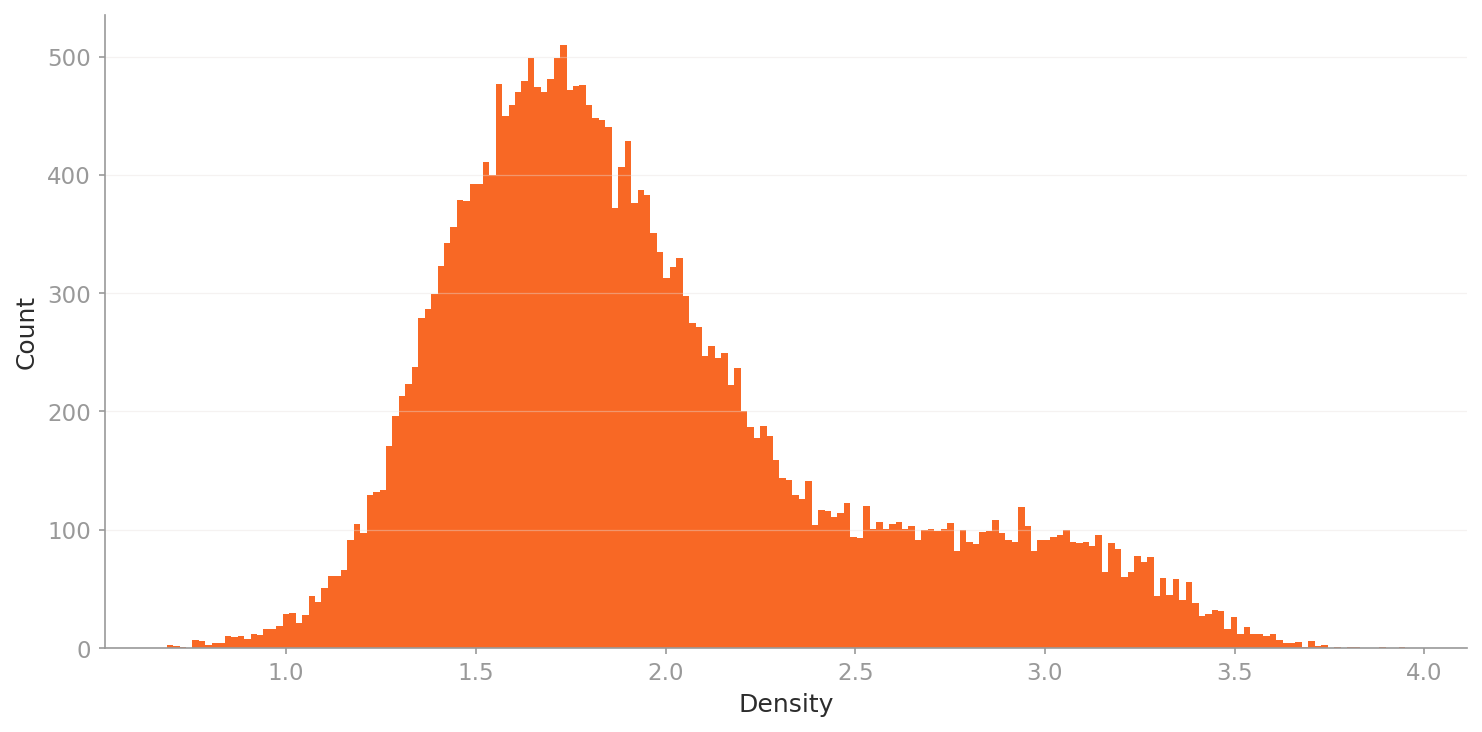
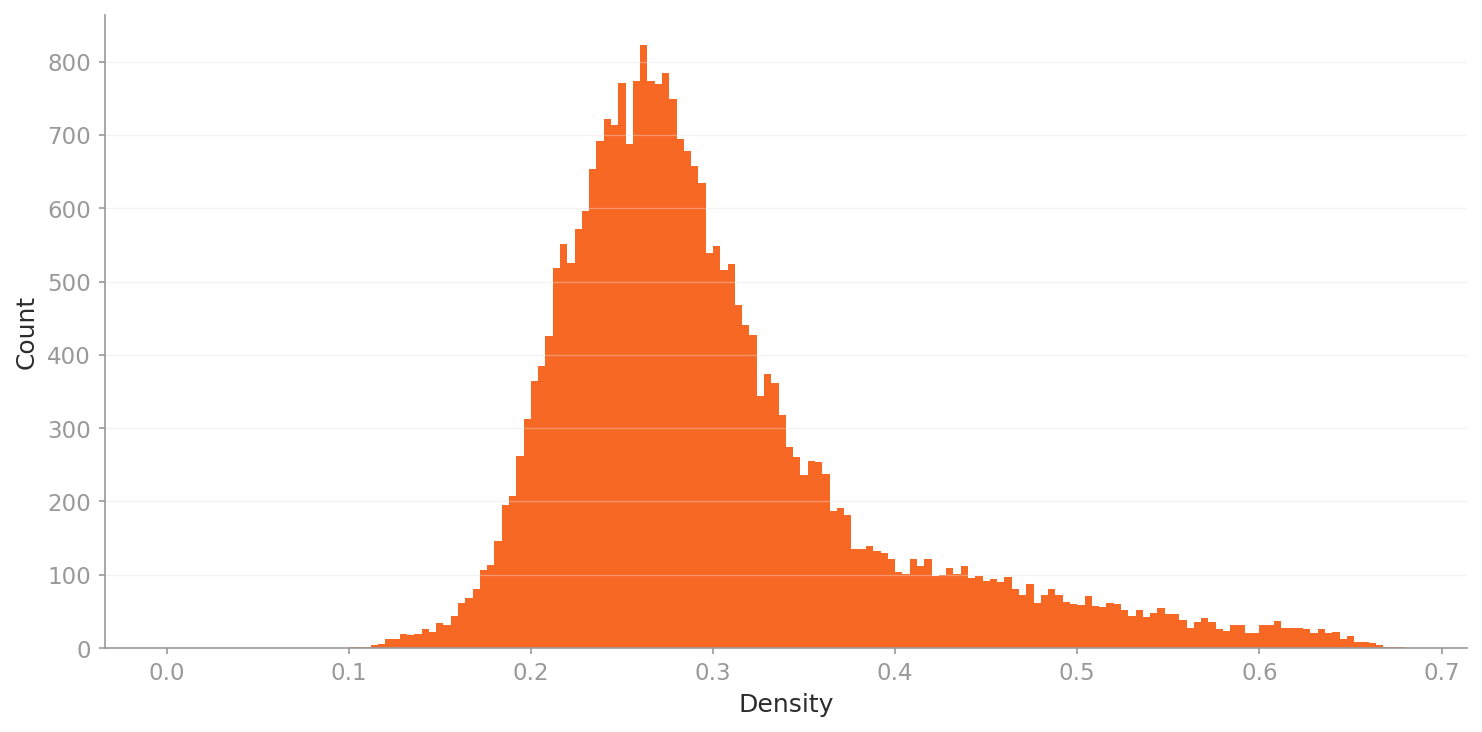
▲ L3 density histogram — drone-specific 53-dim lens. Bell-shaped peak at 1.5–1.8 with a right tail (2.5–4.0) — reflecting high-density repeated frames.
What the Two Lenses Capture Differently
L2 (General 1,280-dim)
Density range 0.1–0.7: narrow and low. Images scatter across multiple clusters driven by environmental and background differences. The multimodal structure is explained by background variation.
L3 (Drone-specific 53-dim)
Density range 0.7–4.0: much broader and higher. Bell-shaped peak at 1.5–1.8 with a right tail (above 2.5). Even through a drone-focused lens, high-density repetition zones persist — sharply exposing the structural problem of redundant frames.
Per-Class Density Distribution — Which Drones Are Most Canonical?
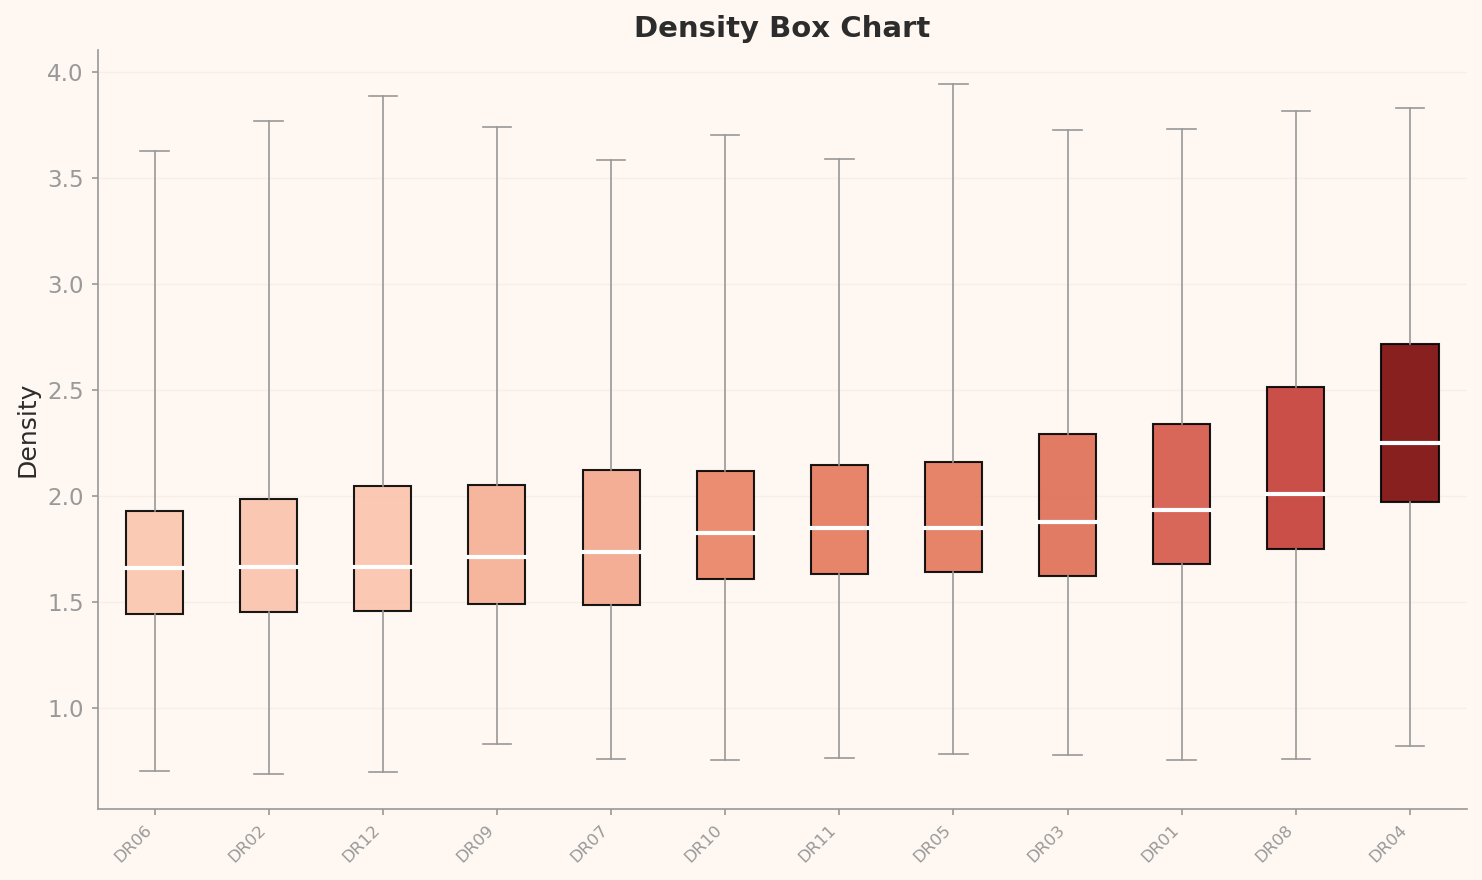
▲ L3 per-class density box chart — further right means that class's images are more similar to one another (more canonical). DR04 and DR08 dominate at high density; DR06 and DR02 score lowest.
What the Density Rankings Tell Us
DR04 and DR08 have median densities of 2.2 and 2.0 respectively — by far the highest. These classes look nearly identical to each other through the drone-specific lens, meaning they have a disproportionately high share of redundant frames. By contrast, DR06 and DR02 sit at a median density of around 1.7 — the lowest — indicating relatively higher intra-class visual diversity. A well-constructed classification dataset would have the diversity level of DR06/DR02 distributed evenly across all classes.
Outlier Analysis — Canonical vs Anomalous
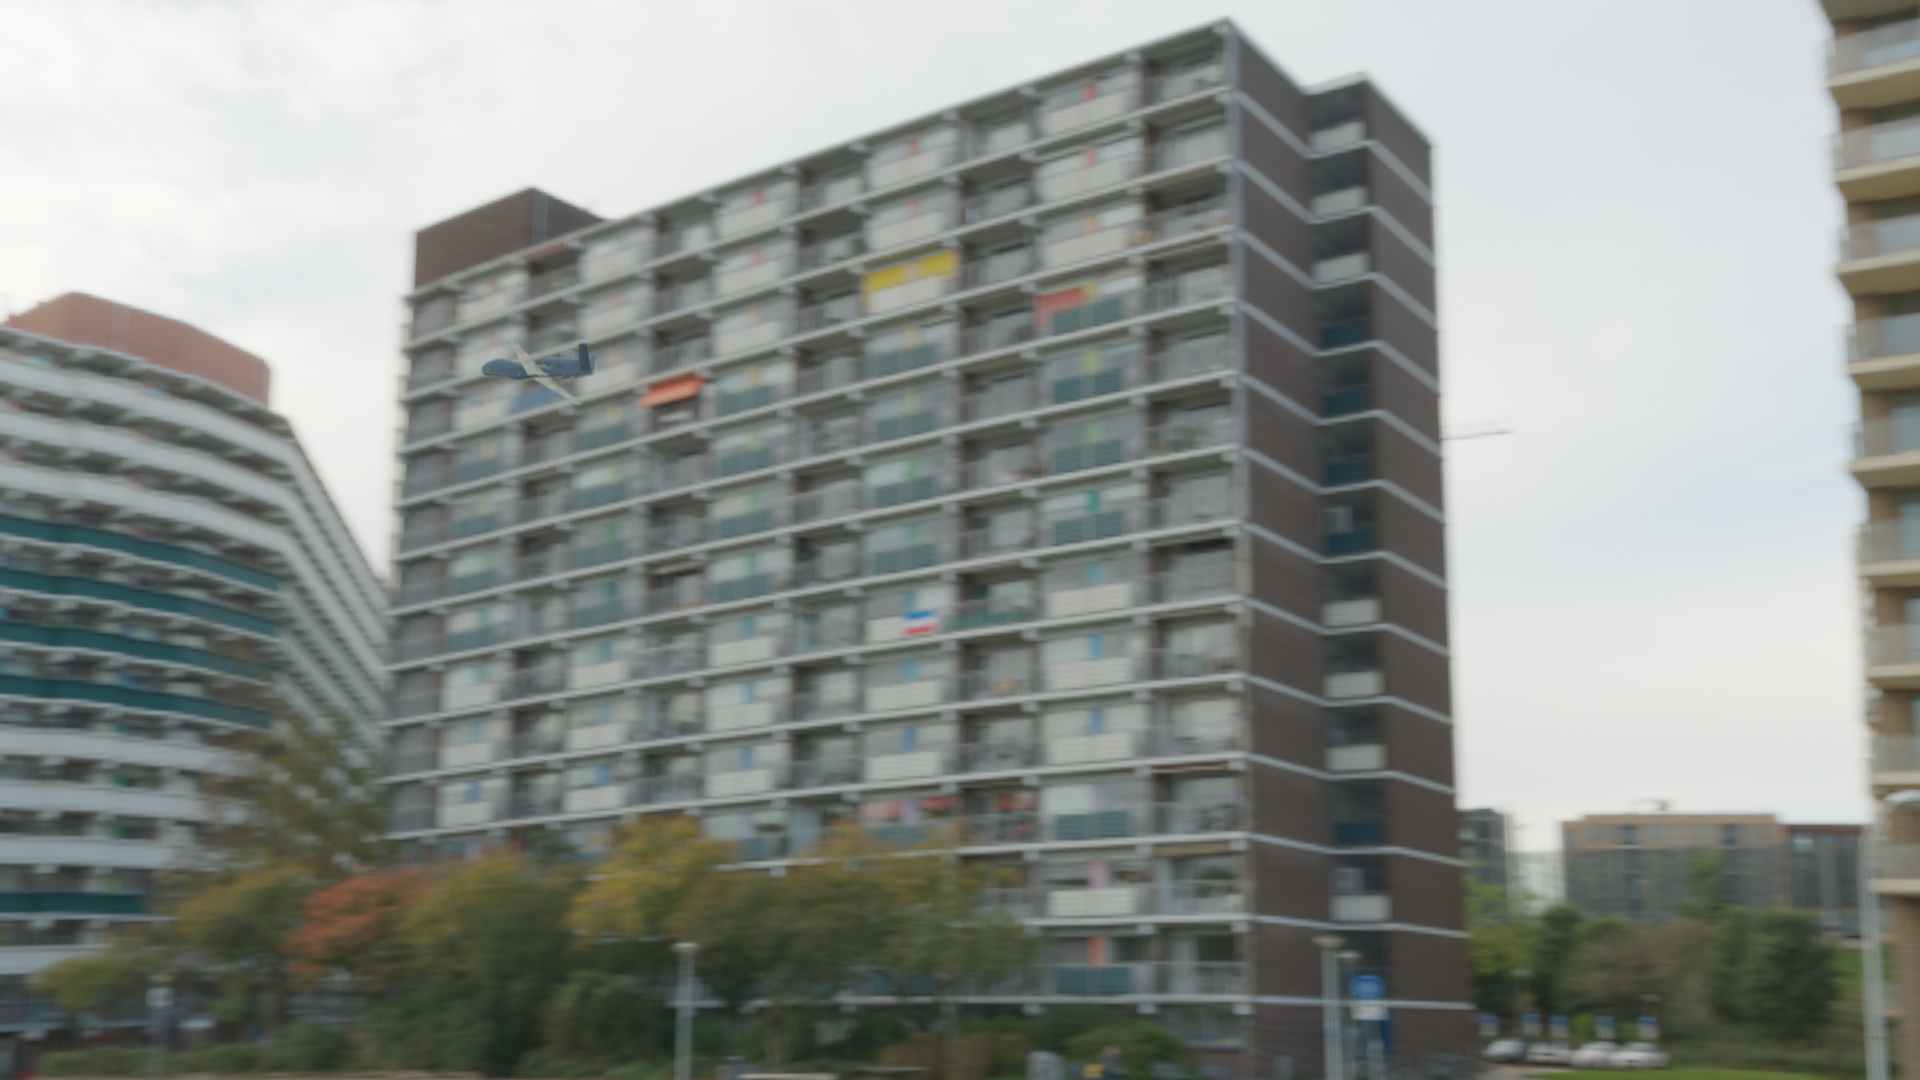
DataClinic uses density-based outlier detection to surface the dataset's "most canonical images" (high density) and "most anomalous images" (low density). Examining these samples makes the data quality issues immediately intuitive.
🟢 High Density — Canonical (Most Repeated) Samples
The most "average" images in the dataset — the ones with the most near-identical neighbours.
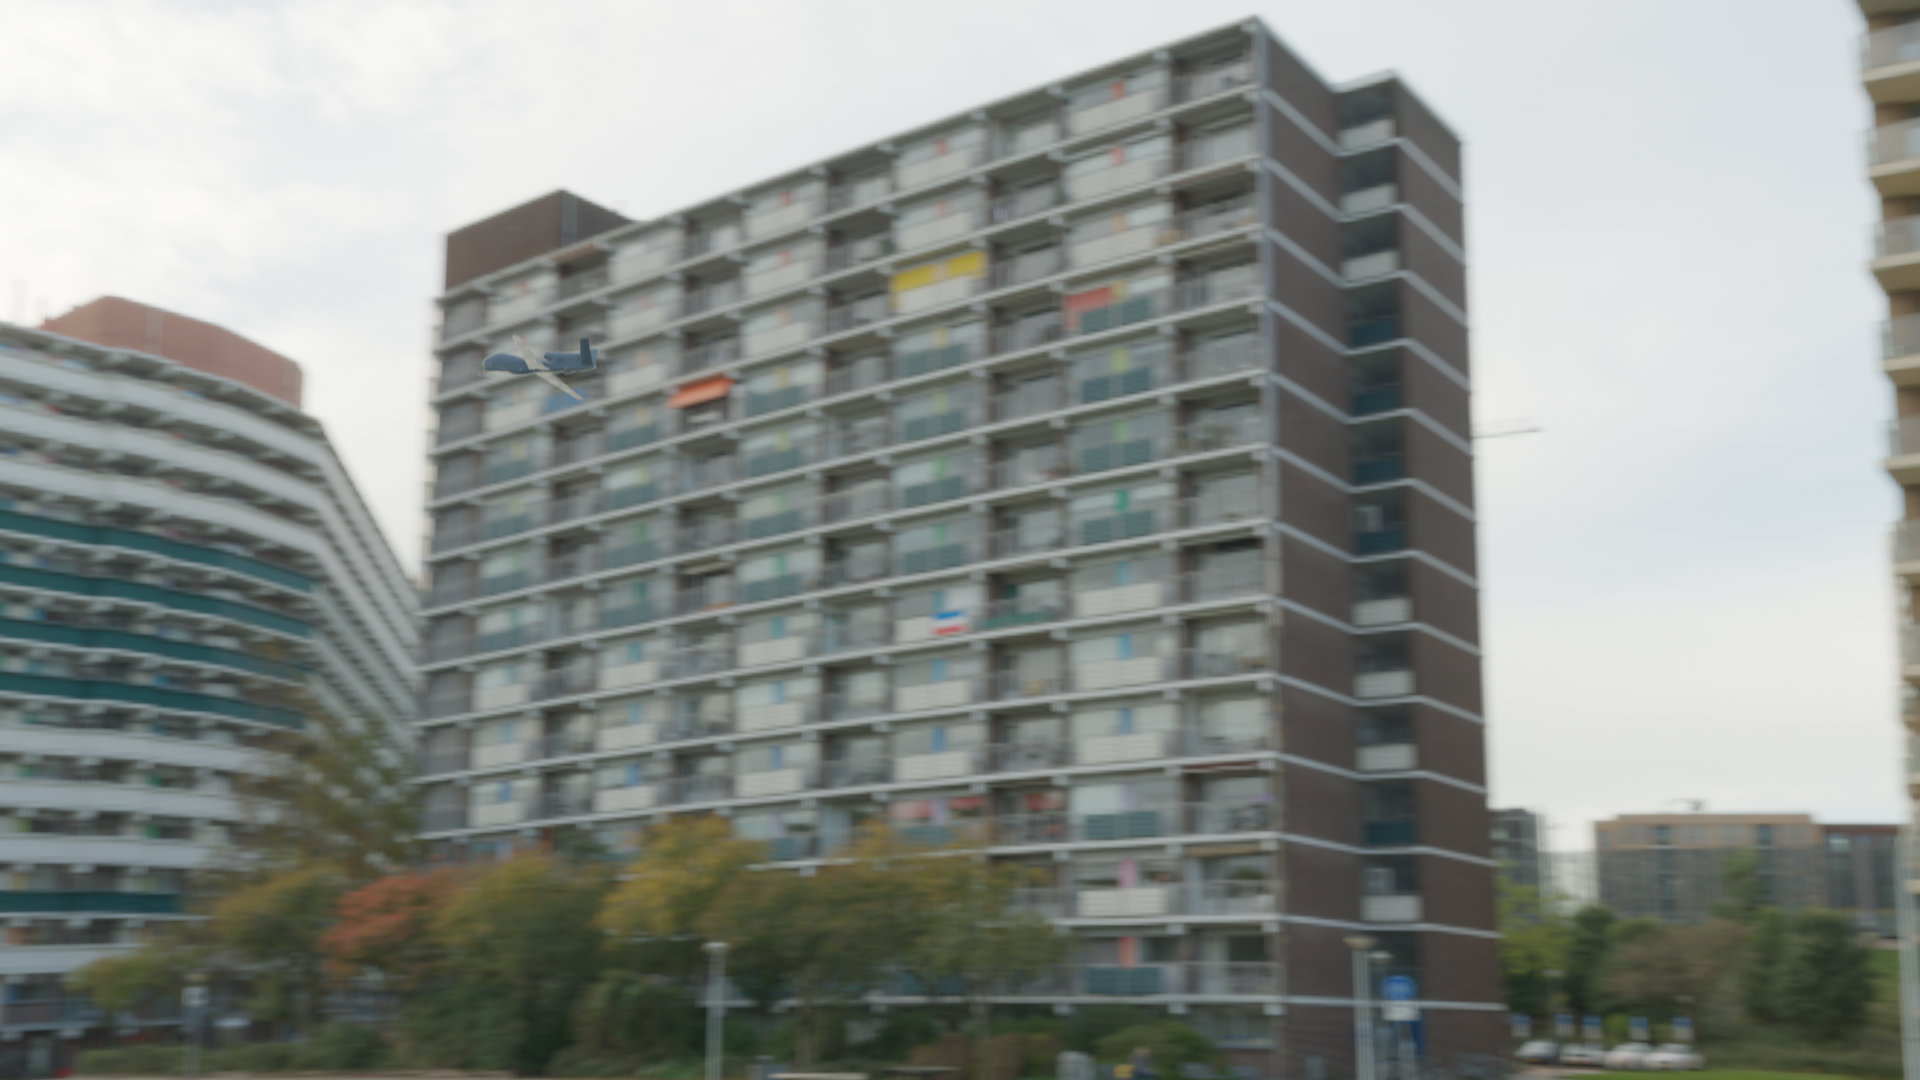
🔴 Low Density — Outlier (Most Rare) Samples
The most visually unique images in the dataset — cases that look markedly different from everything else.
High vs Low Density — What This Tells Us
The high-density samples from DR05, DR08, and DR11 being the most canonical means those classes are packed with near-identical images. The low-density outliers from DR02, DR06, and DR12, on the other hand, show distinctive backgrounds and angles — these images actually carry more meaningful diversity. A well-designed classification dataset should have far more images like the low-density samples, spread across all classes.
The 76-Point Paradox — Why Perfect Balance Still Scores Low
Every L1 check came back Good, and class balance is flawless. So why 76 (Fair)? The culprit is the Poor distribution ratings at both L2 and L3.
No AI bias
Extensive frame redundancy
and actual diversity is far smaller
"Balance is necessary; diversity is sufficient."
Even with perfect class balance, if the images within each class are too similar to one another, the model cannot learn effectively.
DR05 may have 2,399 images, but if 2,000 of them are nearly identical frames from the same flight sequence,
the effective training data is closer to 400 images. Showing a model the same drone shifted slightly 2,000 times teaches it nothing new.
The Real Risk for Classification Models
A classification model trained on data with heavy frame redundancy can exhibit high validation accuracy on the dataset but poor performance in real deployment — a classic overfitting pattern. In a Counter-UAS system, this is critical: the model may misclassify a DR05 drone it has never seen from a particular angle or under different lighting conditions, labelling it as a different type entirely.
Recommendation — Data Diet First
DataClinic recommends a single intervention for PBLS_Drone_classification: Data Diet. This is the exact opposite of #226's DataBulkup prescription — despite using the same underlying dataset, the classification framing calls for trimming rather than augmenting.
🥗 Data Diet — Removing Redundant Frames
Stride sampling within flight sequences
Sample every N frames from the flight sequence. At a stride of 10, 2,399 images compress to ~240 while preserving diversity.
Embedding-based deduplication
Use the L3 domain-specific lens embeddings to remove pairs above a cosine similarity threshold. Eliminates redundancy without losing information.
Background diversification (follow-on step)
After the Diet, generate additional images in night, adverse weather, mountainous, and maritime environments to counteract urban bias — simultaneously addressing the L2 multimodal distribution issue.
⚖️ #226 DataBulkup vs #227 DataDiet
Identical source data, opposite prescriptions — a striking result. For a detection model (#226), more diversity is needed (Bulkup). For a classification model (#227), removing redundancy comes first (Diet). The right data quality prescription depends entirely on which AI task the data is for.
📈 Expected Outcomes
Removing redundant frames increases intra-class diversity → L3 distribution improves → score expected to rise. More importantly, training efficiency improves (same performance with less data), and real-world generalization performance is expected to increase significantly.
Conclusion
PBLS_Drone_classification is a compelling demonstration of what synthetic data generation pipelines do well. Exactly 2,399 images per class across 12 drone types — a level of balance that is simply unachievable with real-world footage. 1920×1080 FHD, consistent RGB channels, zero missing values — all L1 checks pass with flying colours.
Yet DataClinic's L2 and L3 lenses uncovered the structural problem hiding beneath that surface. Under the general-purpose lens and the domain-specific lens alike, the data fractures into three clusters and refuses to coalesce. Insufficient intra-class diversity and repeated consecutive video frames — the paradox of data rich in count but poor in information.
Same data. Different lens. Different prescription.
DataBulkup for detection; DataDiet for classification.
The value of data quality diagnosis starts with asking "what is this data for?"