Executive Summary
This article is based on the analysis results of DataClinic Report #226. PBLS_Drone is a defense-specialized synthetic image dataset built in-house by Pebblous to optimize drone object recognition AI models. Comprising 28,801 images and 52GB of single-class drone data, it achieved a DataClinic overall score of 87 (Good). A significant improvement over the previously diagnosed PBLS_Military (68), this time Data Bulk-up instead of Data Diet is recommended.
PBLS_Drone vs PBLS_Military — Two Defense Datasets Compared
Key difference: PBLS_Drone has no class balance issues as a single-class dataset, and its high image diversity earned it a higher score.
DataClinic Grade Summary
Why Drone AI? — Threats in the Sky and Defense
The 2022 Ukraine war proved to the world that drones have become a game changer on the modern battlefield. From low-cost commercial drones to precision-strike loitering munitions, drones have infiltrated virtually every operational domain including reconnaissance, strike, supply, and electronic warfare.
Counter-UAS technologies are evolving rapidly in response. Among various countermeasures such as radar, jamming, lasers, and interceptor drones, AI-based drone detection & classification serves as the critical "eyes" of every defense system. For AI to recognize drones quickly and accurately, rich and diverse training data is essential.
Counter-UAS Core Tech
AI that detects, classifies, and tracks enemy drones — the brain of defense systems
Limits of Real Photography
Capturing diverse drones at various altitudes, distances, and lighting is prohibitively expensive
Synthetic Data Solution
CG generates infinite drone scenarios, angles, environments, and distances — AI training without real footage
Drone Simulation Blueprint in the Filename
Each PBLS_Drone filename systematically encodes which drone model was captured at which frame.
12 different drone types
Flight path and angle order
12 drone types × ~2,400 frames = ~28,800 systematic synthetic drone images. Each drone is continuously captured along simulation flight paths at various angles and backgrounds.
Dataset Overview — PBLS_Drone
PBLS_Drone is a defense-specialized synthetic drone image dataset built in-house by Korean AI company Pebblous. Designed with environmental and transportation applications in mind, this dataset is optimized for image classification and image processing tasks. All images are in 1920×1080 (Full HD) high-resolution RGB format, designed with real-world deployment of drone object recognition models in mind.
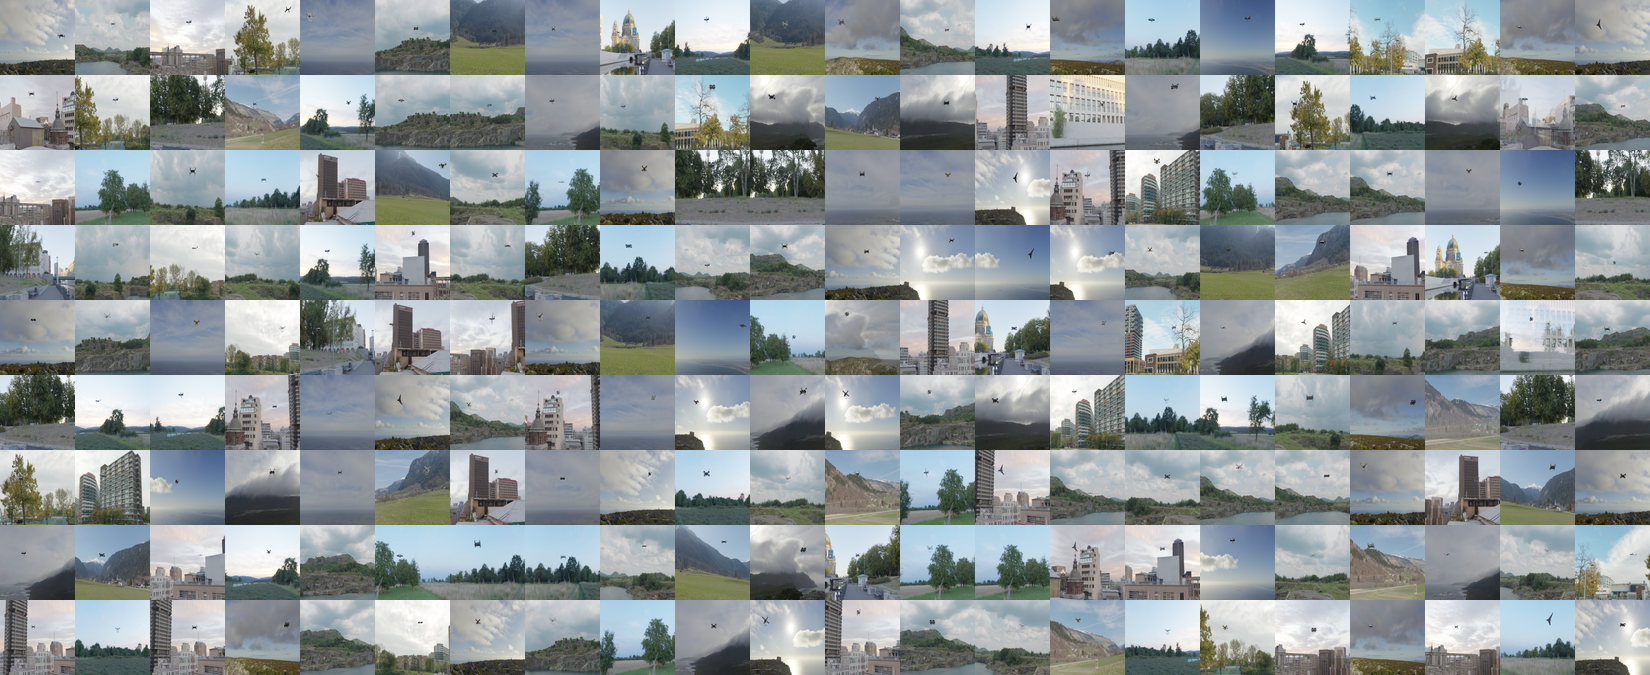
PBLS_Drone — Synthetic drone image collage (DataClinic L1 analysis)

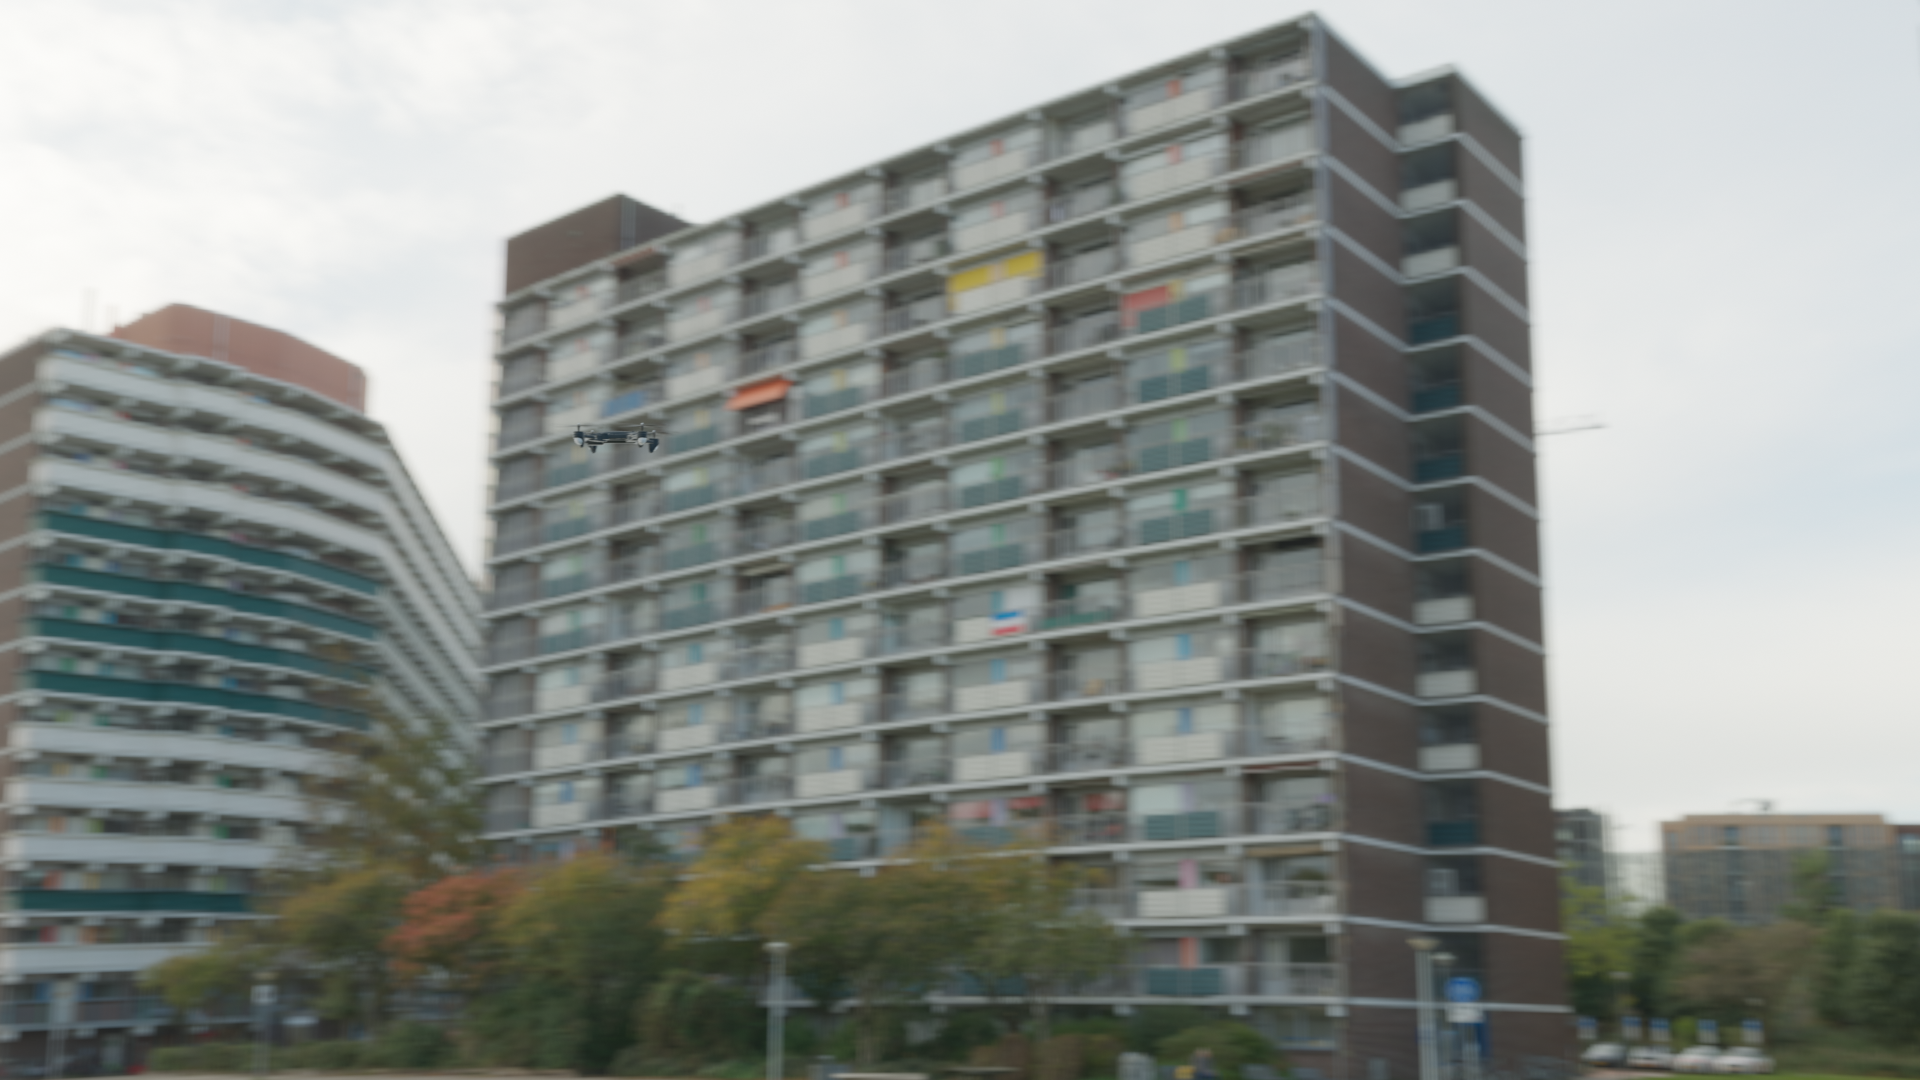
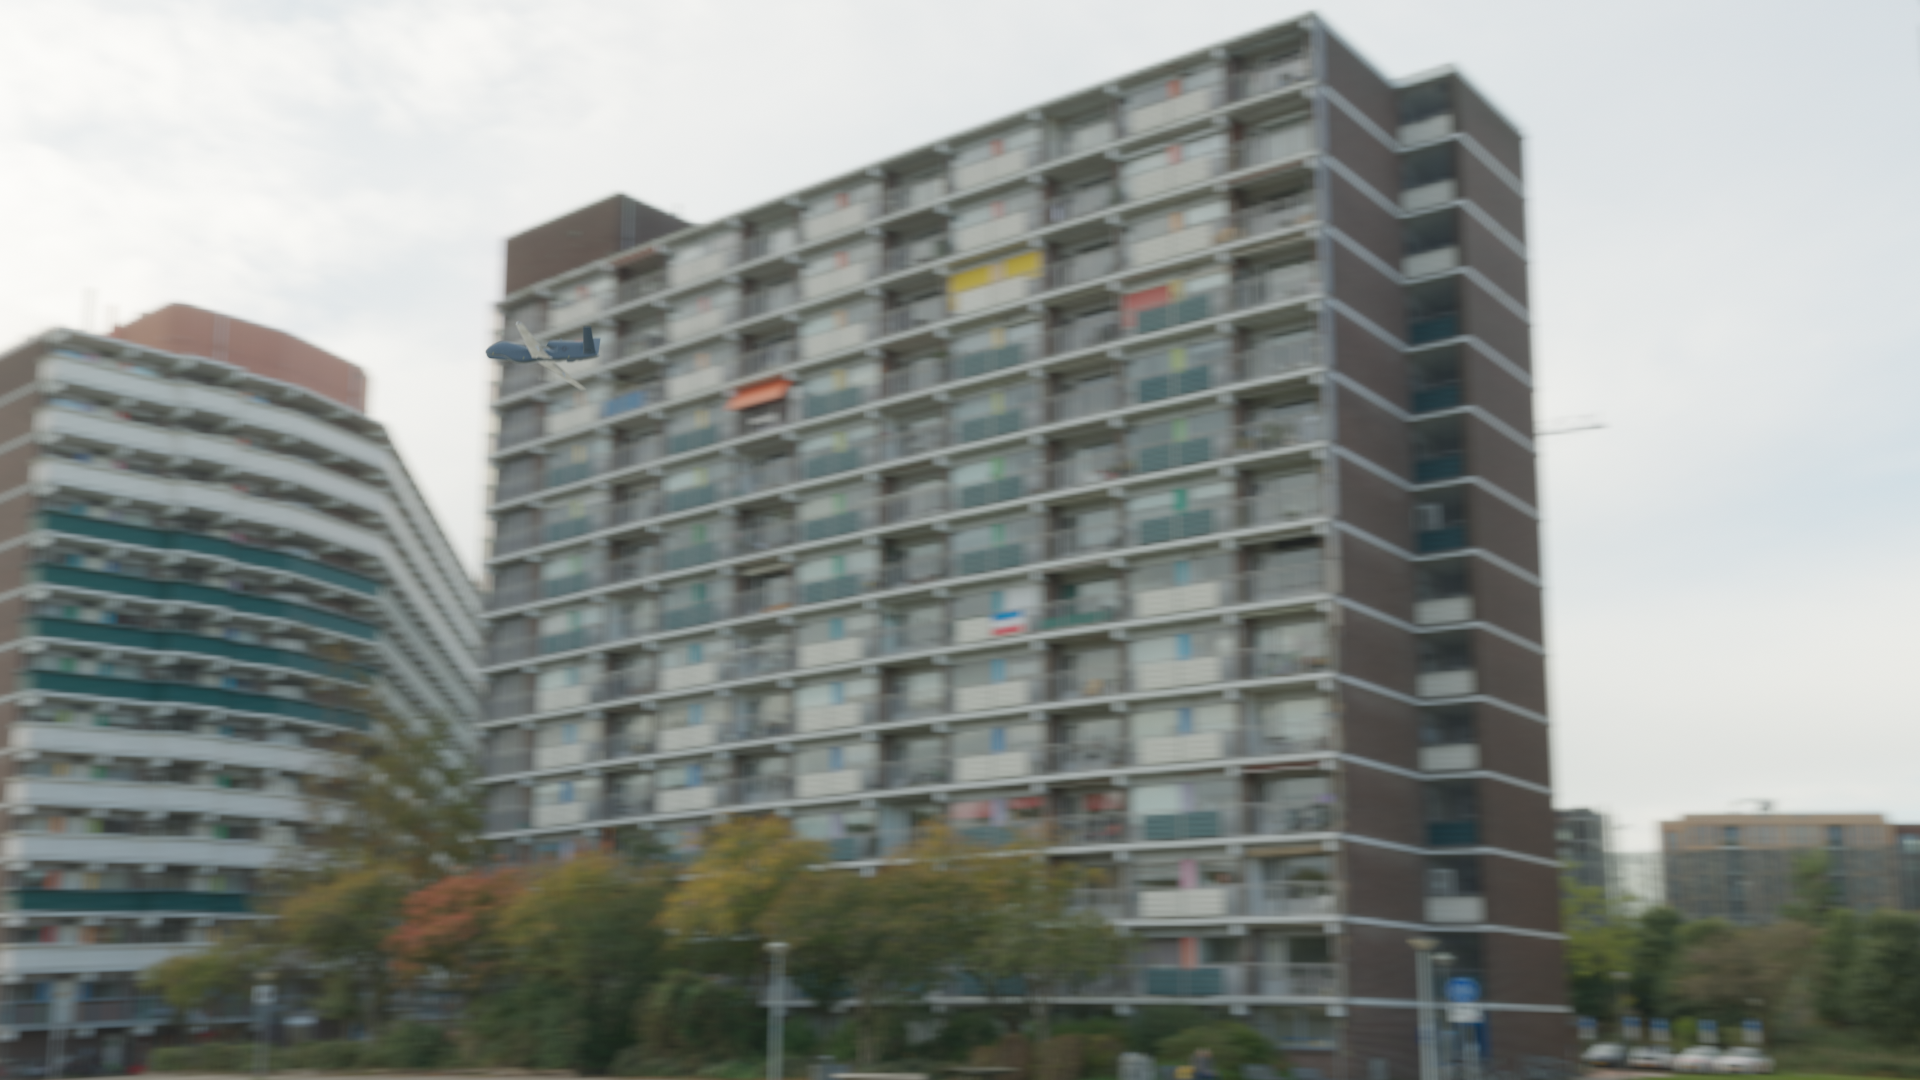
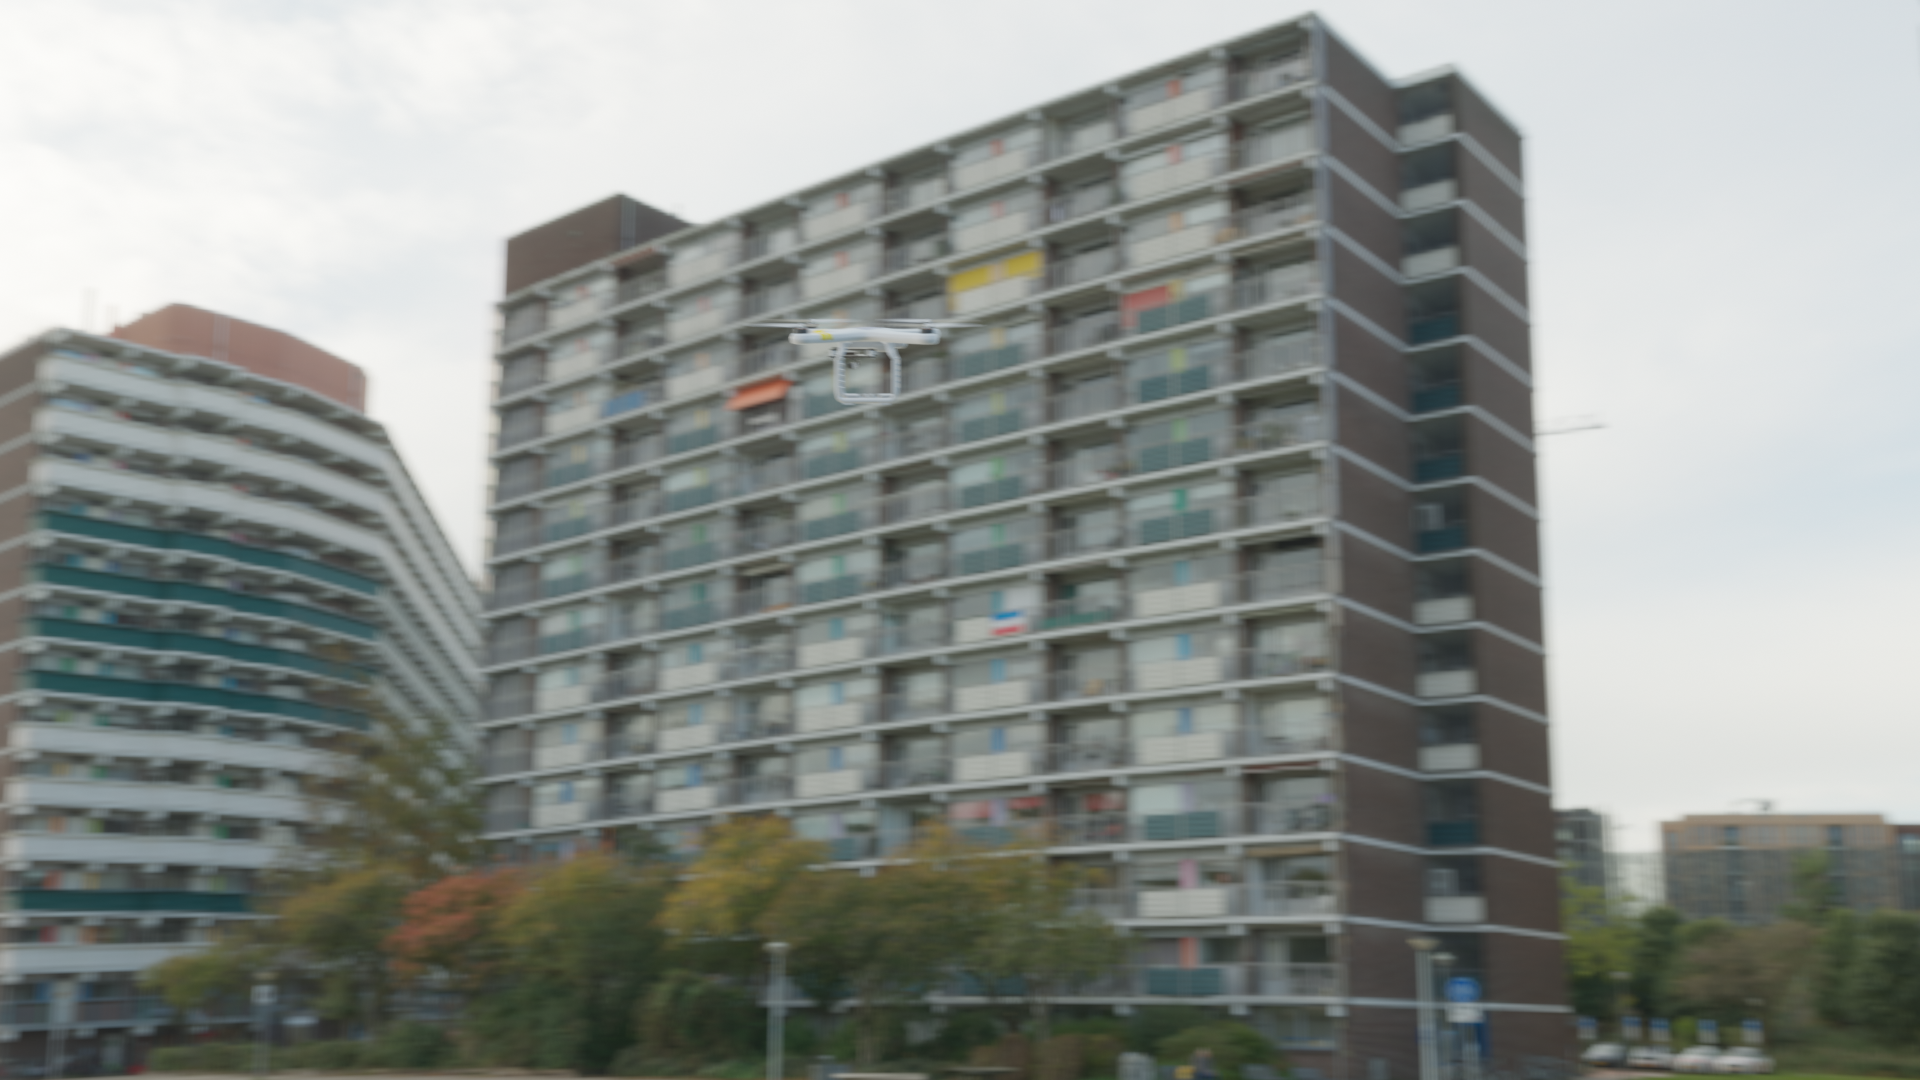
▲ PBLS_Drone high-density representative sample — DR08 drone model (density 0.677, highest in dataset at L2)
📊 Dataset Specifications
- 🖼️ 28,801 images (28,800 used for diagnosis)
- 📦 52GB (52,646MB)
- 📐 1920×1080px — Full HD, fixed size
- 🎨 RGB channels — consistent throughout
- 🏷️ Single class — "drone" (12 models within class)
- 📅 2026.03.12 diagnosis completed
🎯 Application Areas
- 🛡️ Counter-UAS AI model training
- 🔍 Drone detection & classification algorithm development
- 📡 Radar/EO-IR sensor fusion AI research
- 🌐 Environmental & transportation drone monitoring
- 🧪 Benchmark dataset for model evaluation
⚠️ Not Available for Commercial Use
The PBLS_Drone dataset was developed for defense-specific purposes and commercial use is not permitted. It is available only for non-commercial purposes such as research, education, and defense AI development.
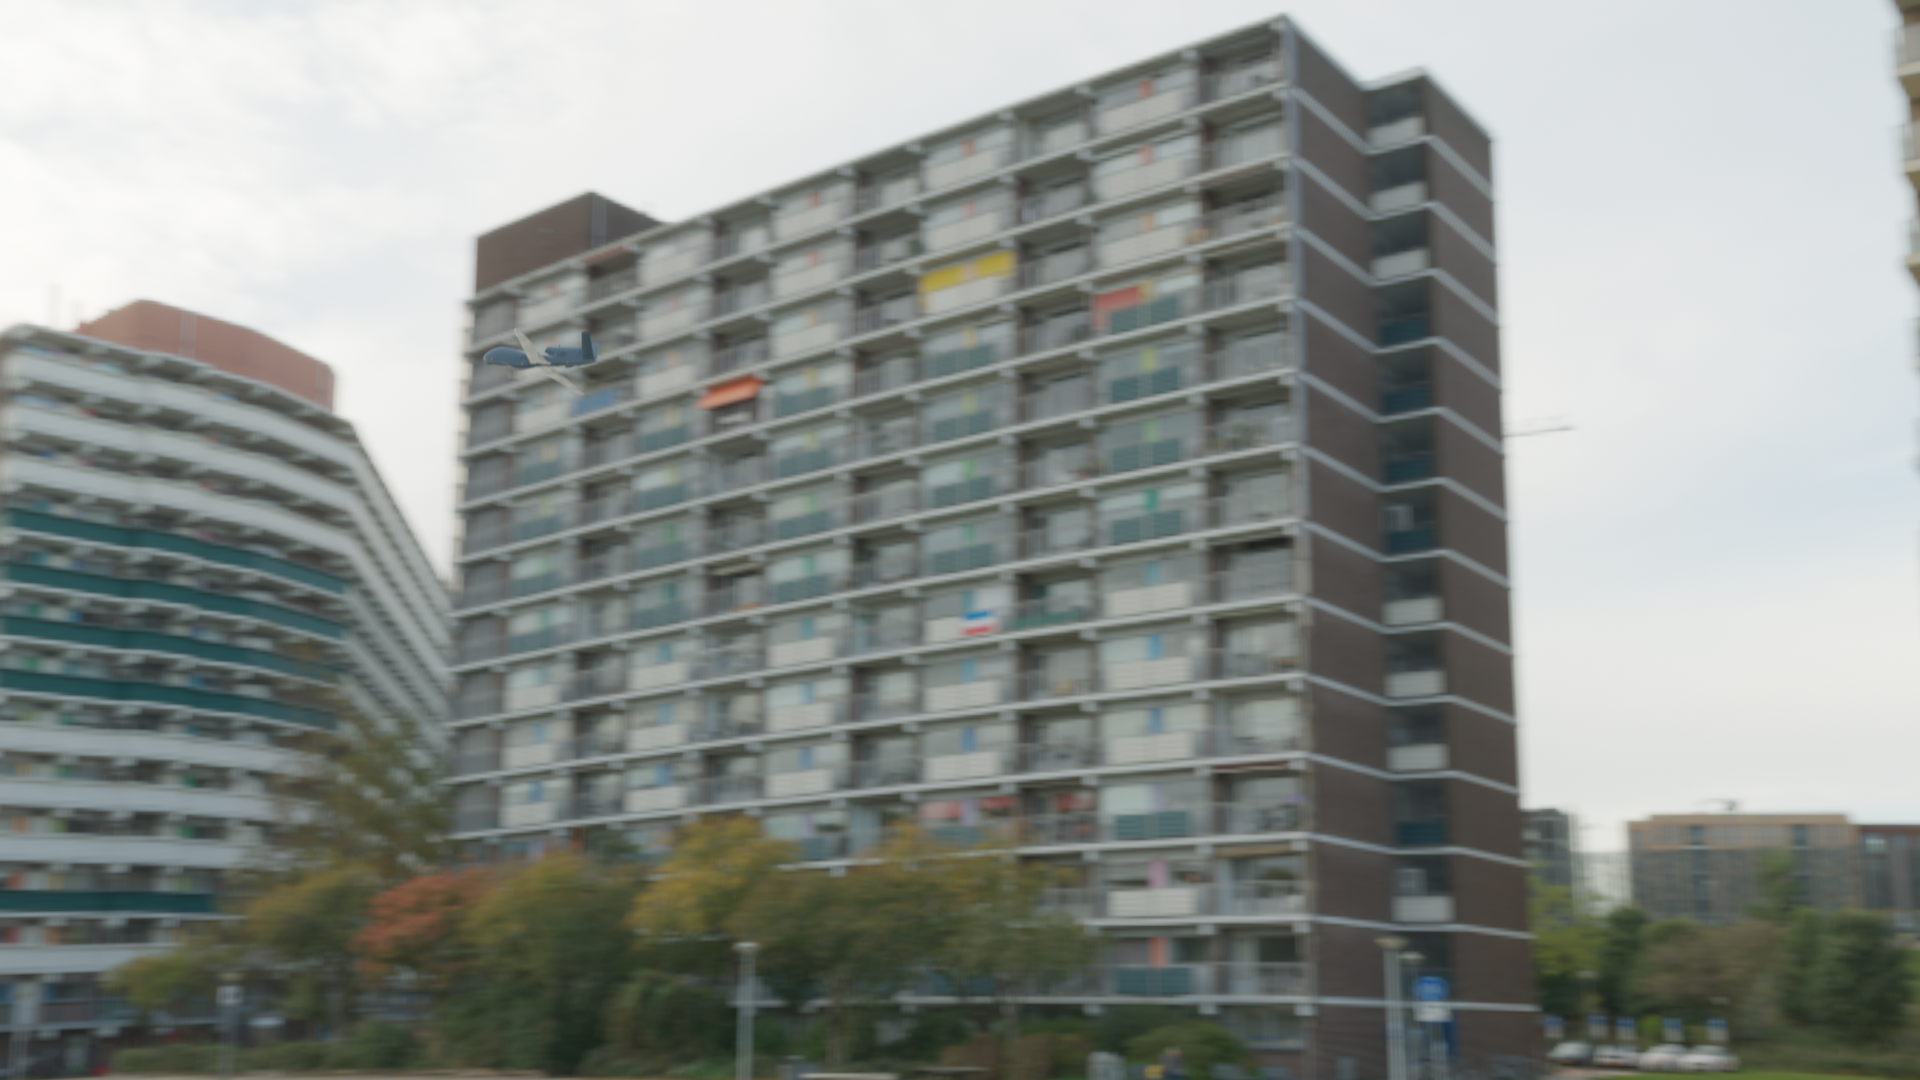
12 Drone Gallery — What AI Needs to Recognize
While PBLS_Drone is a single class ("drone"), it internally contains 12 different drone models from DR01 to DR12. Each model differs in form (quadcopter, fixed-wing, hybrid), size, and purpose (reconnaissance, strike, loitering munition, swarm). This diversity is why 3 clusters form at Level 2 despite being a single class.
Single-class dataset strategy: For binary classification ("drone or not") or object detection (localizing drones) model training, single-class data is efficient. By grouping diverse drone forms into one class, it guides AI to learn the "essential characteristics of drones."
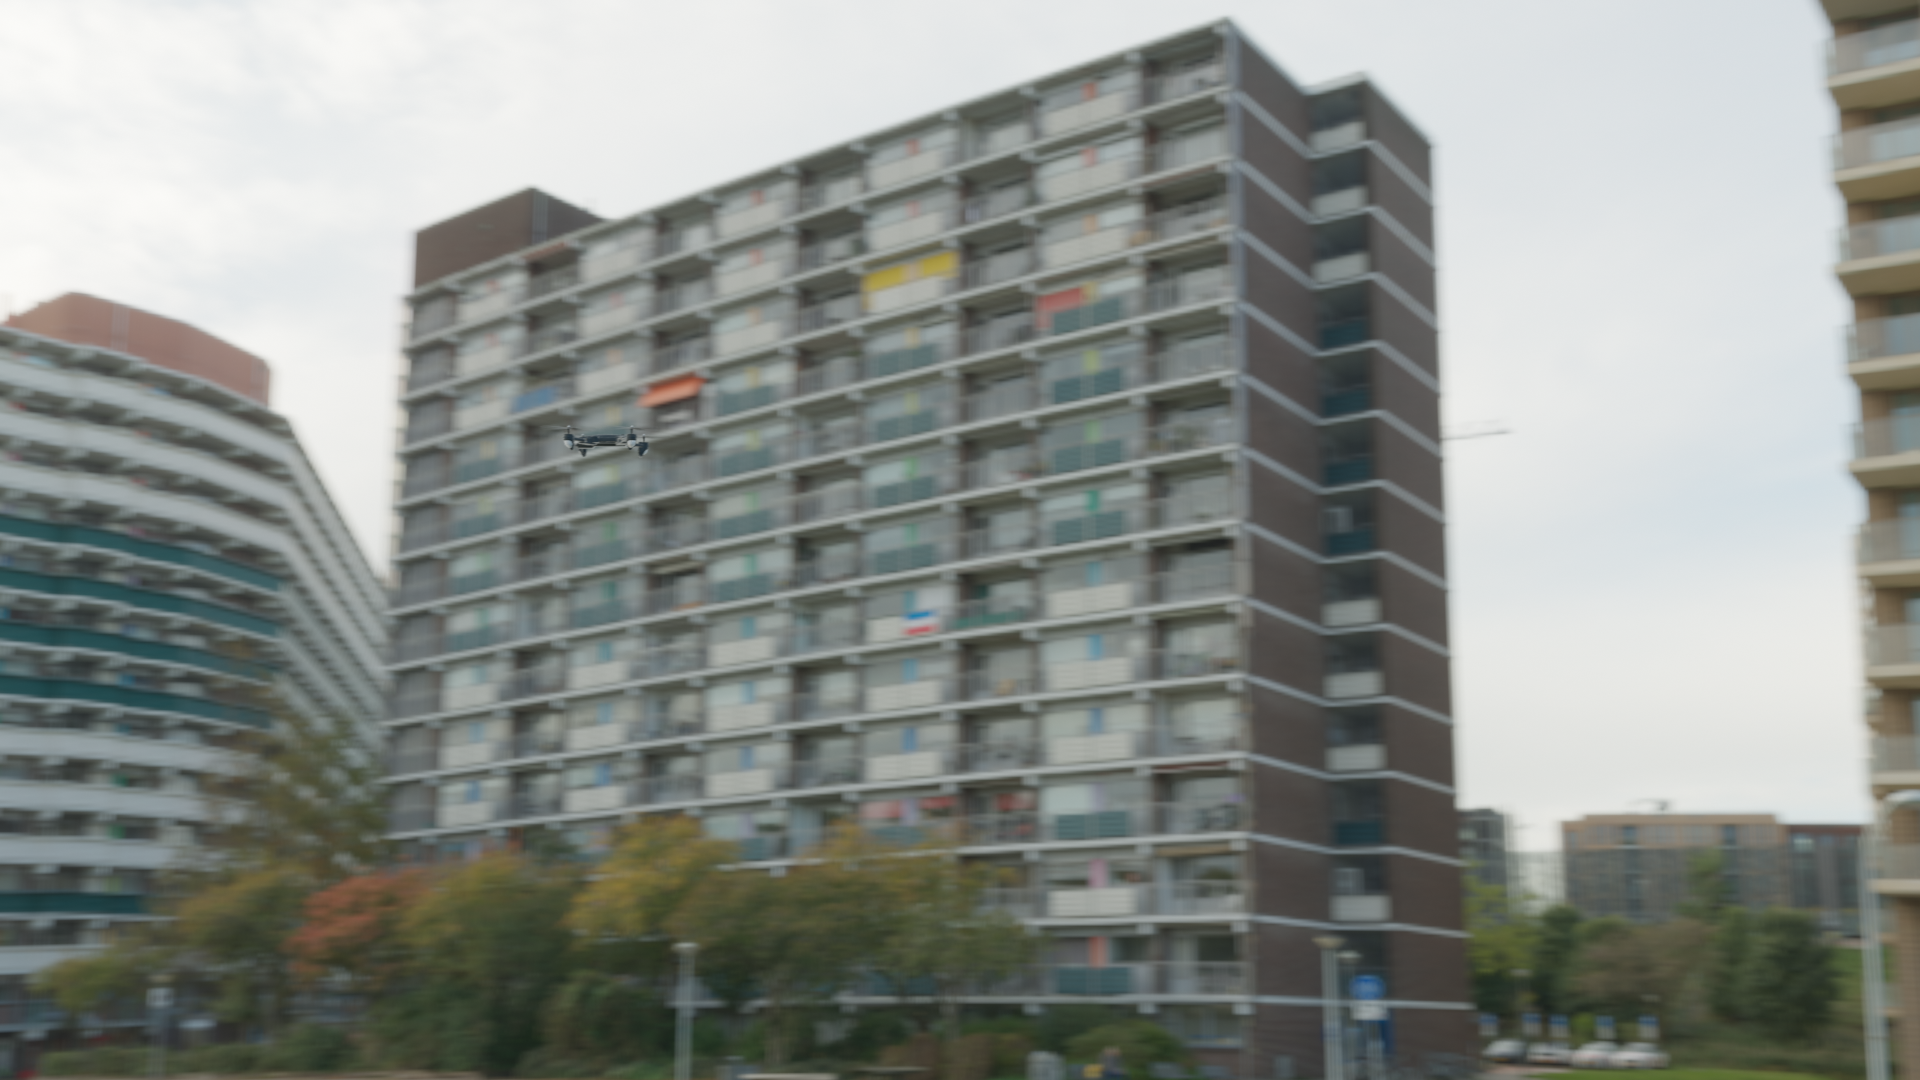
🔷 Multi-Rotor Reconnaissance & Surveillance Drones
Quadcopter and hexacopter reconnaissance drones. Specialized in low-altitude surveillance and battlefield intelligence gathering, their similarity to commercial drones creates high risk of AI misidentification.

Small multi-rotor reconnaissance drone. Utilized for covert reconnaissance thanks to its low RCS (Radar Cross Section) and quiet flight characteristics. Records medium density at DataClinic L3 with stable distribution.

Medium multi-rotor surveillance drone. Equipped with optical and thermal cameras, specialized for persistent surveillance missions. DataClinic shows many low-density outliers, indicating unusual flight attitudes or special environment scenes.
Tactical reconnaissance drone designed for rapid deployment and recovery, operated at platoon level. Forms the core of high-density clusters at L3, representing typical drone images.
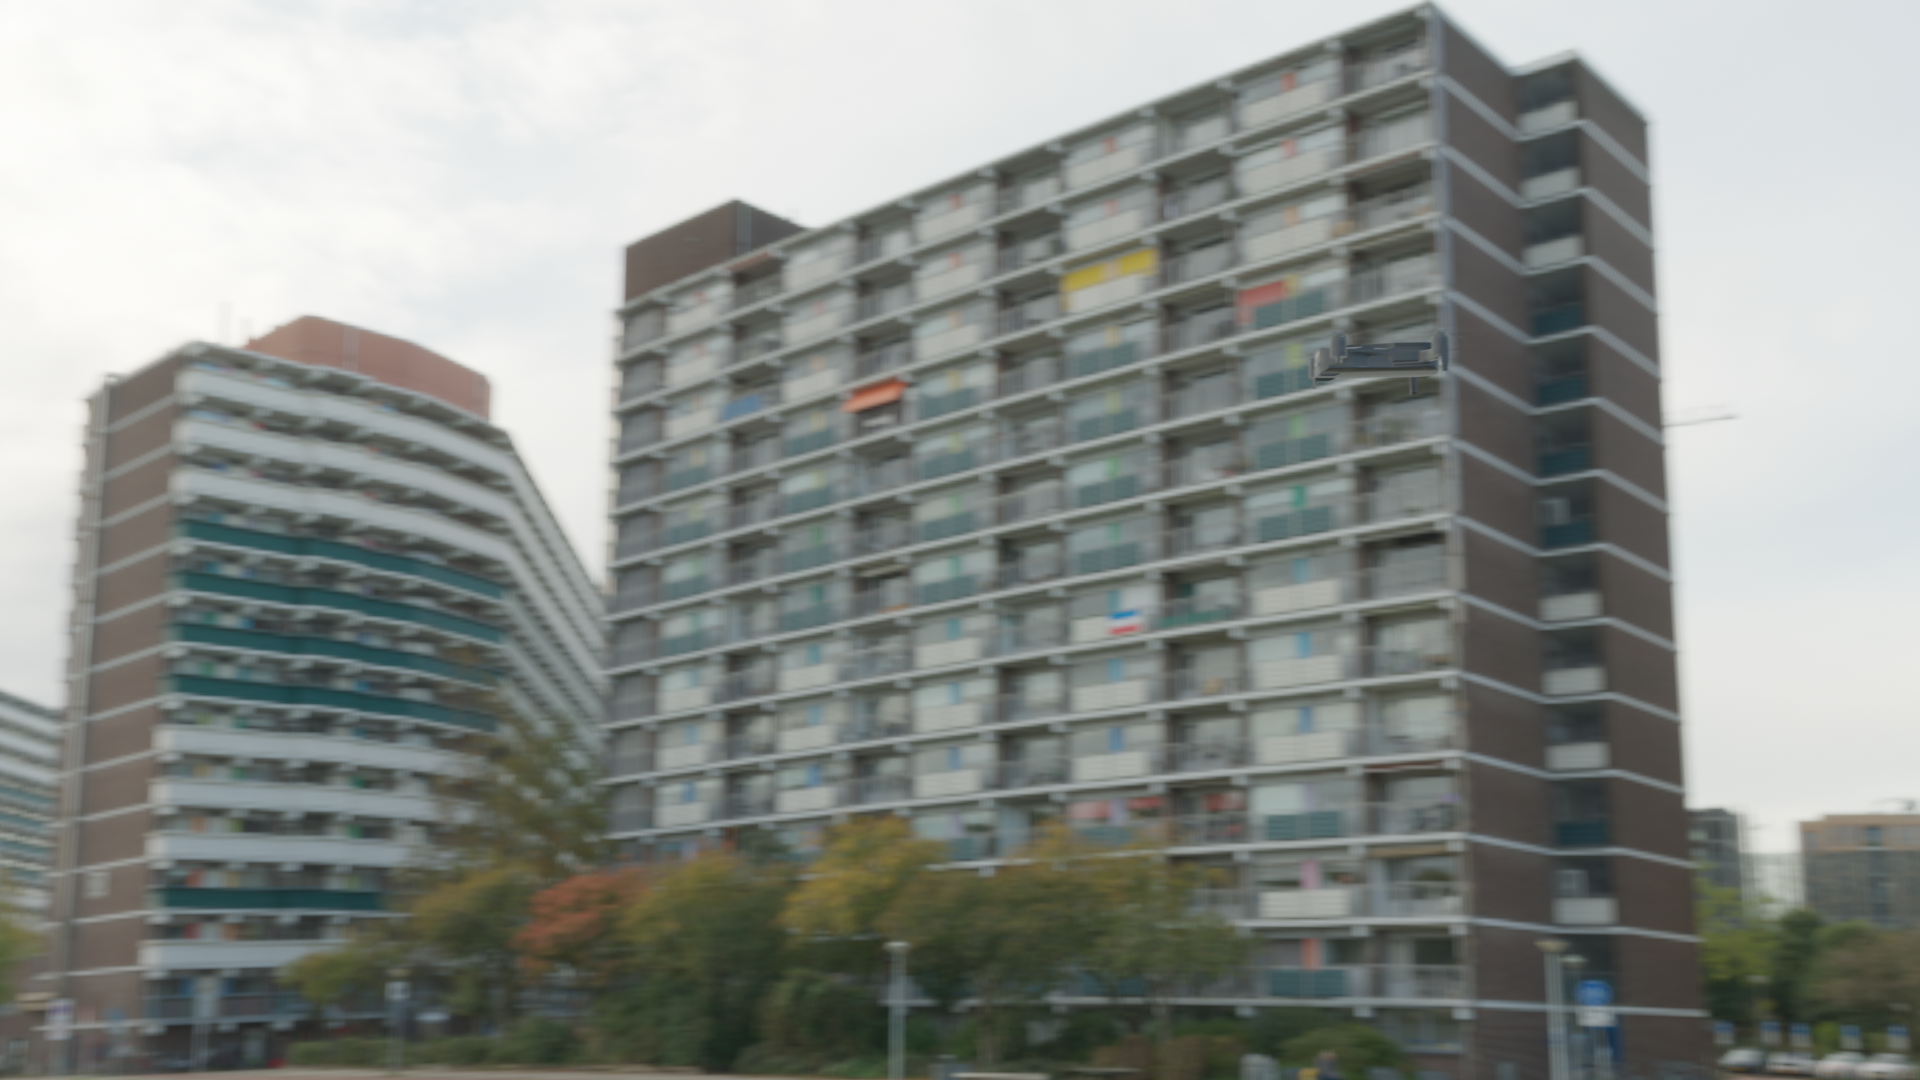
🔴 Attack & Loitering Munition Drones
Loitering munitions are next-generation weapons that loiter above targets before striking. AI recognition of these weapon systems, like the Iranian Shahed-136 that caused massive damage in the Ukraine war, is a top priority for Counter-UAS systems.

Attack drone capable of explosive delivery or direct strike. Hexacopter-based reinforced frame with high payload capacity. Ranks in the high-density top tier at L3 with stable characteristics.
A loitering munition that circles above targets waiting for strike opportunities. VTOL form combining small fixed-wing and multi-rotor, records highest density in DataClinic.

Military drone with medium-range strike capability. Designed to balance range and payload, deployed for striking high-value targets behind enemy lines.
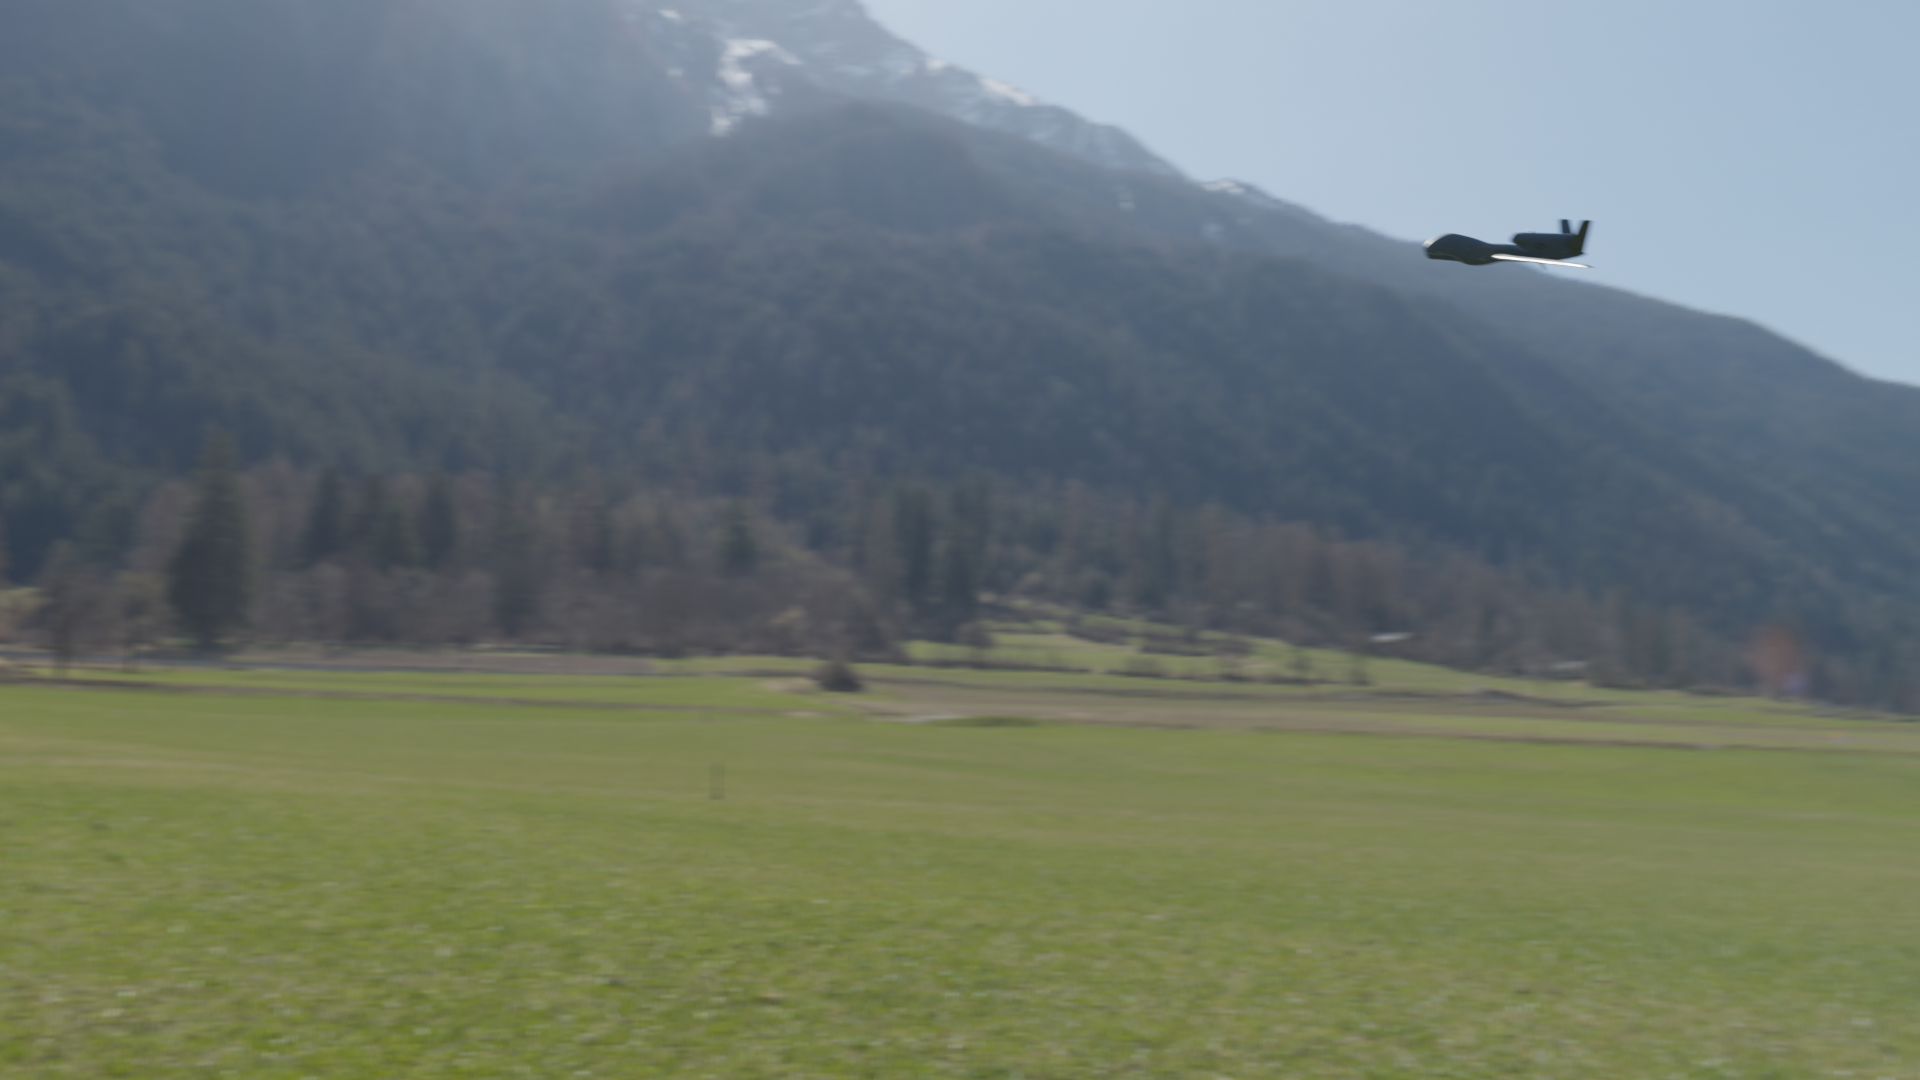
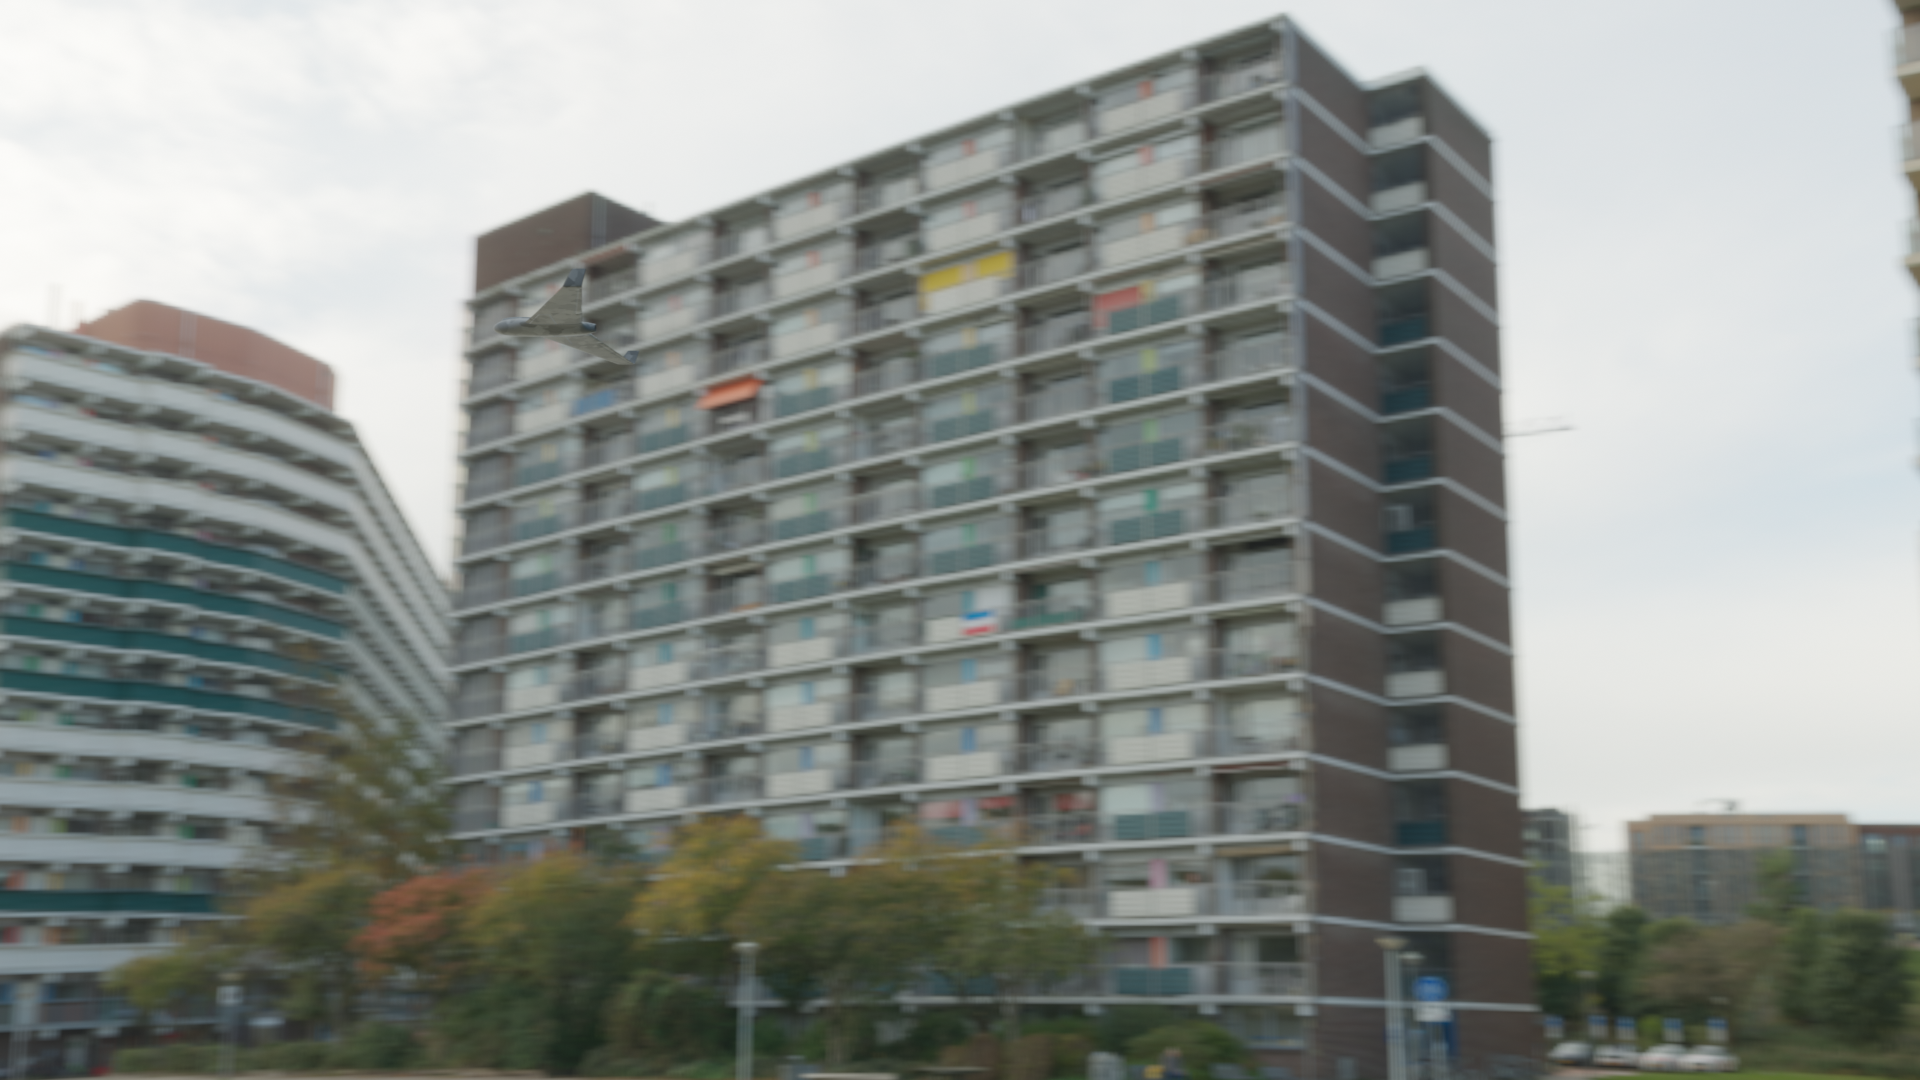
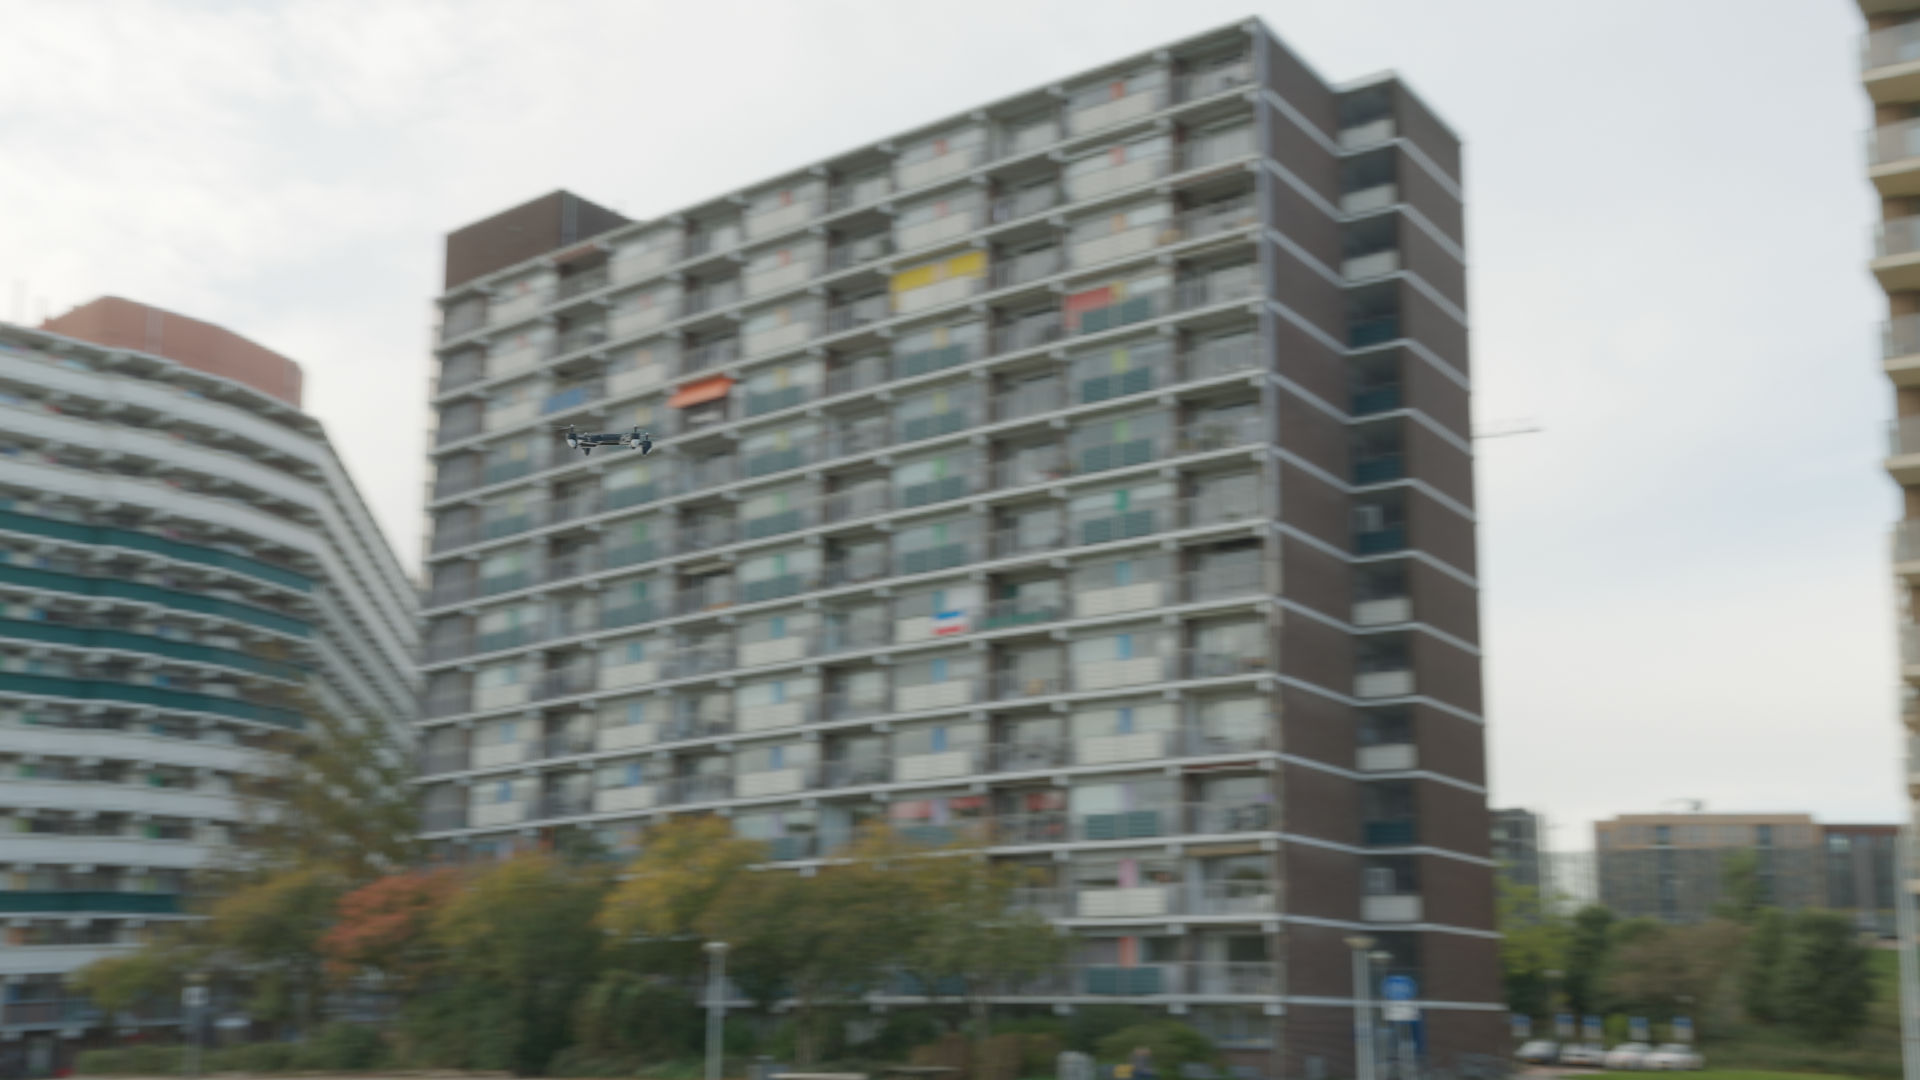
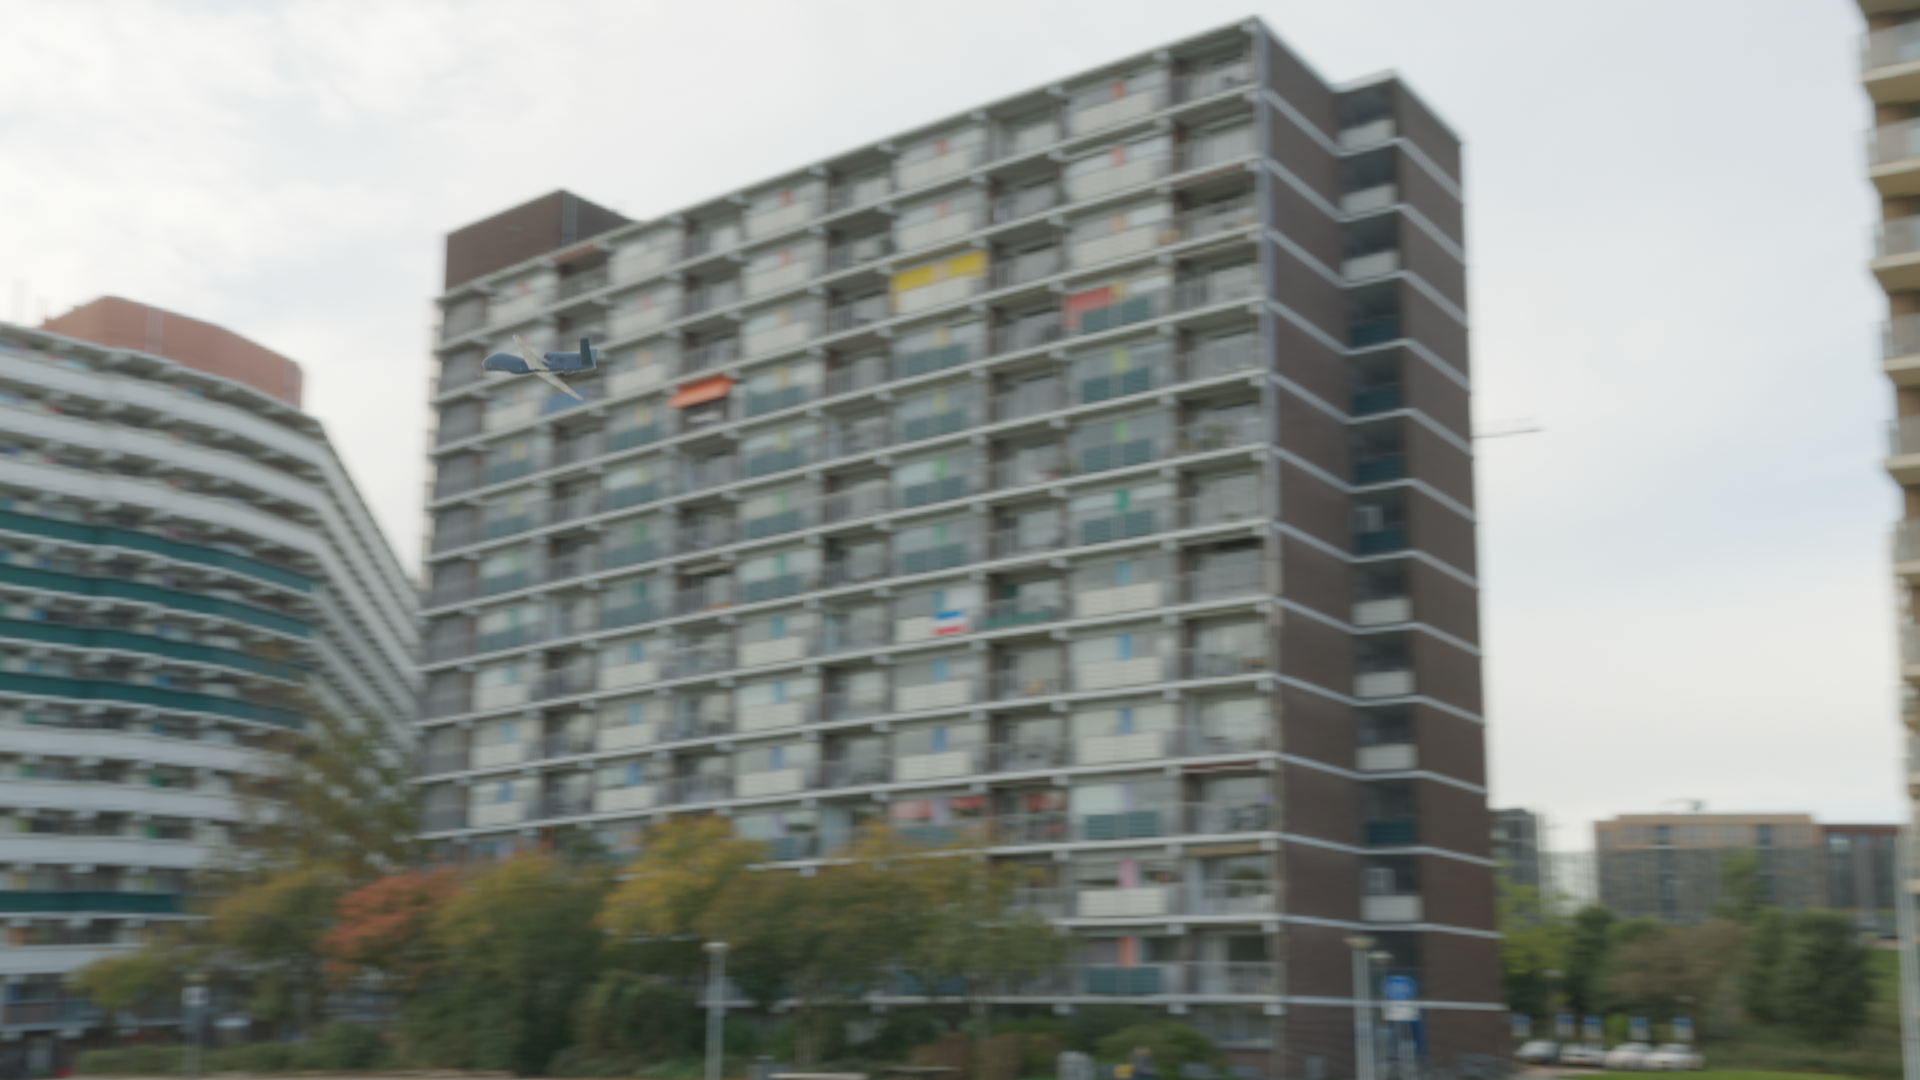
🔵 Fixed-Wing & VTOL Drones

Small fixed-wing UAV specialized for long-range reconnaissance. Glider-type wings provide high soaring efficiency and quiet operation. Its form differs greatly from multi-rotors, requiring special handling in AI recognition algorithms.
High-performance drone combining vertical takeoff/landing (VTOL) and fixed-wing flight. Records the highest density across the entire dataset at both DataClinic L2 and L3 — recognized by AI as the most "typical drone."

Medium fixed-wing UAV capable of tactical reconnaissance and strike. Turbofan-powered for extended loiter time, equipped with autonomous flight path planning.
🟣 Swarm & Special-Purpose Drones
Standardized small drone for swarm attack operations. Dozens to hundreds operate simultaneously to saturate air defense systems. Shows numerous low-density outliers in AI recognition.

Electronic warfare (EW) and communications jamming specialized drone. Large antenna arrays and electronic equipment give it distinctive visual characteristics. Included in the high-density group at L3.
Large strategic-class UAV. A high-performance platform specialized for long-range strike and wide-area reconnaissance. Most frequently appearing model in DataClinic's low-density outlier list — diverse flight attitudes are classified as unusual samples.
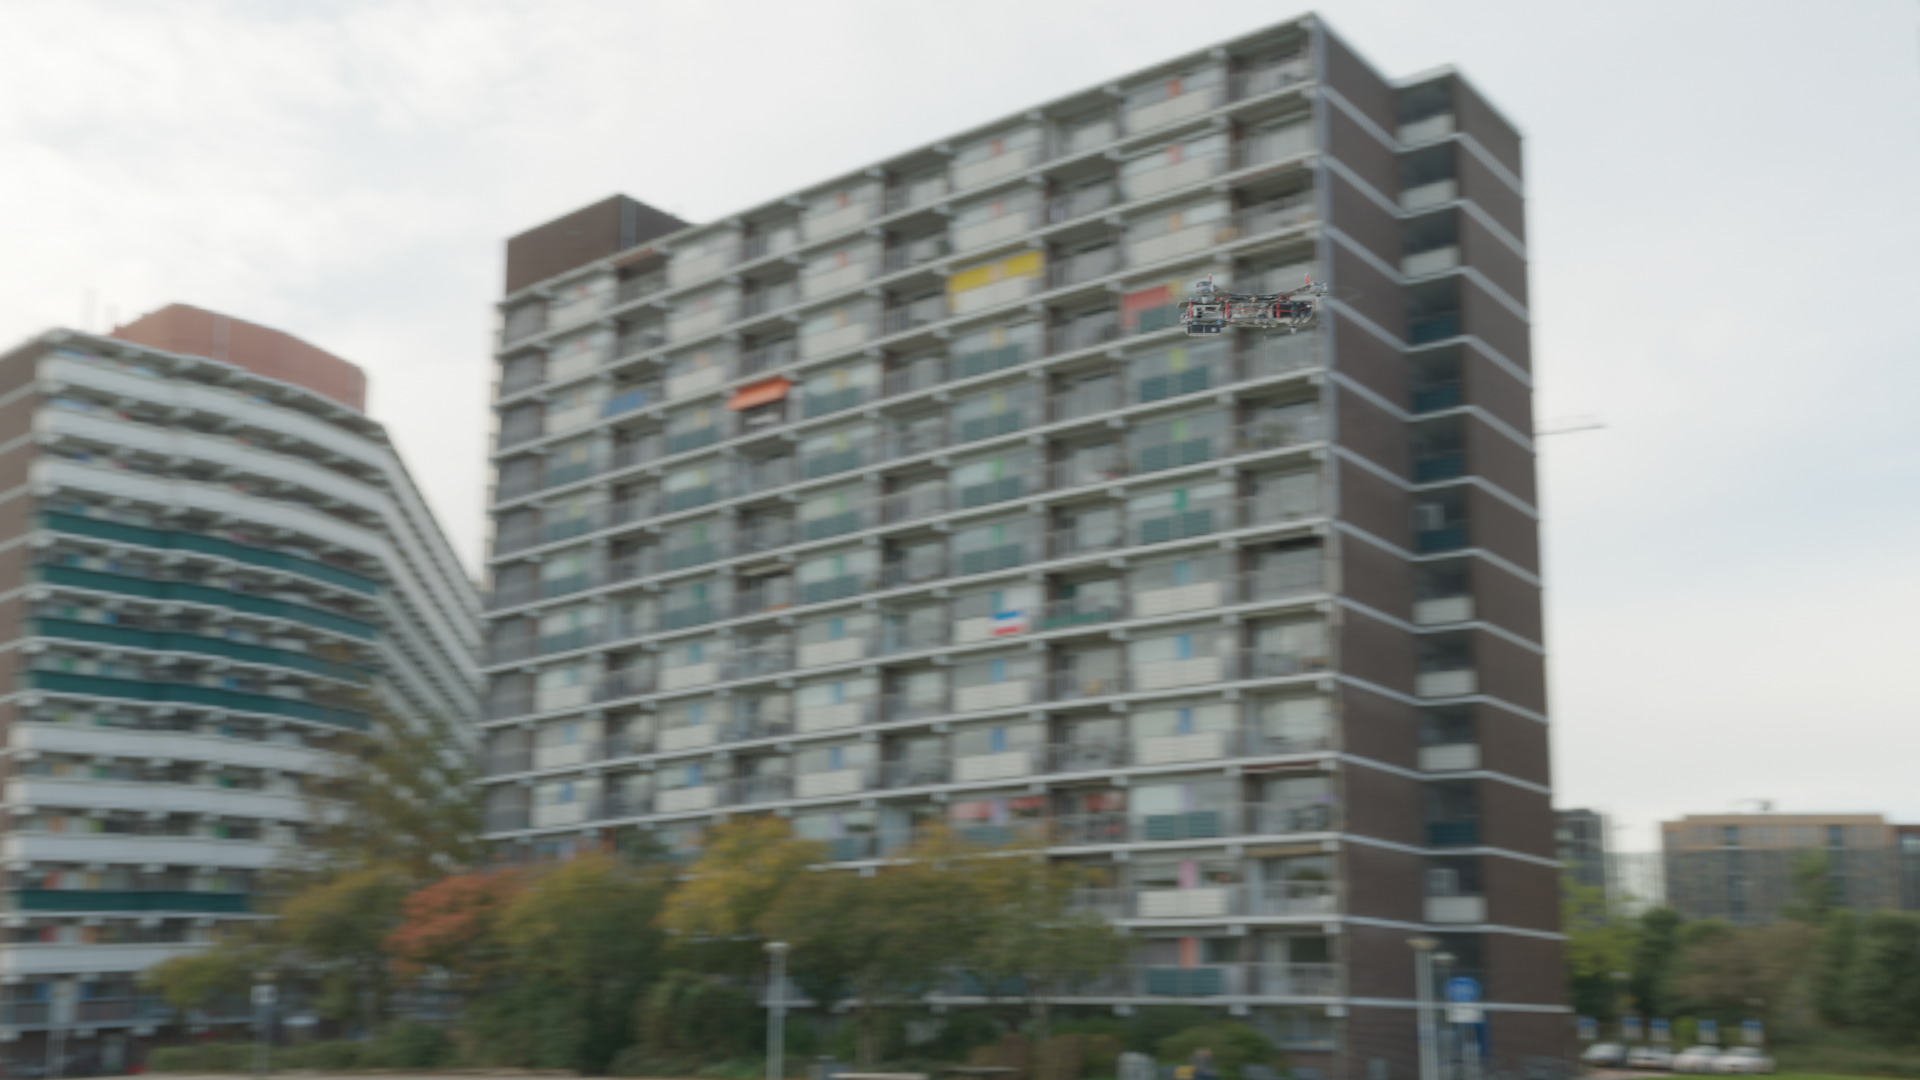
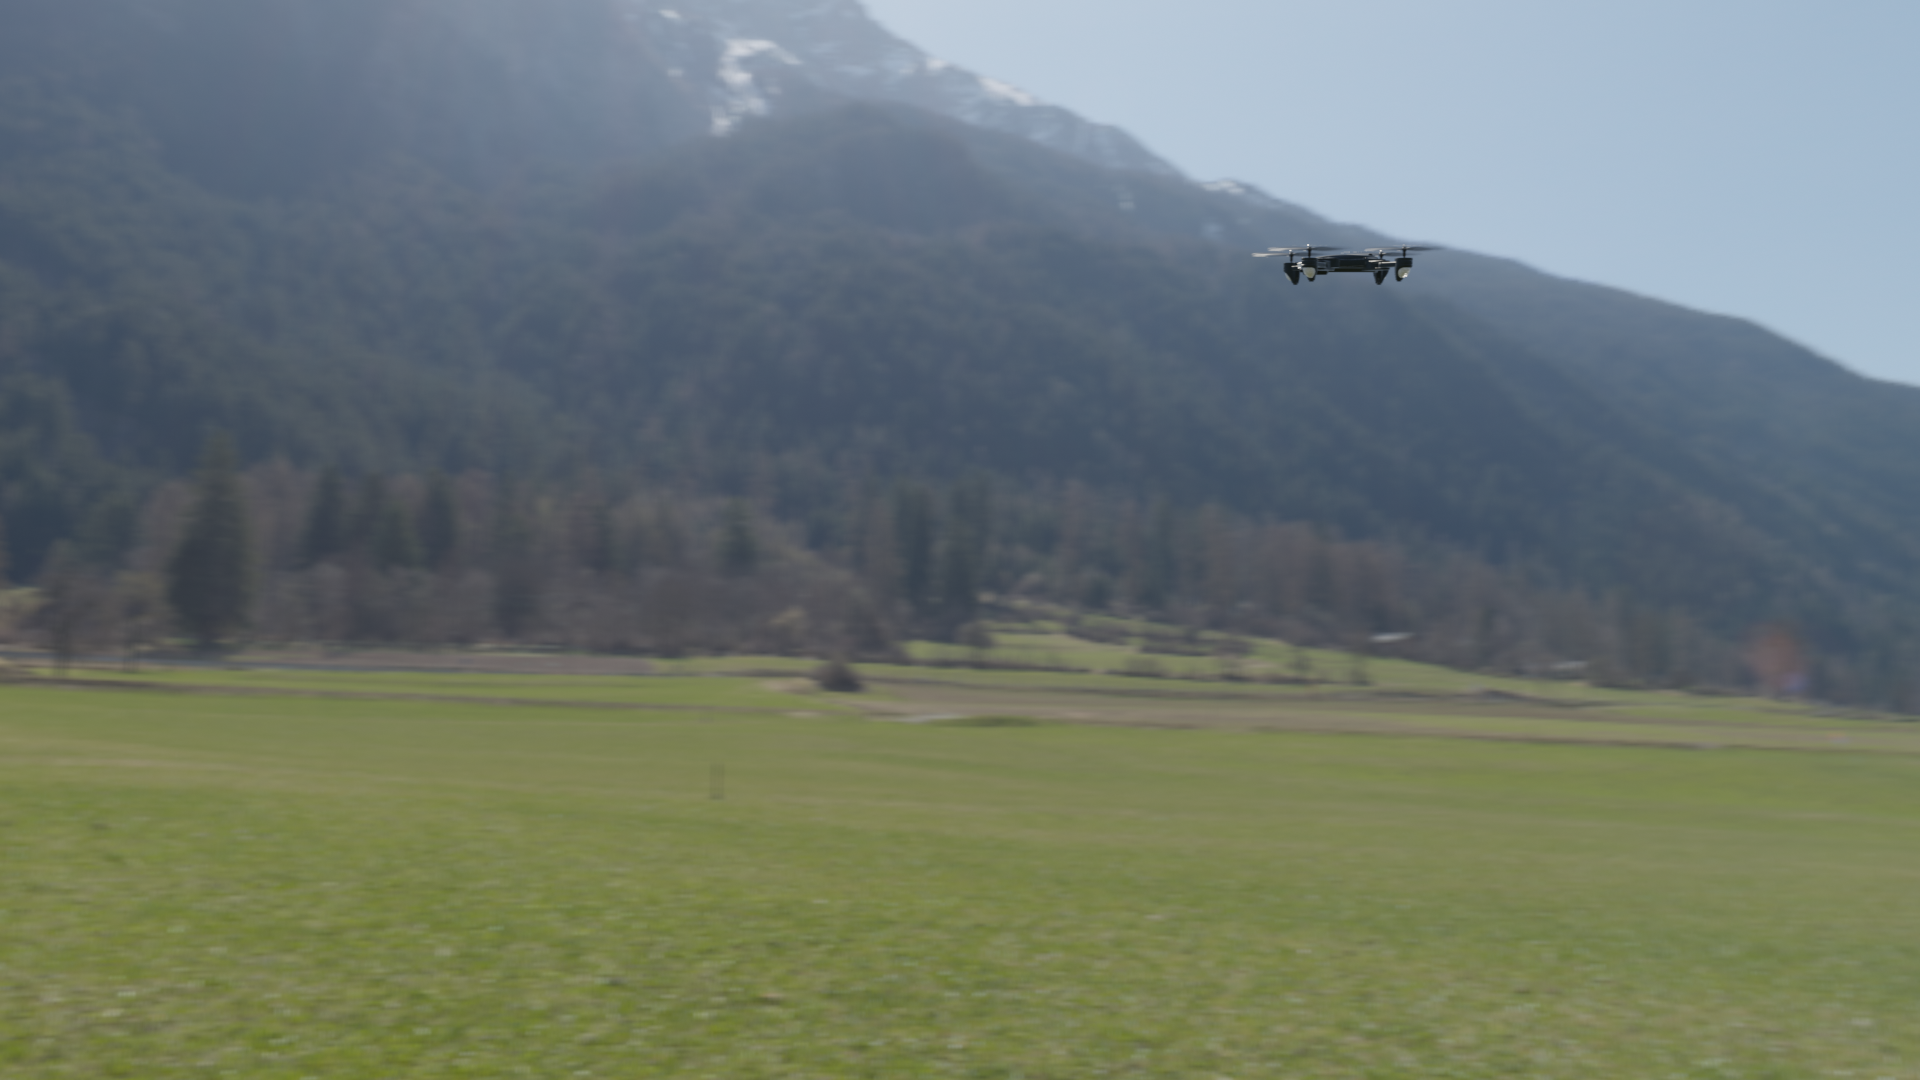
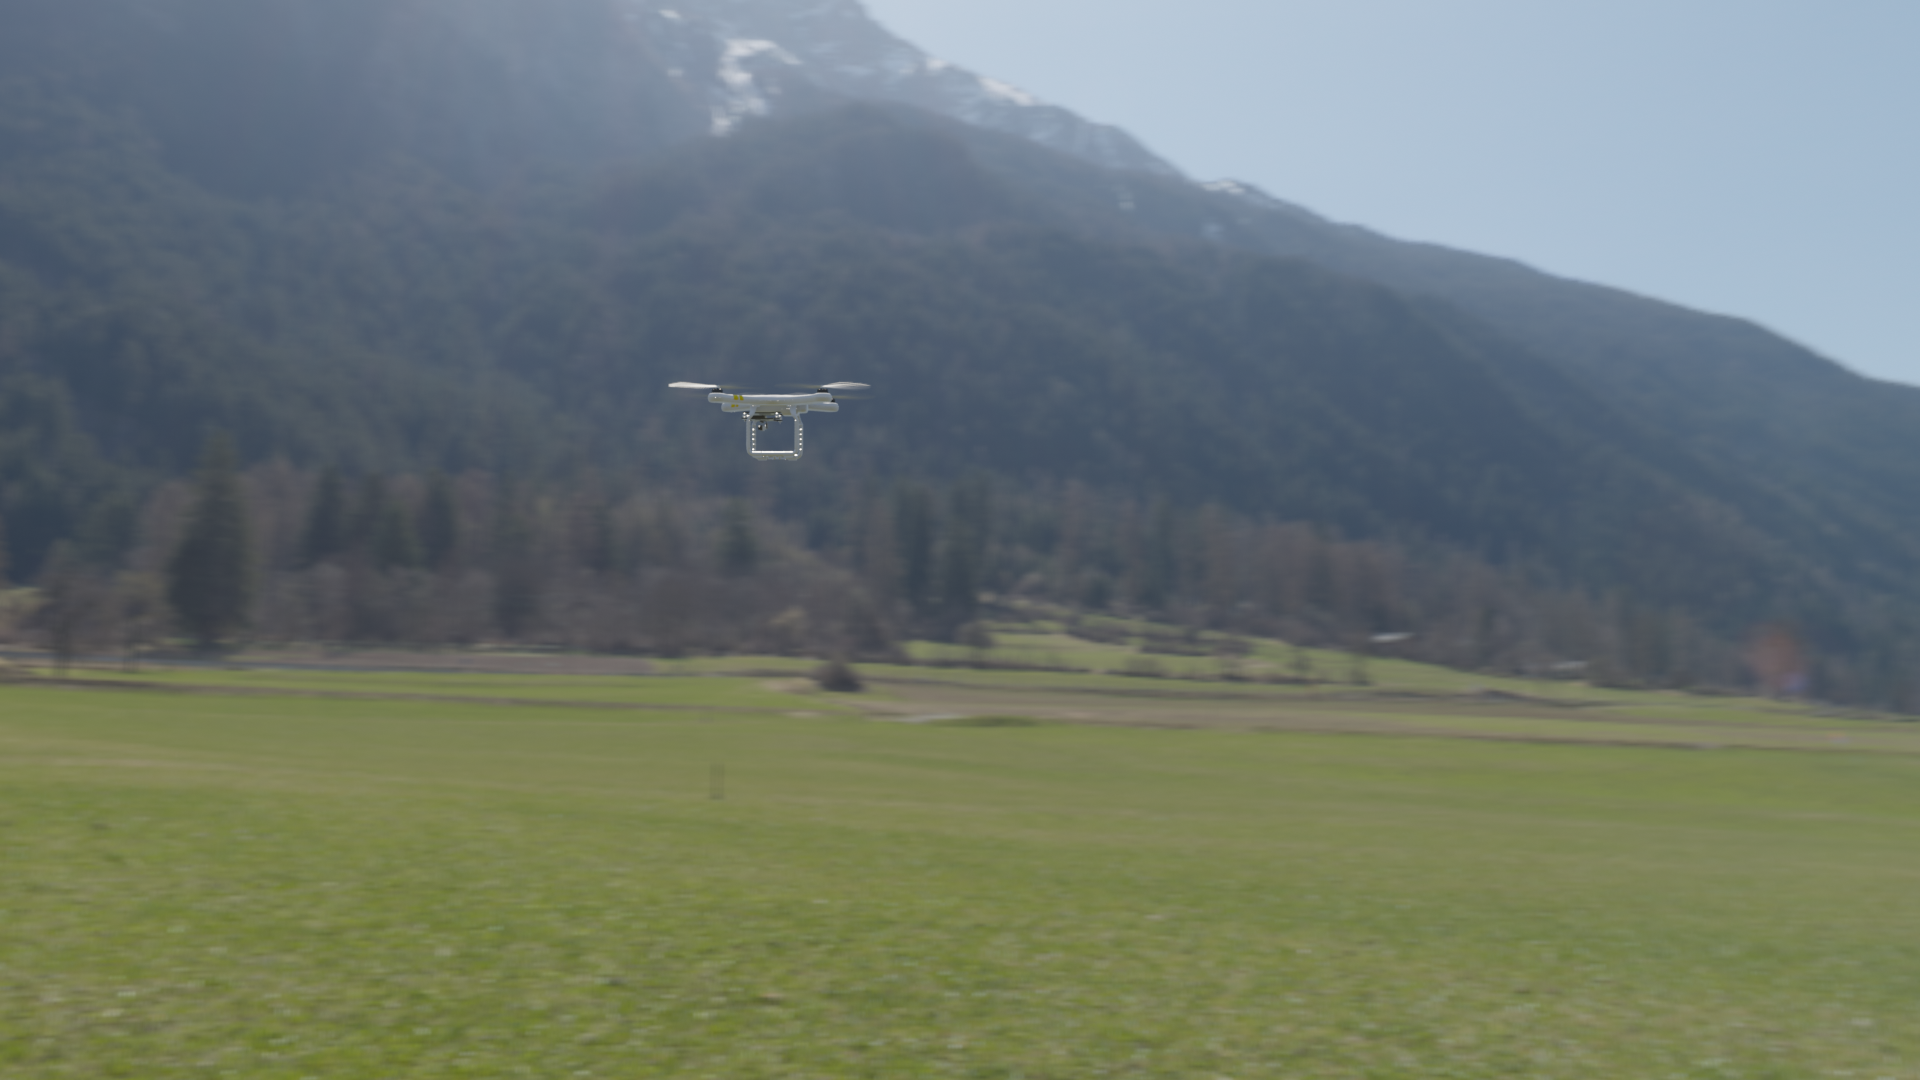
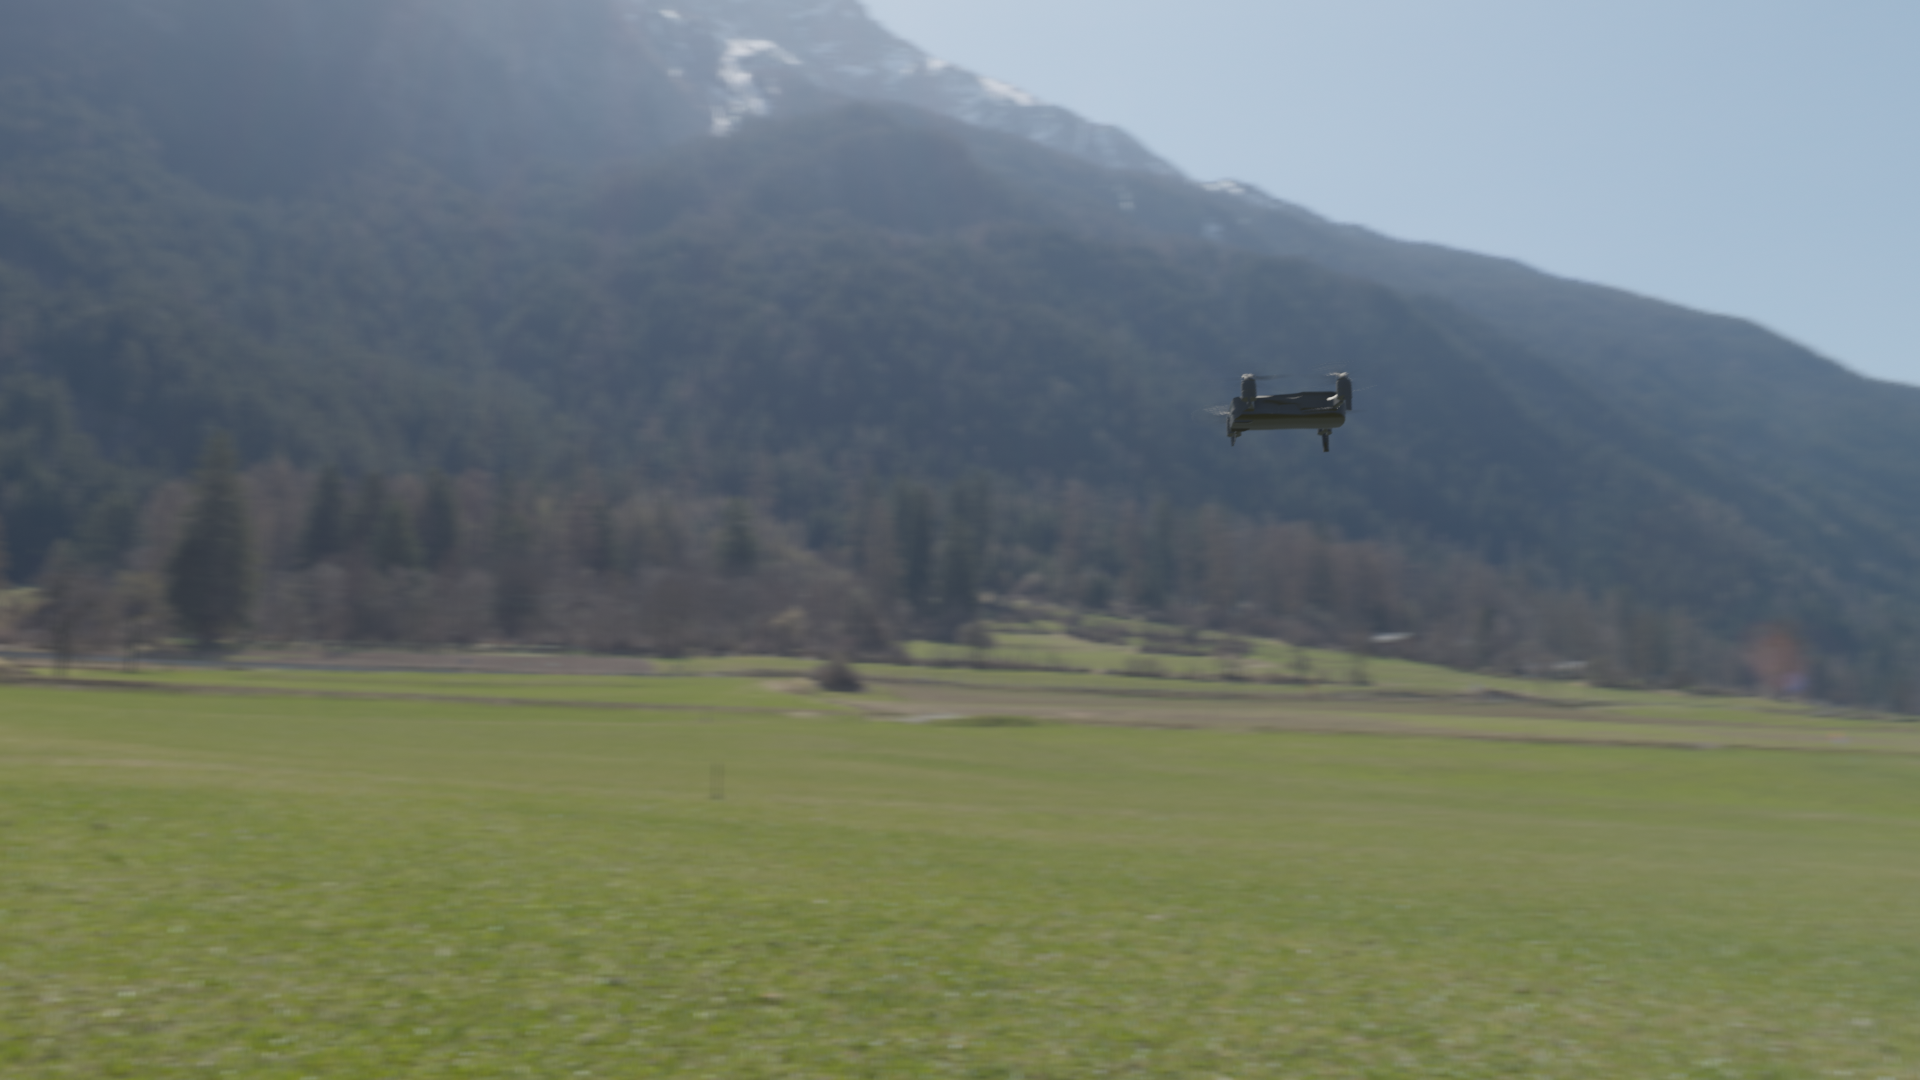
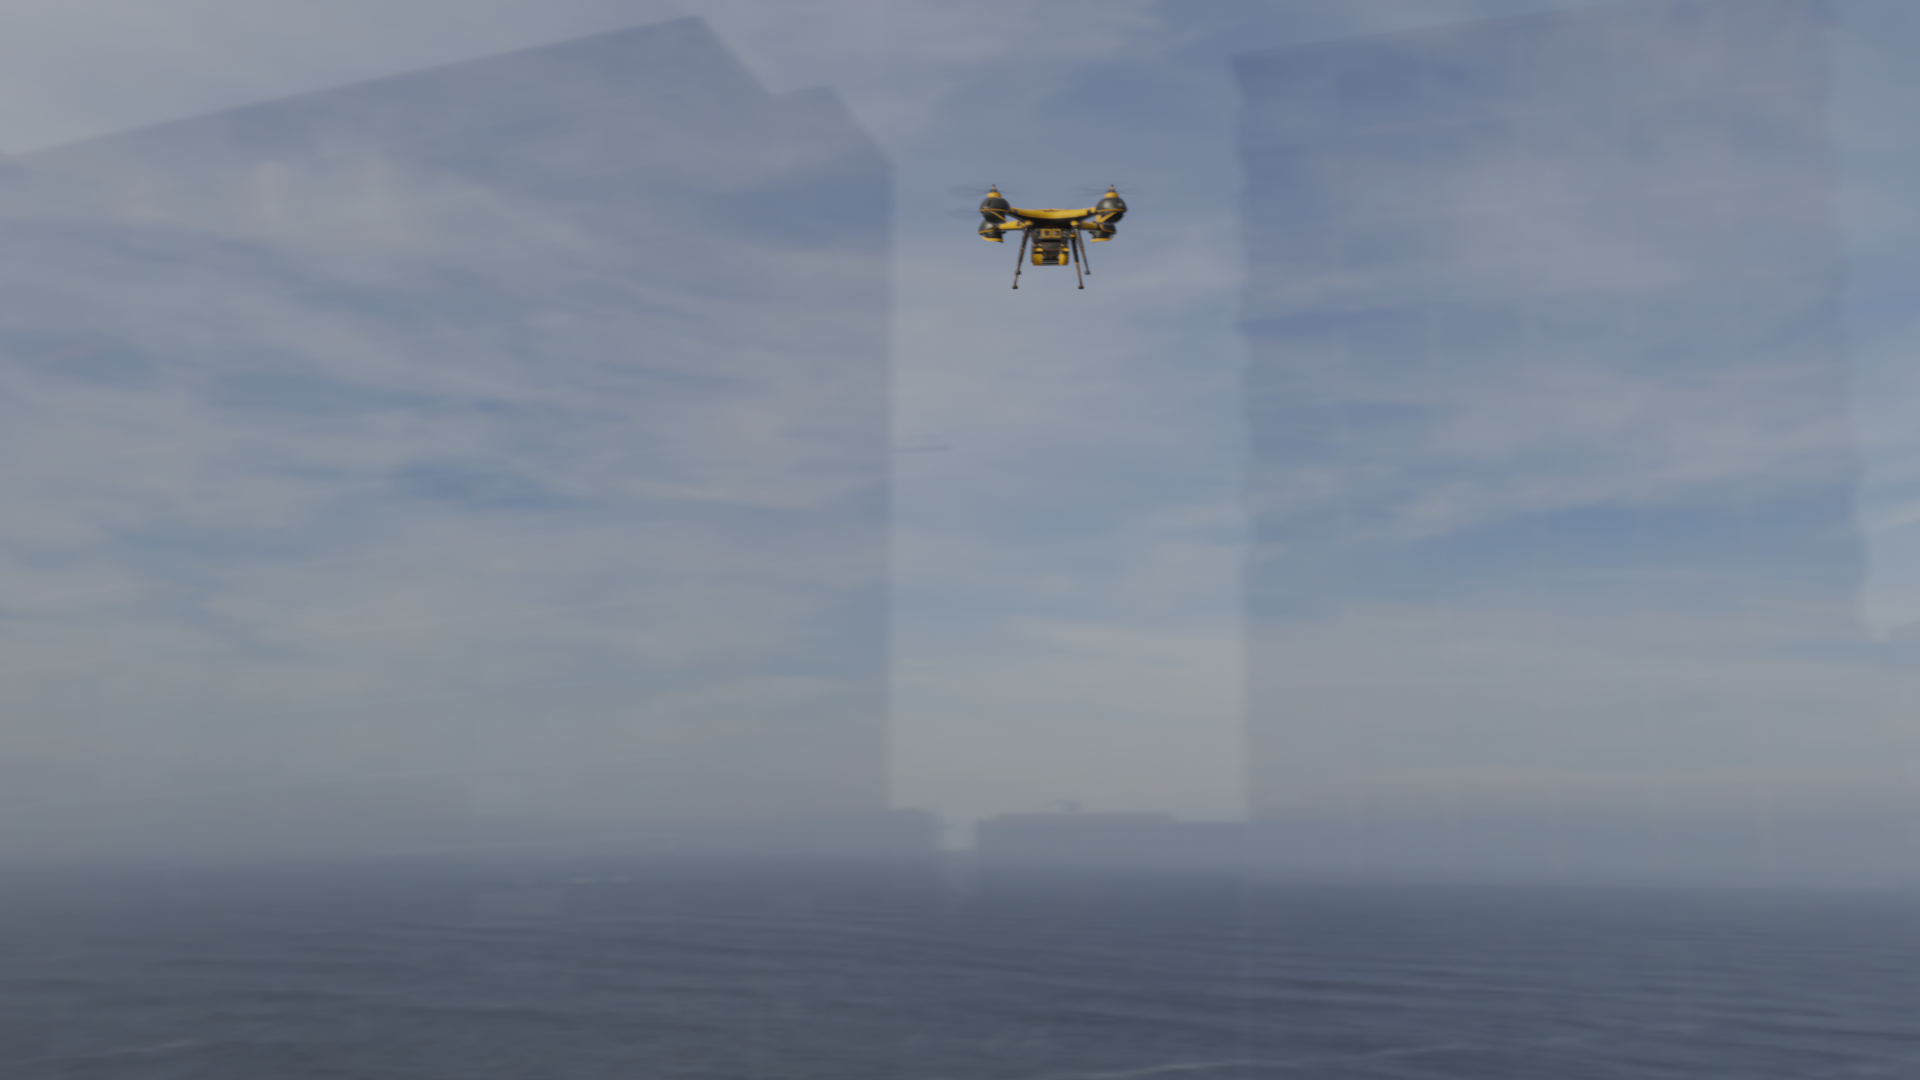
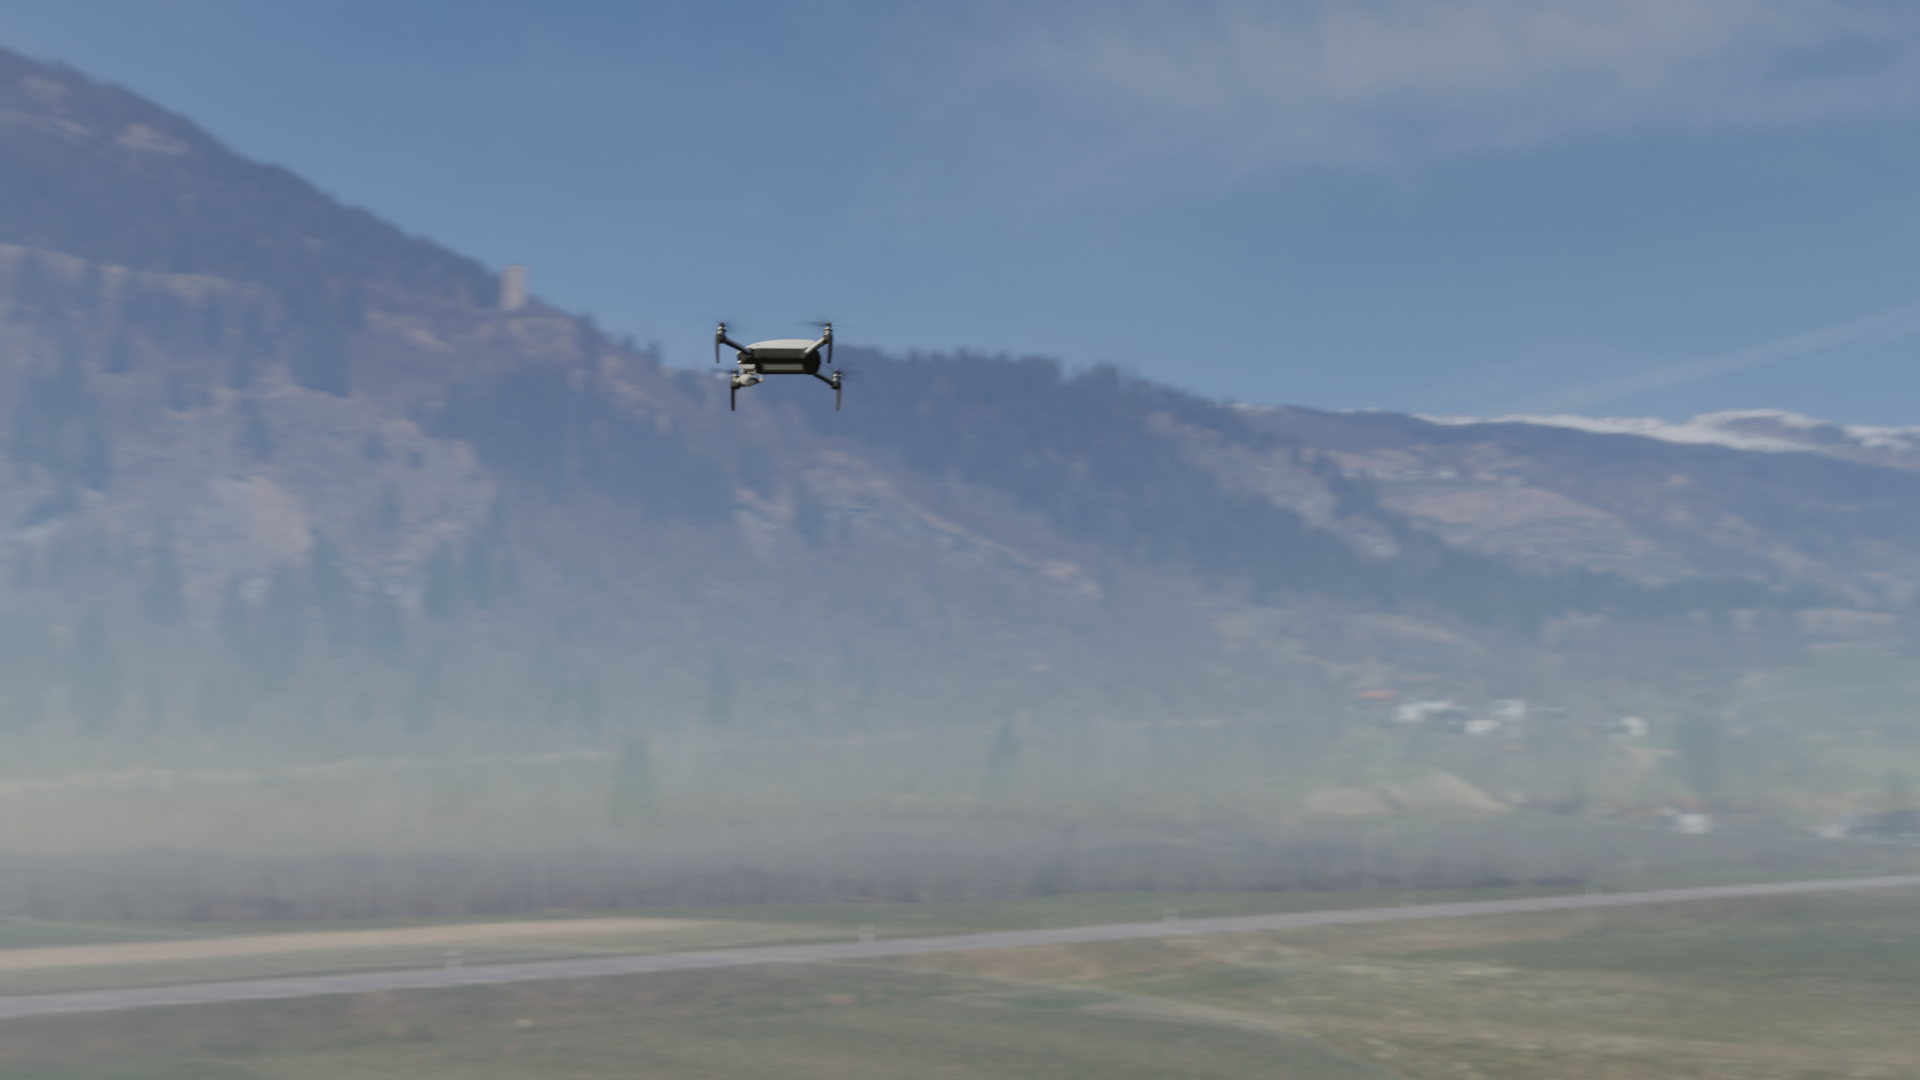
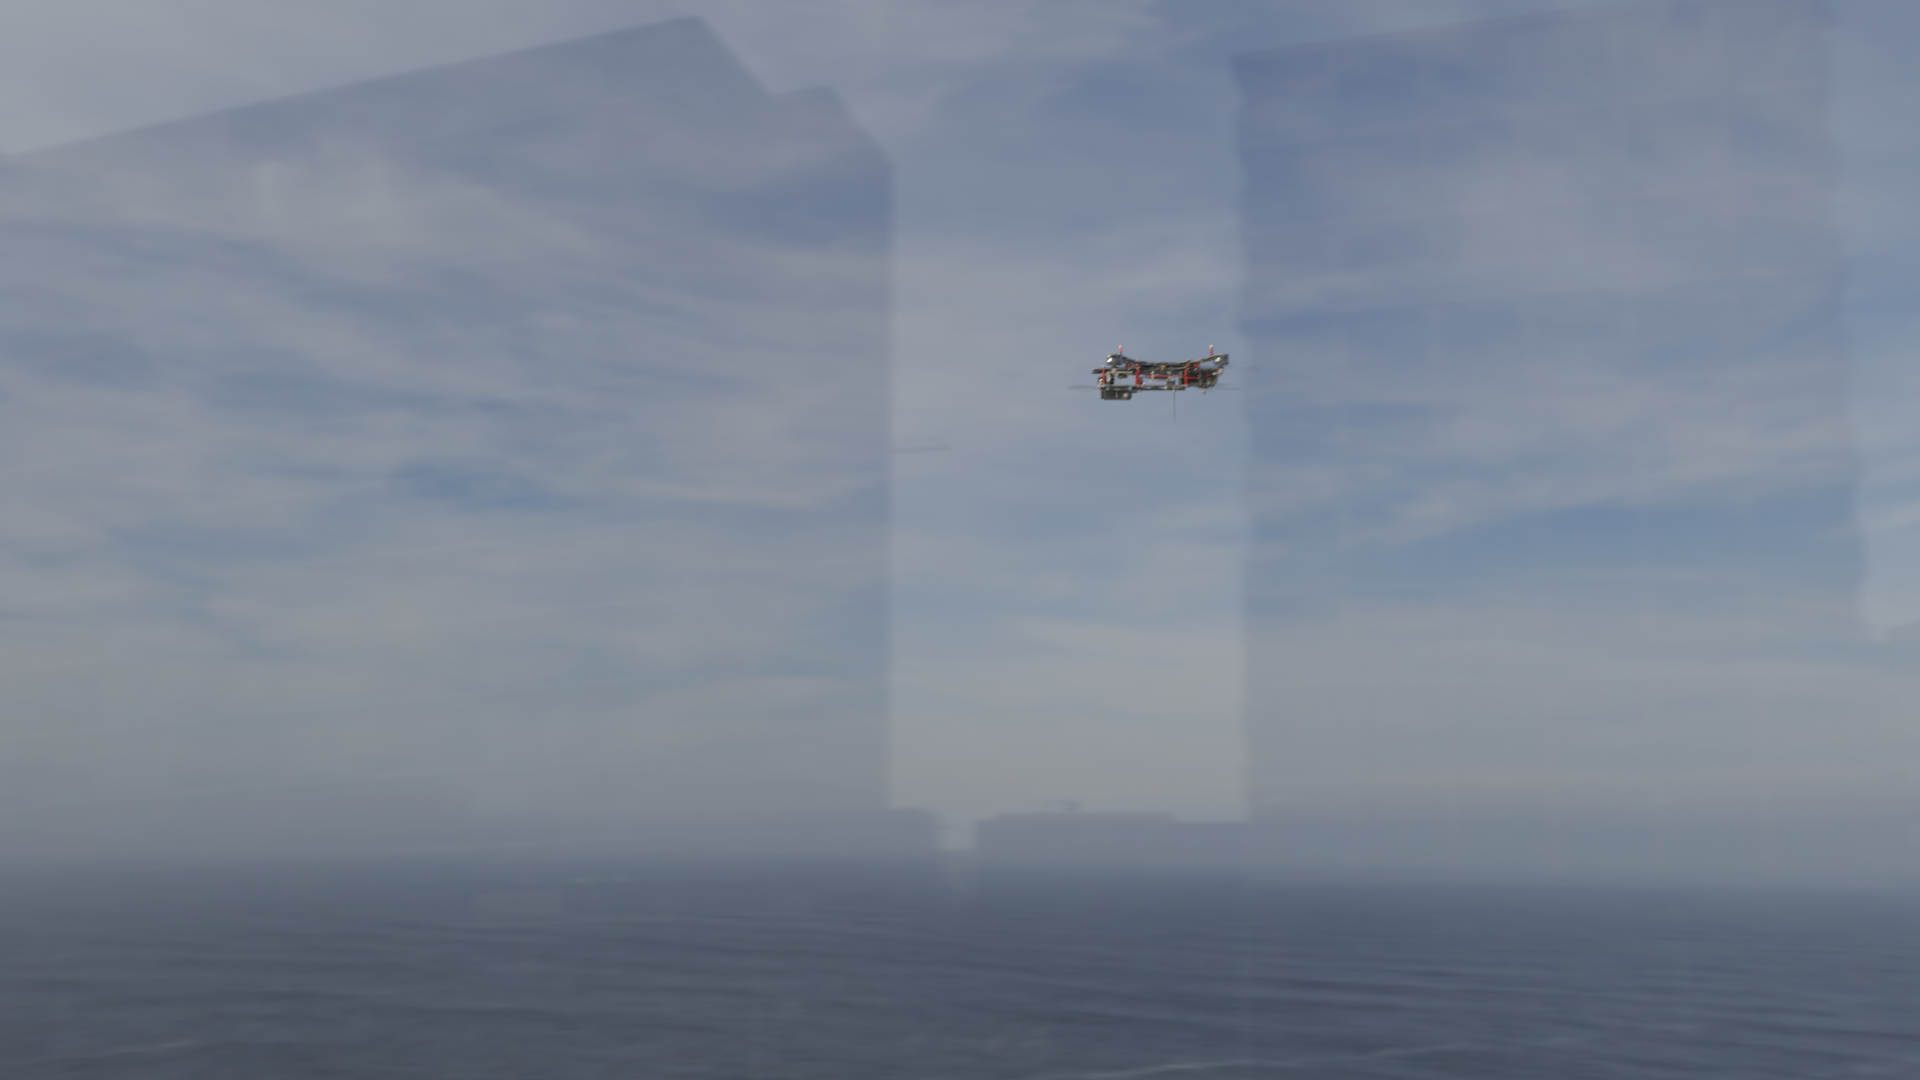
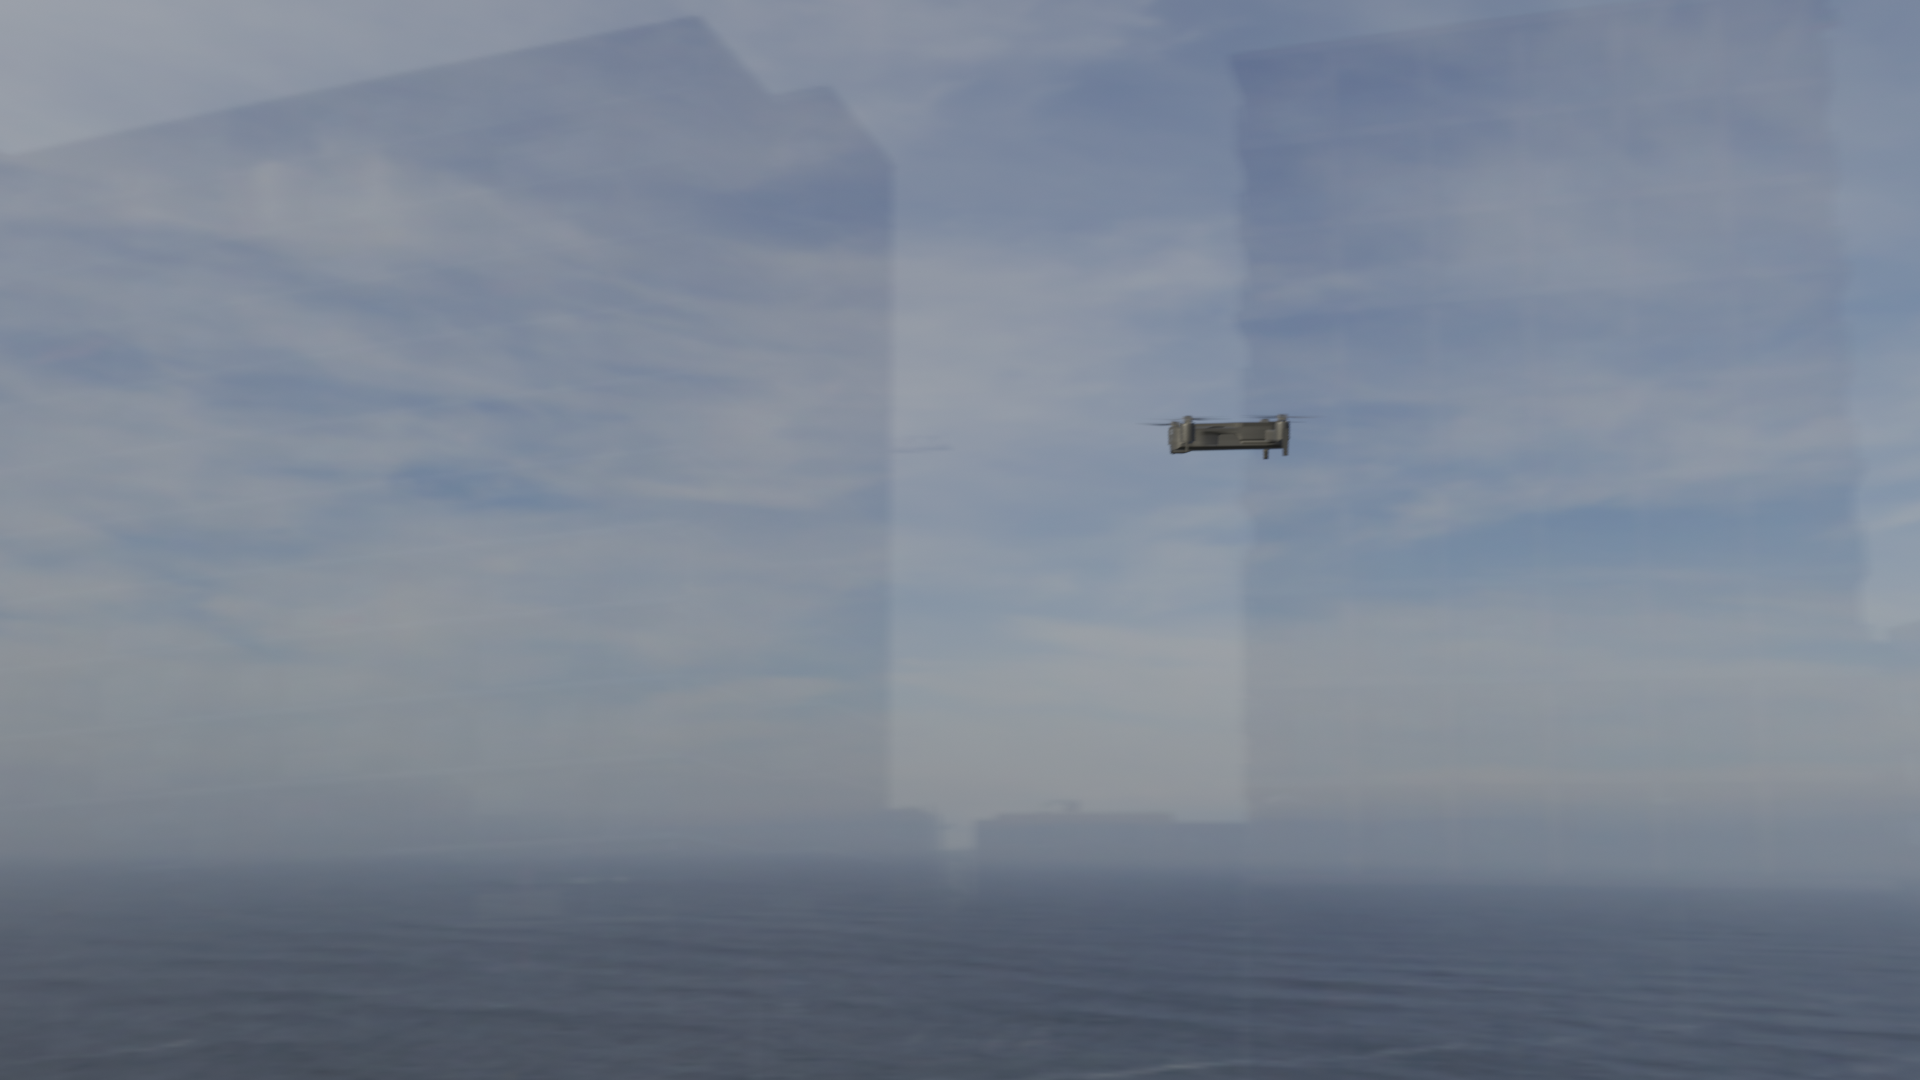
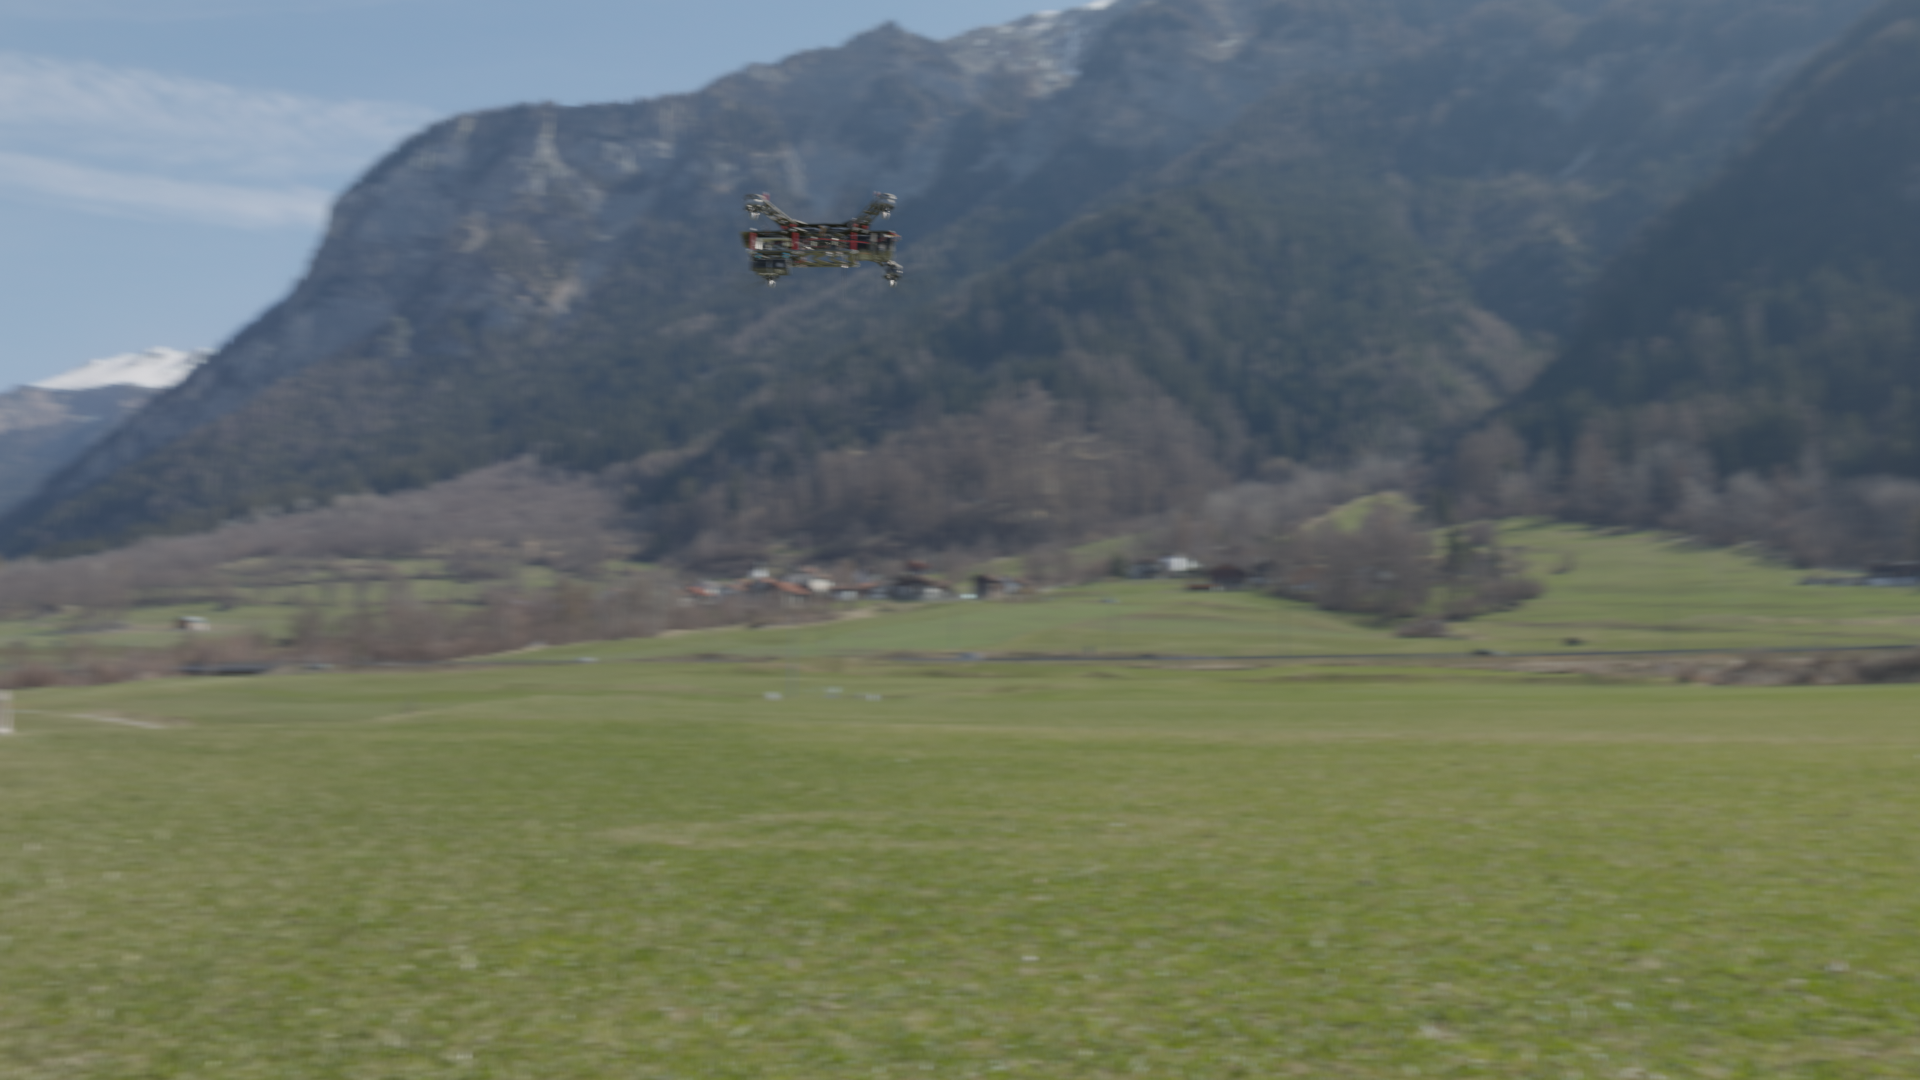
🌿 Same Drones, Different Environment — Natural Background Comparison
The same 12 drone models shown above in an urban setting (buildings), now captured in a natural environment (mountains and meadows). Compare whether the morphological characteristics of each drone remain identifiable when the background changes — a key factor in whether AI relies on background context or the drone itself for recognition.

DR01

DR02
DR03

DR04
DR05

DR06

DR07

DR08

DR09
DR10
DR11

DR12
▲ Same 12 drone models — natural environment (mountains/meadows). Compare with the urban backgrounds above.
Level 1 — Basic Quality Diagnosis
Overall Mean Image — The "Typical Drone" Through AI's Eyes
This is the pixel-level average of 28,800 drone images. The blurriness is normal — it shows the overlapping common contours of 12 different drone types. If the basic drone form is identifiable in the mean image, that is evidence of visual consistency in the dataset.
▲ PBLS_Drone overall mean image — pixel average of 28,800 images (DataClinic L1)
✅ L1 Strengths
- 📐 Perfect resolution consistency: All 1920×1080px fixed — no padding or resizing needed
- 🎨 RGB channel consistency: No grayscale or RGBA contamination
- ❌ Zero missing values: No corrupted or empty images
- 📊 L1 Statistics: Good — rich dataset with diverse structure and texture
📌 L1 Notable Points
- 🏷️ Single class: Class balance metric N/A
- 🔄 Multiple drone types: Rich visual diversity across 12 models
- 🌐 Mixed natural/urban backgrounds: Clear environment clusters form at L2
Level 2 — DataLens Analysis (Wolfram ImageIdentify Net V2)
Level 2 uses Wolfram's ImageIdentify Net V2, trained on 3 million images, as a lens. We examine how single-class PBLS_Drone data distributes in the 1,280-dimensional feature space, and why even a general-purpose AI discovers 3 clusters.

▲ Level 2 PCA distribution — single-class drone data in 1,280-dimensional feature space (Wolfram ImageIdentify Net V2)
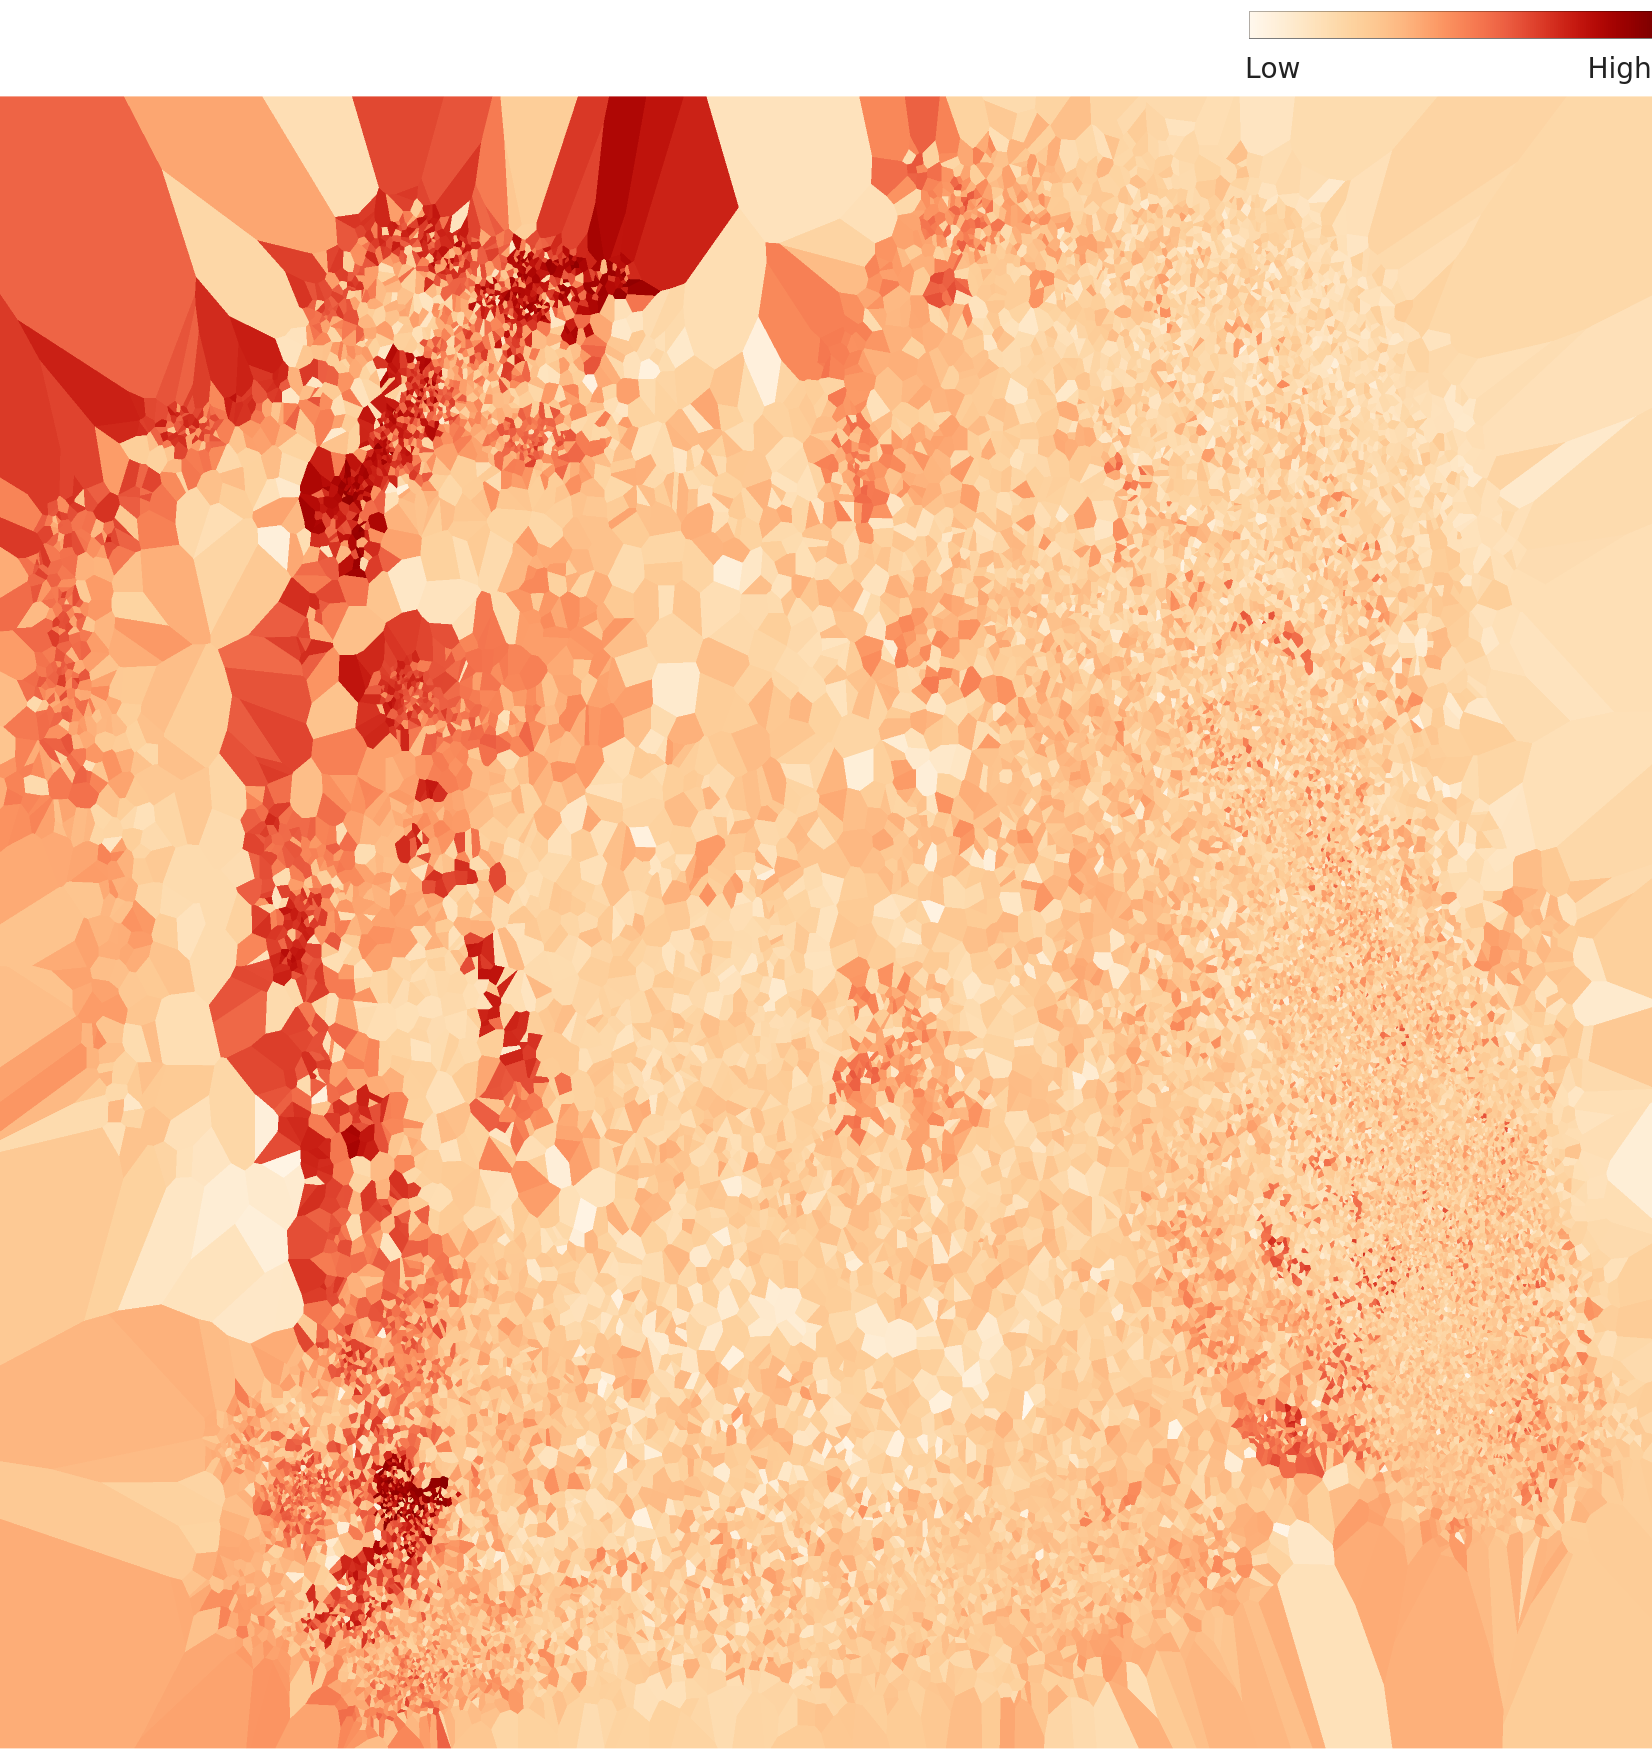
▲ Level 2 density topography — 3 clusters separated by natural vs urban environments
3 Drone Groups Found by General AI — "The Background Is Different"
Natural Environment Cluster
Drone images captured against natural backgrounds — forests, mountains, plains. Green and brown tones. Estimated ~40% of the dataset.
Urban Environment Cluster
Drone images with buildings, roads, and urban backgrounds. Linear structures and gray tones. Estimated ~35% of the dataset.
Mixed/Transition Cluster
Images at natural-urban boundaries or with sky/low-altitude backgrounds. Mixed environments or high-altitude shots with sky backgrounds.
L2 Key Metrics
Level 3 — Drone-Specialized DataLens (788 Dimensions)
Level 3 applies a specialized lens optimized to 788 dimensions based on a 265-layer, 40MB model. Through dimension optimization that preserves class discriminability, it captures drone morphological characteristics more precisely than the general lens. Mean density rose from L2's 0.3 to 0.41, and outliers are stable at 6%.

▲ Level 3 PCA distribution — drone data in 788-dimensional specialized lens
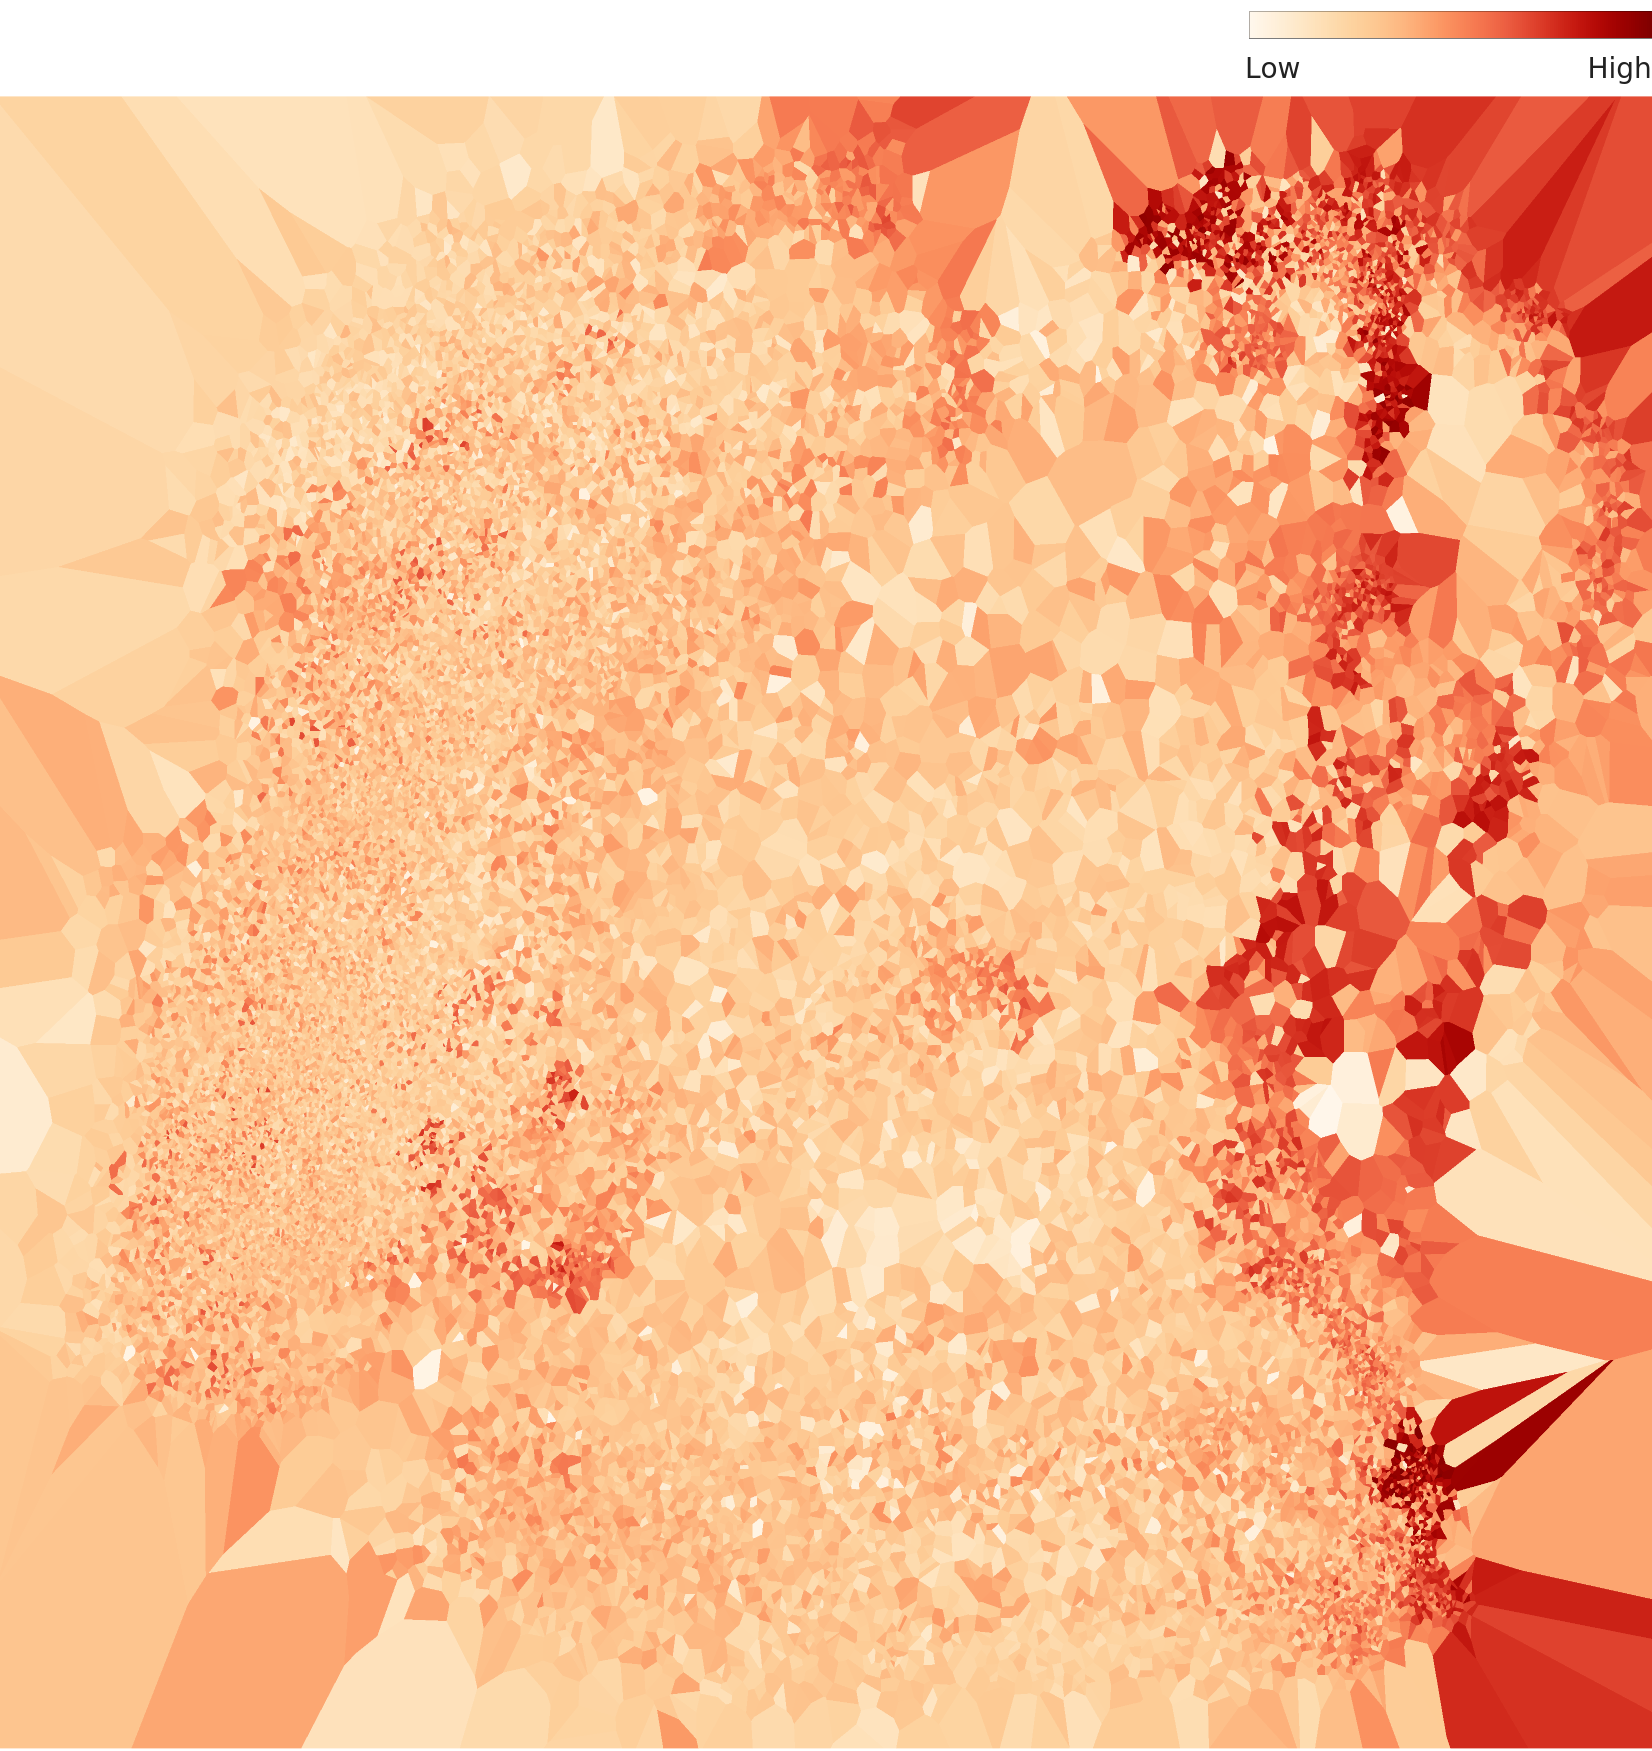
▲ Level 3 density topography — complex clusters and multimodal distribution
Complex Structure Revealed at L3 — "Shape Starts to Matter"
With the specialized lens applied, drone morphological characteristics begin to influence the distribution beyond simple background classification. DataClinic confirmed that Cluster 1 is a complex type mixing buildings and natural landscapes, containing multiple peaks (sub-clusters). This means the 12 drone types, captured at various flight attitudes and environments, have formed fine-grained sub-groups.
L2 (General Lens)
- · 1,280 dims → Mean density 0.3
- · Background-based clusters
- · "Natural vs Urban" binary structure
- · Outliers 6.8%
L3 (Specialized Lens)
- · 788 dims → Mean density 0.41 (+37%)
- · Shape + environment hybrid clusters
- · Complex multimodal distribution (diversity confirmed)
- · Outliers 6% (slightly decreased)
Outlier Analysis — Scenes AI Is Most and Least Confident About
Outlier analysis in a single-class dataset carries special significance. The visual differences between "typical drones" (high density) and "atypical drones" (low density) serve as a map of AI recognition performance strengths and weaknesses.
🟢 High Density — "Typical Drone" Scenes AI Is Most Confident About (L3)
The DR08 model dominates the high-density top ranks. DR05, DR04, and DR03 also rank high, and these drone models and flight attitudes define the dataset's "standard."


🔴 Low Density — Outlier Drone Scenes That Confuse AI (L3)
DR02 and DR09 dominate the low-density top ranks. Unusual flight angles, extreme lighting, and special background combinations are the causes of these outliers.


🔄 The Two Most Different Scenes — Extremes of the Dataset
The pivot (reference point) is DR08_0910 (highest density 0.858). The scenes farthest from this image are DR12 series images. This shows what the most "un-drone-like" drone scenes look like within a single class.
⬆️ These two scenes are the farthest apart in L3 feature space. This is the range where drone recognition AI may struggle the most.
🔗 Most Similar Scenes — Nearest Cluster Around DR08
The images closest to DR08_0910 are all from the "0910 range" frames of DR04, DR05, and DR03. This means different drone models adopt similar poses at the same simulation time step (frame 0910).


Recommendations — From 87 to Even Higher, Why DataBulkup
Why DataClinic recommends Data Bulk-up for PBLS_Drone: The current data has no significant duplication or bias and doesn't need a diet. Rather, samples at cluster boundaries and in low-density regions are insufficient, and adding synthetic data to fill these gaps will contribute to performance improvement.
Data Bulk-up
DataClinic's primary recommendation. While 28,801 images appear sufficient for training, samples in low-density zones (special flight attitudes, extreme lighting, cross-environment) are relatively scarce.
Adding samples especially at cluster boundary zones (natural-urban transitions, altitude changes) can significantly improve the AI model's edge case recognition performance.
Expanded Environment Diversity
Current data centers on natural and urban environments. Real-world drone recognition AI must also work in extreme conditions such as nighttime, fog, backlighting, rain/snow, desert, and maritime.
Domain Randomization techniques are recommended to generate augmented images with randomly varied lighting direction, fog density, and background textures.
Contrasting Recommendations for Two Defense Datasets
Fix environment bias
Add extreme environments
Quality data needs more data; biased data needs a diet.
⚠️ Low-Density Frame Ranges — Simulation Design Review Recommended
Low-density outliers concentrate in frame ranges 0048~0296 and 0890~0896. These ranges are estimated to be scenes where drones are in special flight attitudes (sharp turns, high-speed climbs, close-range capture, etc.). If these outliers represent meaningful cases in real battlefield scenarios, they should be reinforced instead. If they are mere rendering artifacts, quality review and replacement are recommended.
Conclusion — The Possibilities Opened by an 87-Score Drone Dataset
PBLS_Drone is one of the largest publicly available synthetic datasets in the defense AI drone recognition field. 28,801 images, 52GB, Full HD resolution — the numbers alone are impressive, but a DataClinic score of 87 proves this data is not just large but qualitatively excellent.
Unlike PBLS_Military which scored 68 and needed a "data diet," PBLS_Drone already has good data diversity and balance. It is at the stage where richer data can push AI model performance even higher.
Now that drones have become a core asset on the modern battlefield, AI that recognizes drones is the first line of defense. PBLS_Drone provides the foundation for training that AI. With data bulk-up to fill low-density zones and extreme environment data expansion, we will be one step closer to developing drone recognition models ready for real-world deployment.
PBLS_Drone Key Summary Card
Original DataClinic Report: dataclinic.ai/en/report/226 · Not for commercial use