2026.03 · Pebblous Data Communication Team
Reading time: ~13 min · 한국어
Executive Summary
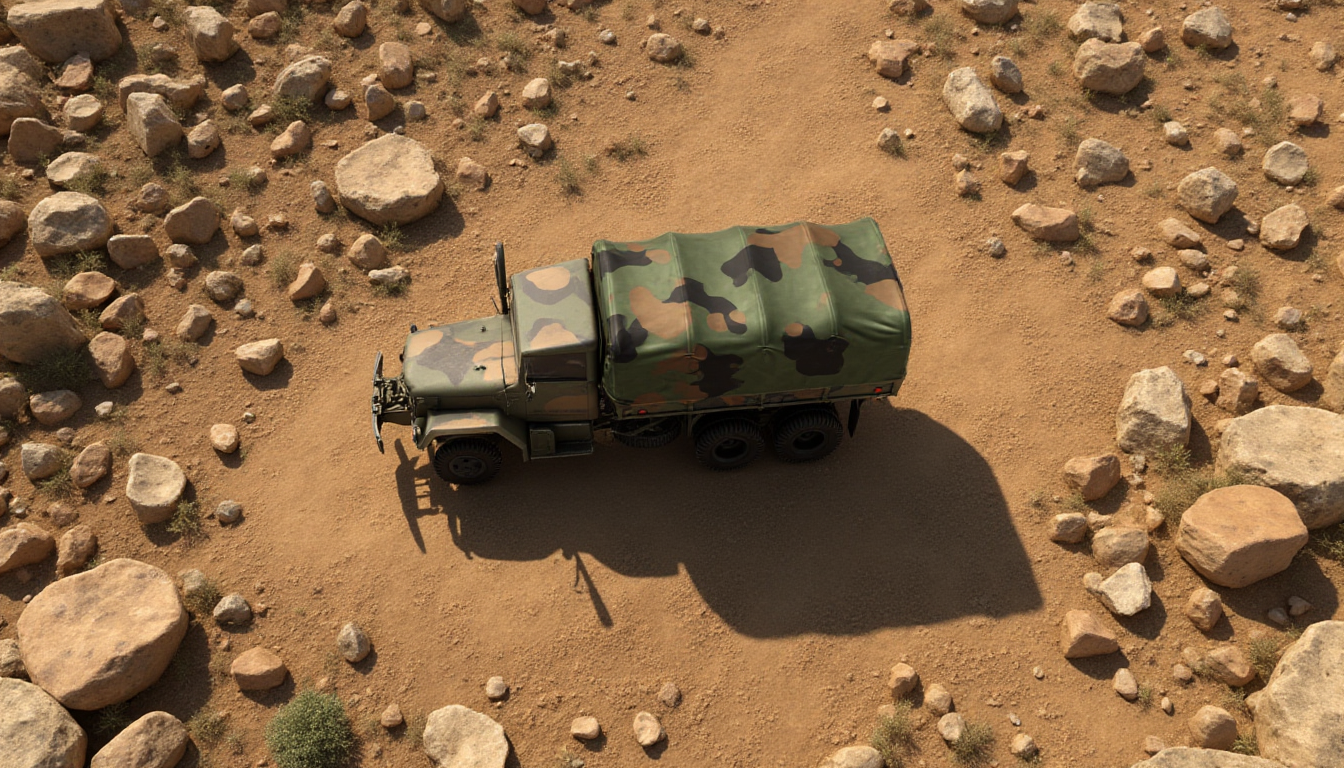
This article is based on DataClinic Report #225. PBLS_Military 3-Class is a synthetic military dataset consisting of 3 classes — K9 self-propelled howitzer, M35A2 truck (covered), and M35A2 truck (uncovered) — with 648 images each, totaling 1,947 images.
DataClinic overall quality score: 79 (Medium). This is 11 points higher than the 10-class version (68). Class balance, integrity, and diversity are all excellent, but L2 and L3 both show Poor distribution. The multimodal clusters created by the camera angle (cm) parameter are the key factor suppressing the score.
In this post, we bring in DataClinic's high-density and low-density sample images to directly verify which parameter combinations are "typical" and which are "outliers" using actual synthetic images.
DataClinic Grade Summary
Why 3 Classes — The Tactical Pair of Artillery and Logistics
While PBLS_Military (#224) covered 10 diverse weapon systems, this #225 dataset focuses on a specific tactical combination: one K9 self-propelled howitzer class and two M35A2 truck classes (covered/uncovered).
This combination is not accidental. In modern artillery combat, self-propelled howitzers (K9) and supply trucks (M35A2) always appear together. The howitzer provides firepower while the truck supplies ammunition, fuel, and materiel. An AI model's ability to distinguish "Is that vehicle a supply truck or combat equipment?" in battlefield imagery is central to tactical situational awareness.
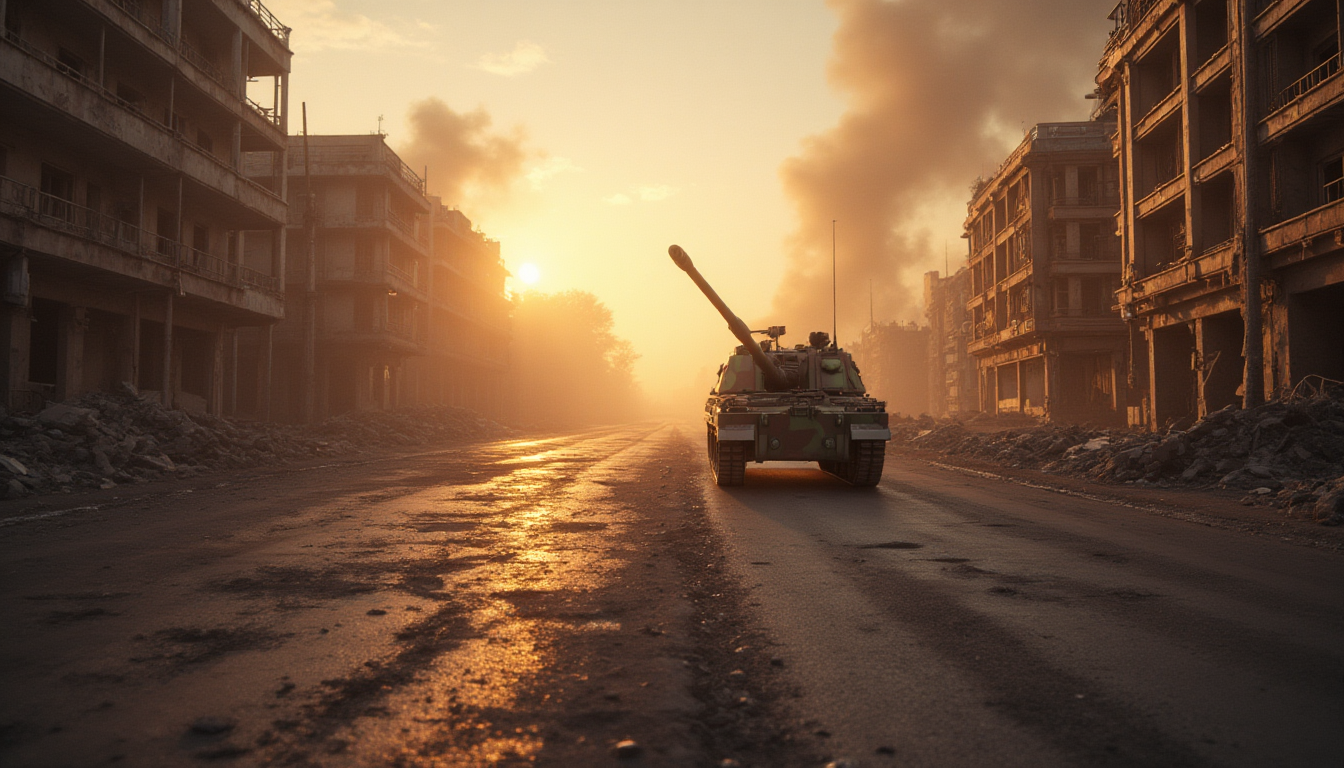
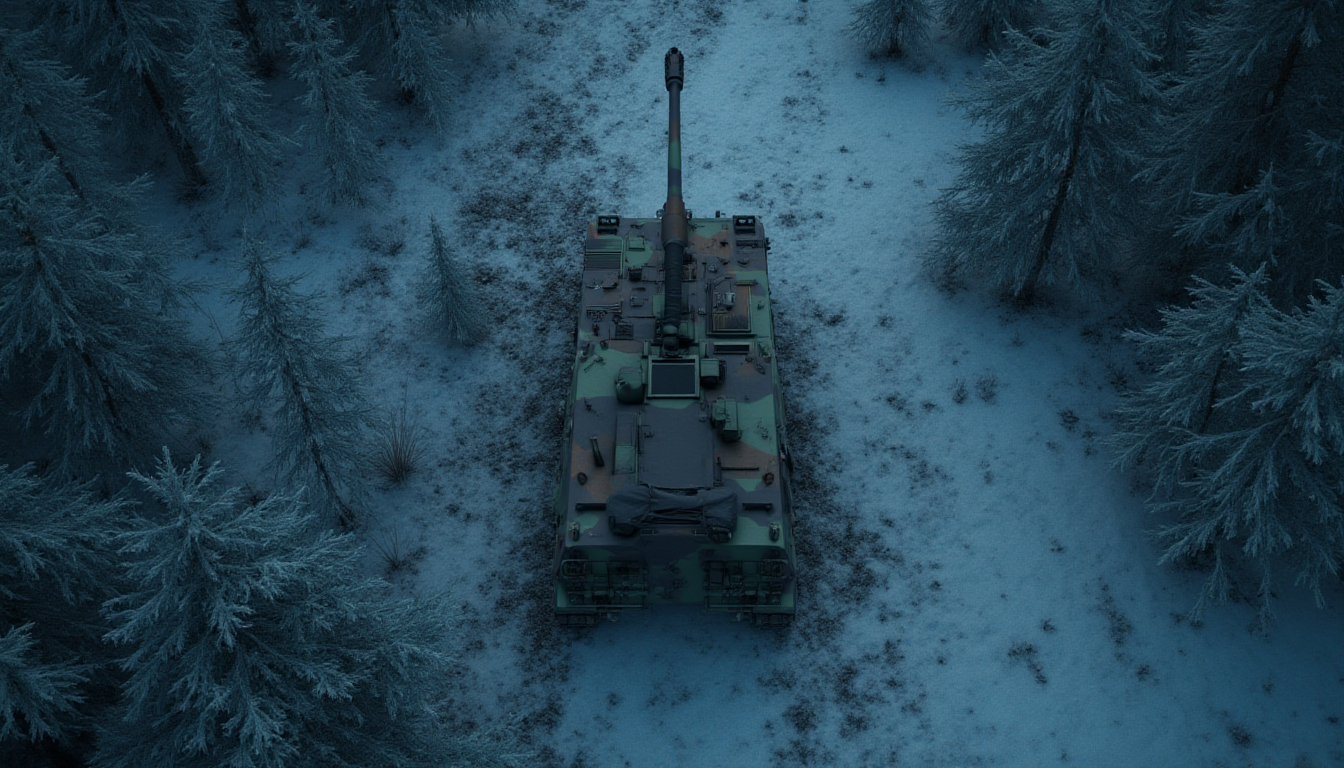
K9 Self-Propelled Howitzer
155mm howitzer. High-speed mobility and autoloading capability. Exported to 14 countries.
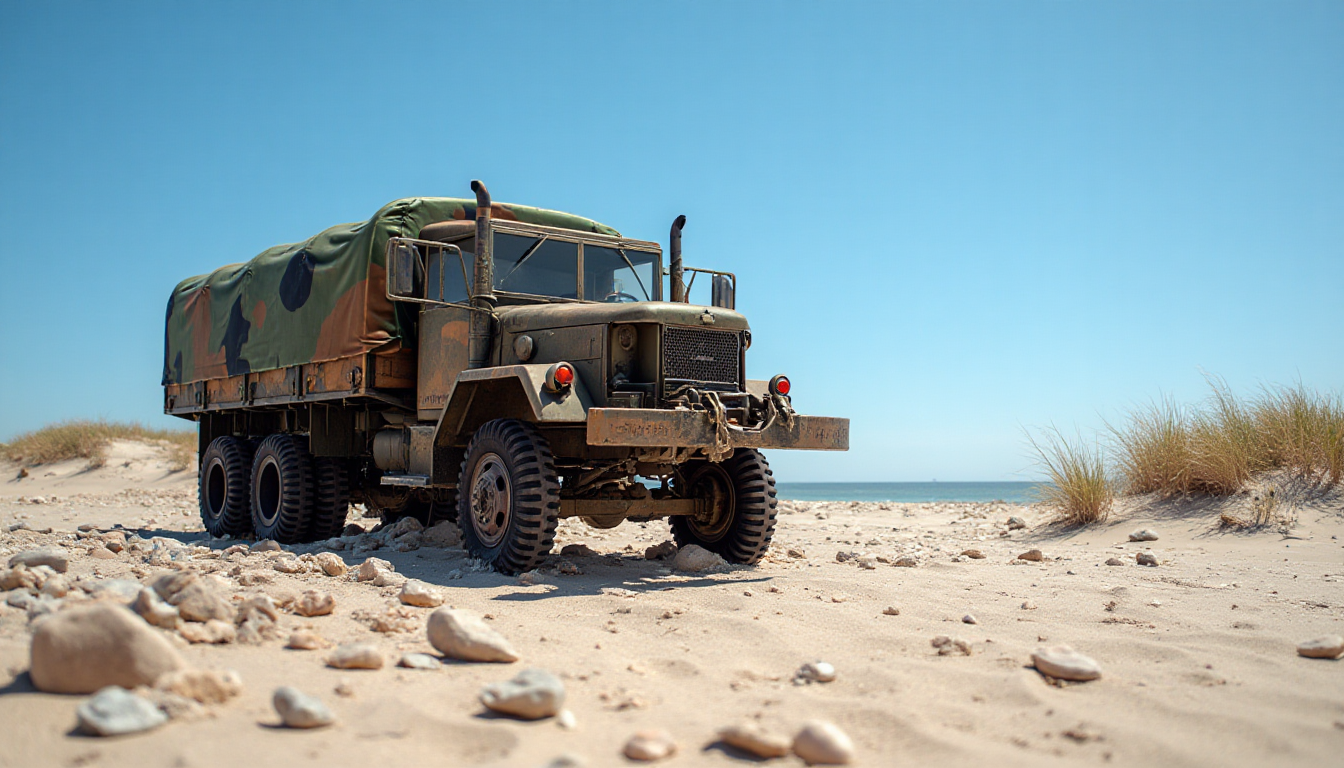
M35A2 Truck (Covered)
Military 2.5-ton cargo truck. Tarpaulin cover conceals the cargo bed.
M35A2 Truck (Uncovered)
Same chassis, no cover. Cargo bed structure exposed.
It is noteworthy that the two states of the M35A2 (covered/uncovered) are managed as separate classes. In reality, the M35A2 has its tarpaulin put on or removed depending on the mission, so it is important for AI models to recognize both states as the same vehicle. This is an intentional design to train the model on state variation of the same object.
The Blueprint of Synthetic Data — What Filenames Reveal
One of the strengths of synthetic data is complete control over generation parameters. The filenames in PBLS_Military 3-Class directly reveal this parameter system.
et = entity type # et1=K9 howitzer, et2=M35A2, et3=M35A2_uncovered
cm = camera # cm1=front, cm2=side, cm3=diagonal camera
sn = scene # sn1~sn4: scene number (equipment pose/placement)
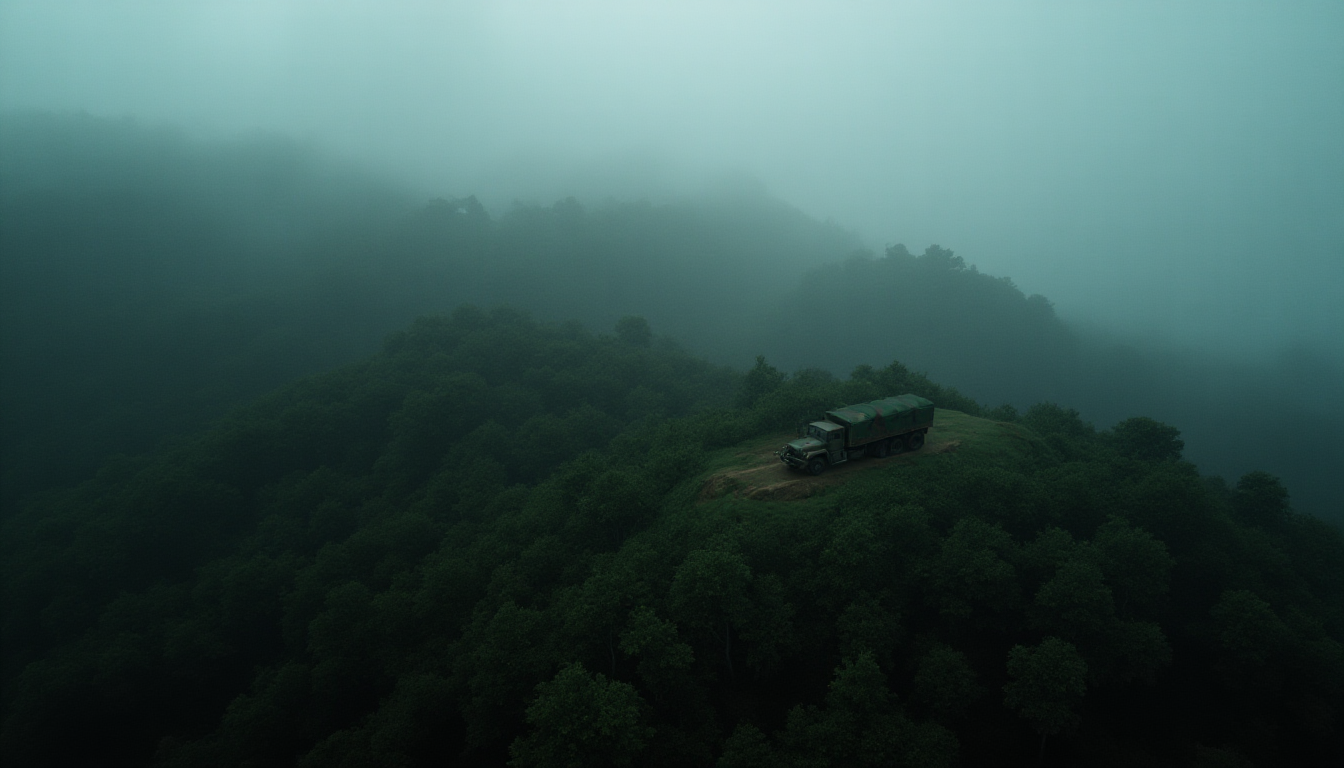
en = environment # en1~en9: lighting, weather, time of day
bg = background # bg1~bg9: terrain (grassland, desert, urban, etc.)
cl01 = class label
This parameter system can theoretically produce 3 types x 3 cameras x 4 scenes x 9 environments x 9 backgrounds = 2,916 combinations. The actual 648 images per class represent about 22% of all possible combinations. Therefore, each class contains diverse parameter combinations, but some may be repeated or entirely absent.
This parameter structure is the direct cause of the L2 Poor distribution we will examine later. When the camera angle (cm) changes, images land in different clusters in the embedding space — as if photos of the same object taken from different angles look like different objects entirely.
3-Class Gallery — Actual Samples and Mean Images
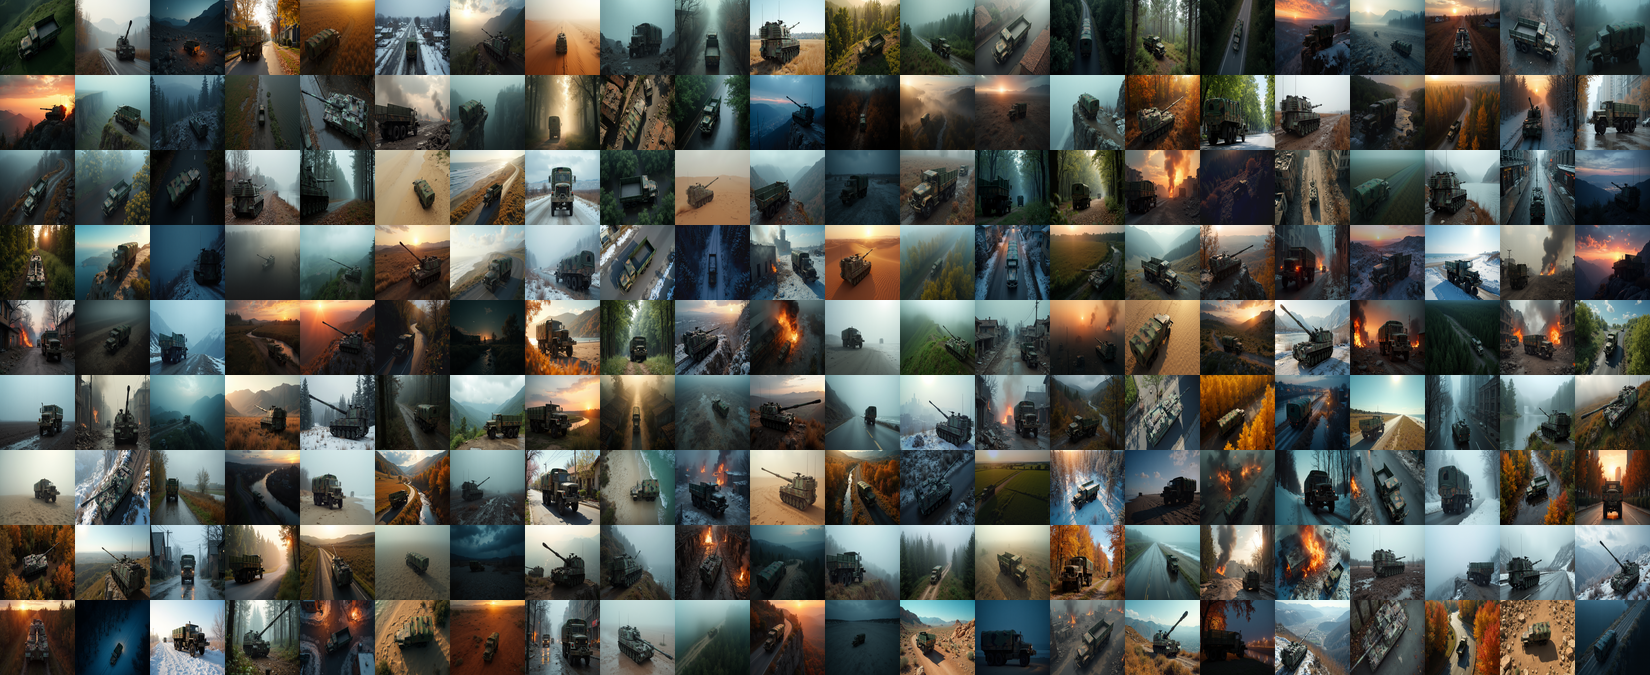
▲ PBLS_Military 3-Class Synthetic Dataset Collage — K9 Howitzer, M35A2 (Covered), M35A2 (Uncovered), 1,947 images
We compare each class's representative sample image (left) with its pixel-averaged mean image (right) side by side. The mean image is the pixel-wise average of all 648 images in that class — the sharper the mean image, the higher the consistency in composition and pose.
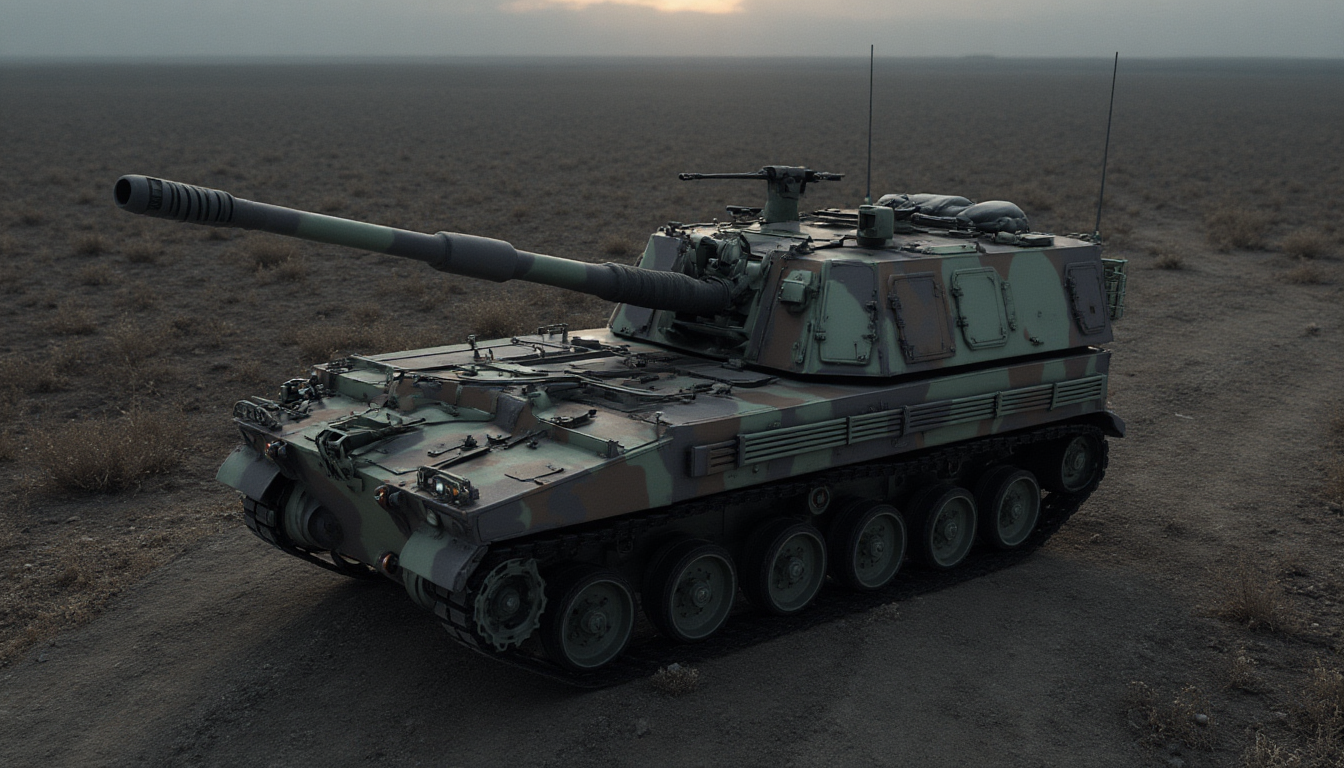

155mm L/52 self-propelled howitzer. Rated among the world's top howitzers alongside Germany's PzH 2000, exported to 14 countries including Poland, Norway, India, and Australia. The mean image reveals the gun barrel direction and hull outline with considerable clarity — evidence that the basic silhouette of the howitzer is consistently maintained across all 648 images.
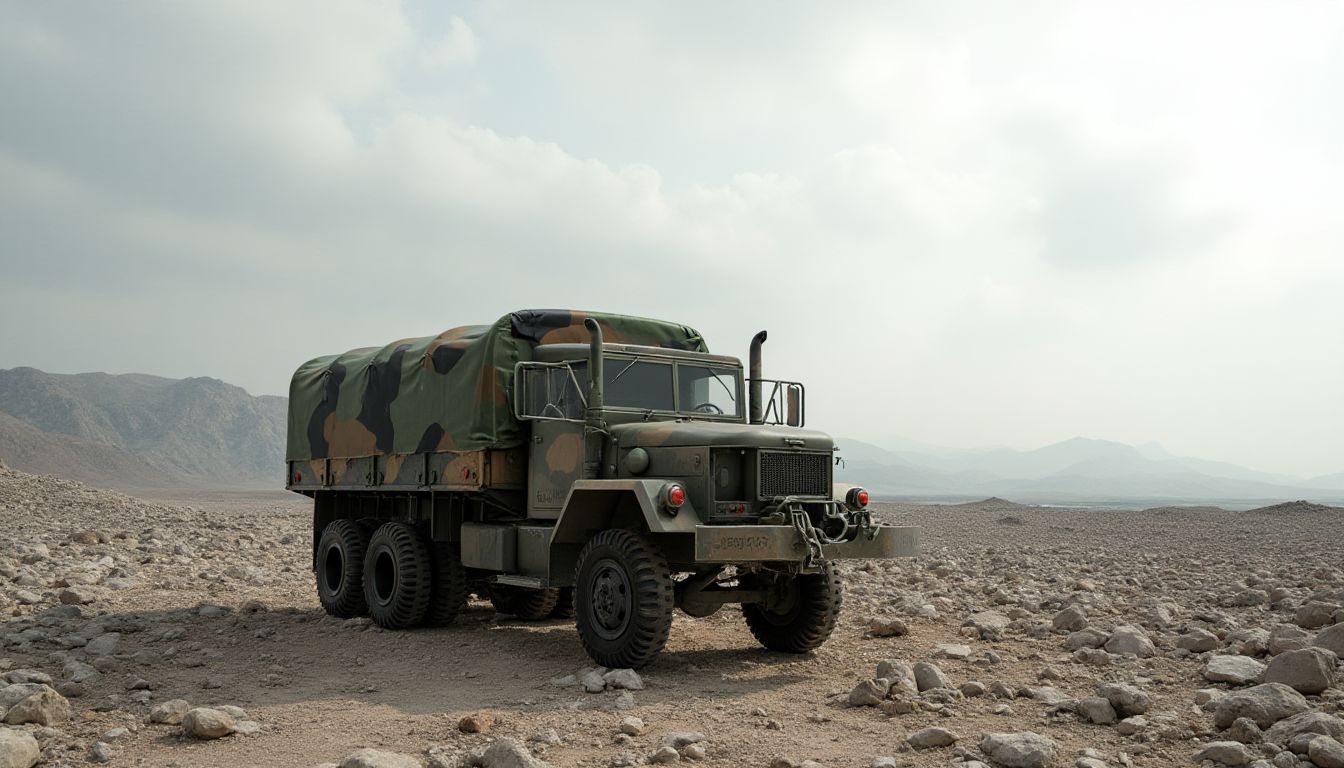

2.5-ton military cargo truck. The cargo bed is covered with a canvas tarpaulin. In the mean image, the truck's front and tarpaulin shape are relatively clear. However, the mean image is slightly blurrier than K9's, due to greater color variance from background changes.
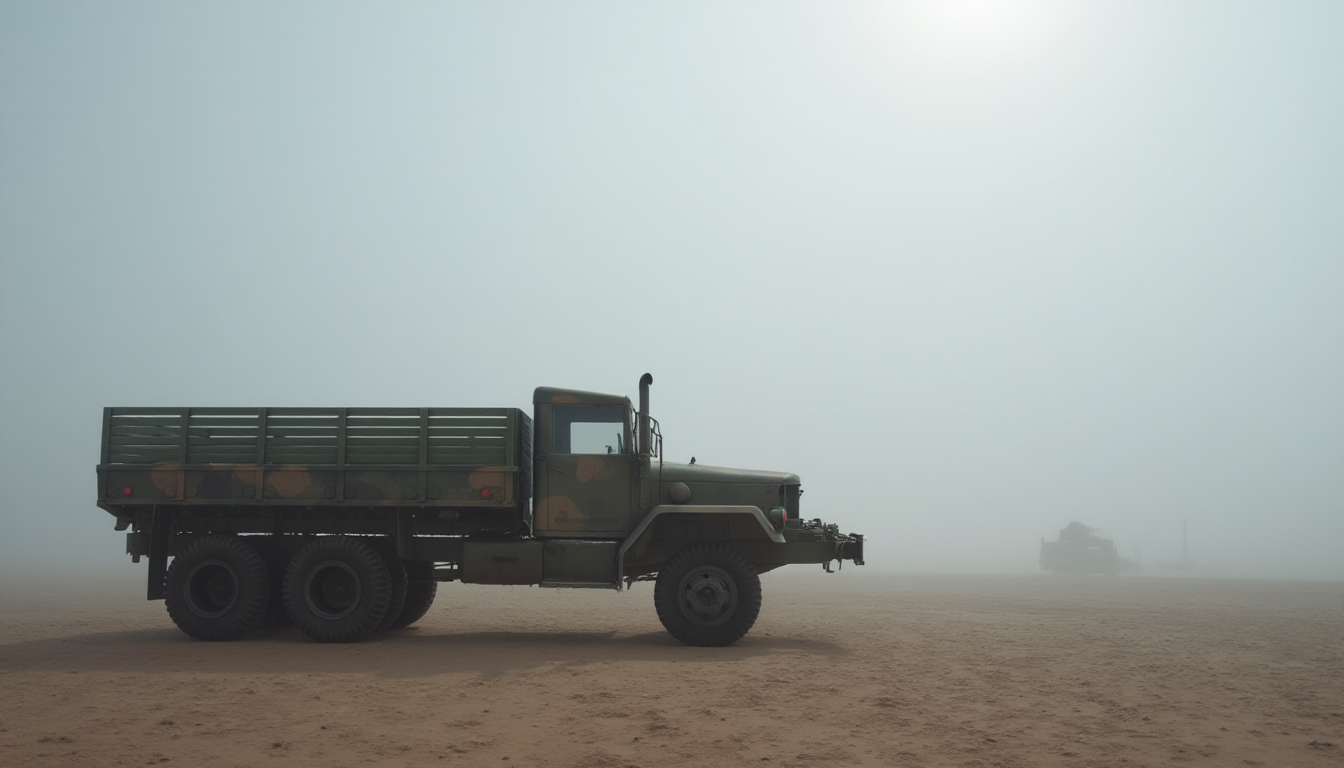

Same M35A2 chassis but without the cargo bed cover. The metal structures (ribs and side panels) of the cargo bed are exposed. The mean image appears overall blurrier than the covered version — because the exposed cargo bed structure is viewed at different angles depending on the scene number (sn).
▲ Actual sample (left) and pixel mean (right). K9 shows the sharpest mean image while M35A2_uncovered is the blurriest — this sharpness difference intuitively represents per-class diversity.
Level 1 — What All-"Good" Basic Quality Means
Level 1 is a pixel-level basic fitness check. Integrity, missing values, class balance, and statistical measurement — all 4 items received Good. This is an improvement over the 10-class version (L1 statistics: Poor).
| Item | Grade | Details |
|---|---|---|
| Image Integrity | ✅ Good | RGB channels 100%, uniform 1336~1344×768px |
| Missing Values | ✅ Good | No missing values — all items complete |
| Class Balance | ✅ Good | K9: 648, M35A2: 648, M35A2_uncovered: 648 (SD=0.0) |
| Statistical Measurement | ✅ Good | Pixel mean image analysis: diverse structure/viewpoint mix → high diversity |
Perfect class balance with SD=0.0 is one of the greatest advantages of synthetic data. With real-world captured data, some classes would inevitably have more images than others. Synthetic data can be controlled to generate exactly 648 images per class.
It is also noteworthy that L1 statistical measurement came out as Good. The fact that mean images do not look like "noise" and structural shapes are identifiable means that the basic silhouette and placement of equipment are consistently maintained within each class. Even with diverse background (bg) and environment (en) parameters mixed in, visual consistency of the equipment itself has been secured.
K9 — Sharpest Mean
Clear barrel and hull outline → high visual consistency
M35A2_uncovered — Blurriest Mean
Cargo bed structure exposed differently per scene → low consistency
▲ Even within the same dataset, diversity levels differ by class.
Level 2 — The Nature of Multimodal Distribution Through a General Lens
Level 2 observes images through the Wolfram ImageIdentify Net V2 (1,280-dimensional) general-purpose neural network lens. This lens is a general image recognition model not specialized for military data.
Geometry: Medium
Green/gray camouflage patterns, medium-to-large size, and natural environment backgrounds are consistent. However, the general lens tends to group K9 howitzers and M35A2 trucks into the broader category of "military vehicles" — meaning the geometric features of the two classes overlap in certain regions.
Distribution: Poor — The Cause of Multimodal Patterns
The reason L2 distribution was rated Poor is a multimodal distribution. Multiple peaks appear in the density distribution. This means that even within the same class, images do not cluster into a single group in the feature space but separate into multiple groups.
We can infer the cause through filename analysis. Looking at the most similar image pairs found by DataClinic:
M35A2 — et2_cm1_sn4_en1_bg6
density 0.128 | camera: cm1 (front)
M35A2 — et2_cm1_sn4_en2_bg5
density 0.142 | camera: cm1 (front)
▲ Most similar pair: both cm1 (front camera), sn4 (same scene). Only environment (en) and background (bg) differ.
The most similar images share the same camera angle (cm) and scene (sn). Conversely, looking at the most different (farthest) images:
M35A2 — et2_cm2_sn2_en4_bg4
density 0.067 | camera: cm2 (side)
K9 — et1_cm1_sn2_en1_bg9
density 0.068 | background: bg9 (extreme)
▲ Most different pair: camera angle (cm) and background (bg) differ. Extreme backgrounds like bg9 lead to outliers.
Conclusion: The primary cause of L2's multimodal distribution is the camera angle (cm) parameter. The same equipment photographed at cm1 (front), cm2 (side), and cm3 (diagonal) forms different clusters in the general lens's feature space. This is an inherent characteristic of synthetic data — not a data quality defect, but the result of intentionally including diverse camera angles in the design.
🔬 Multimodal Clusters Through Pebbloscope
Below is a snapshot visualizing the L2 embeddings of M35A2 uncovered truck (m35a2_uncovered) through Pebbloscope. You can see two distinct clusters forming within the same class based on background environment.
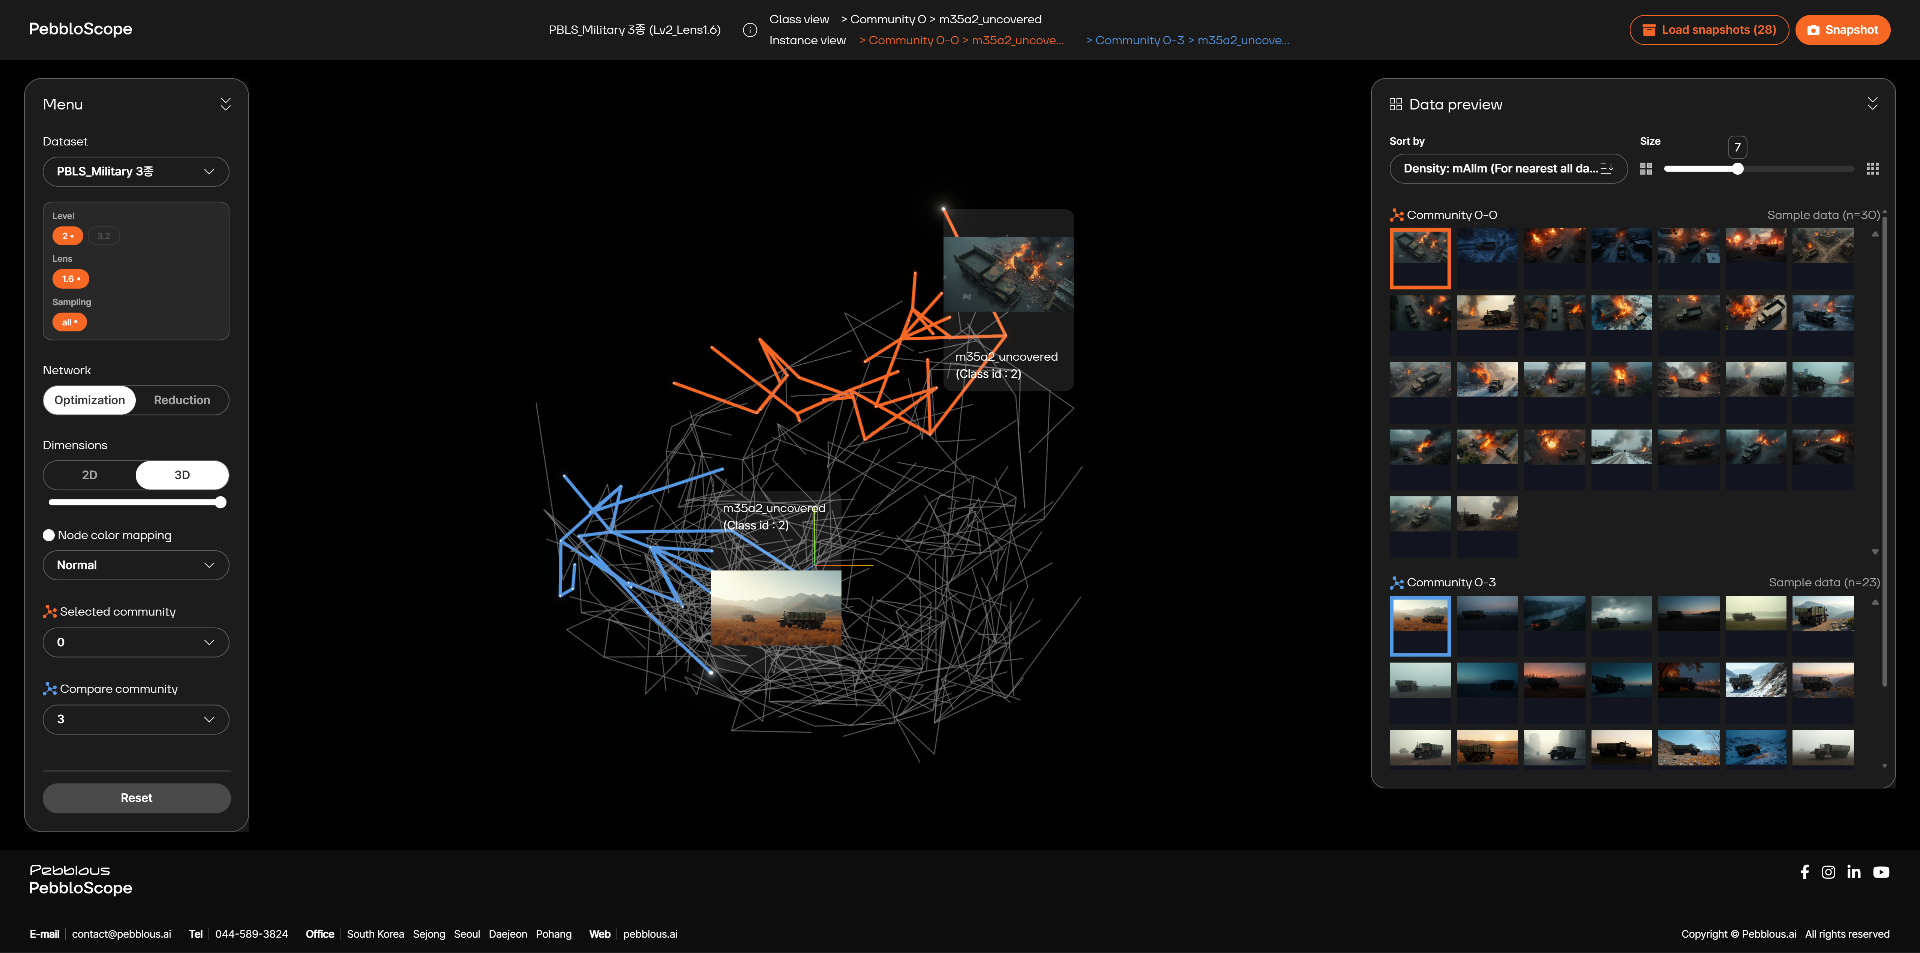
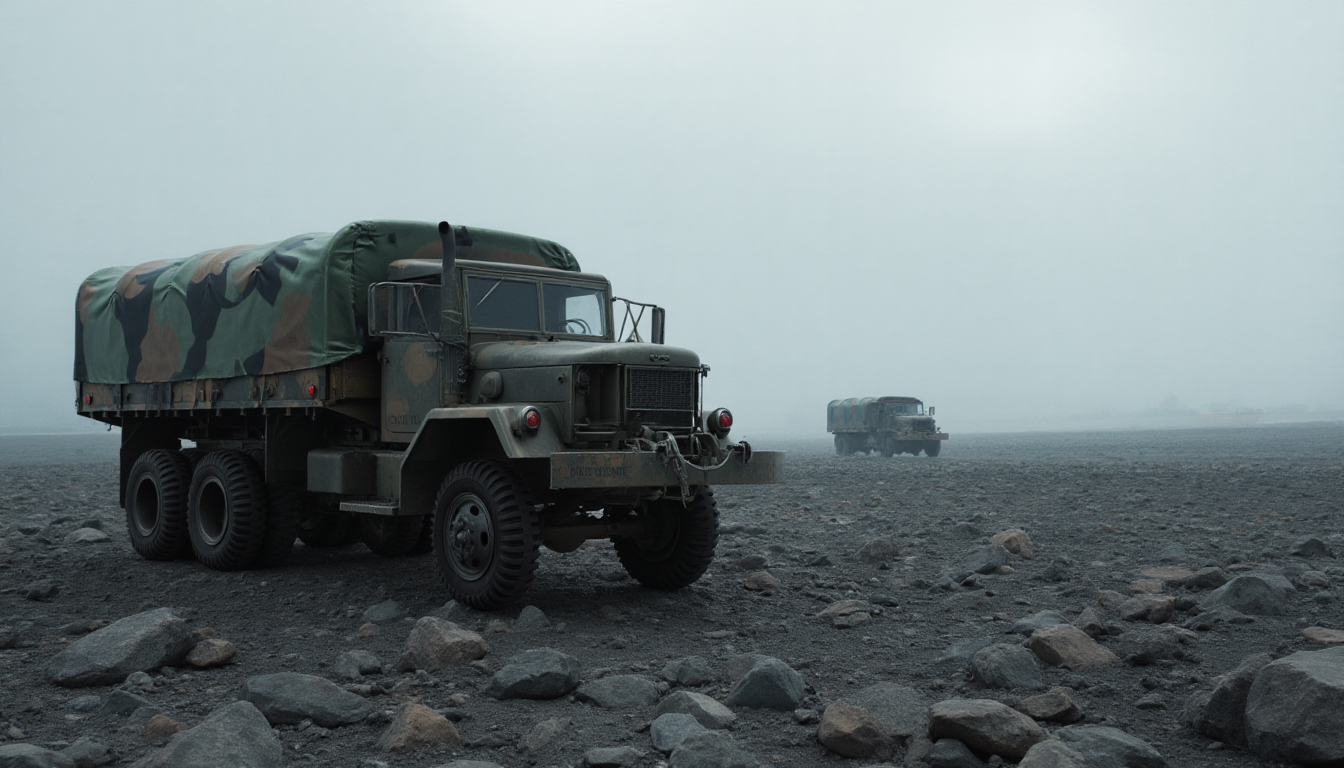
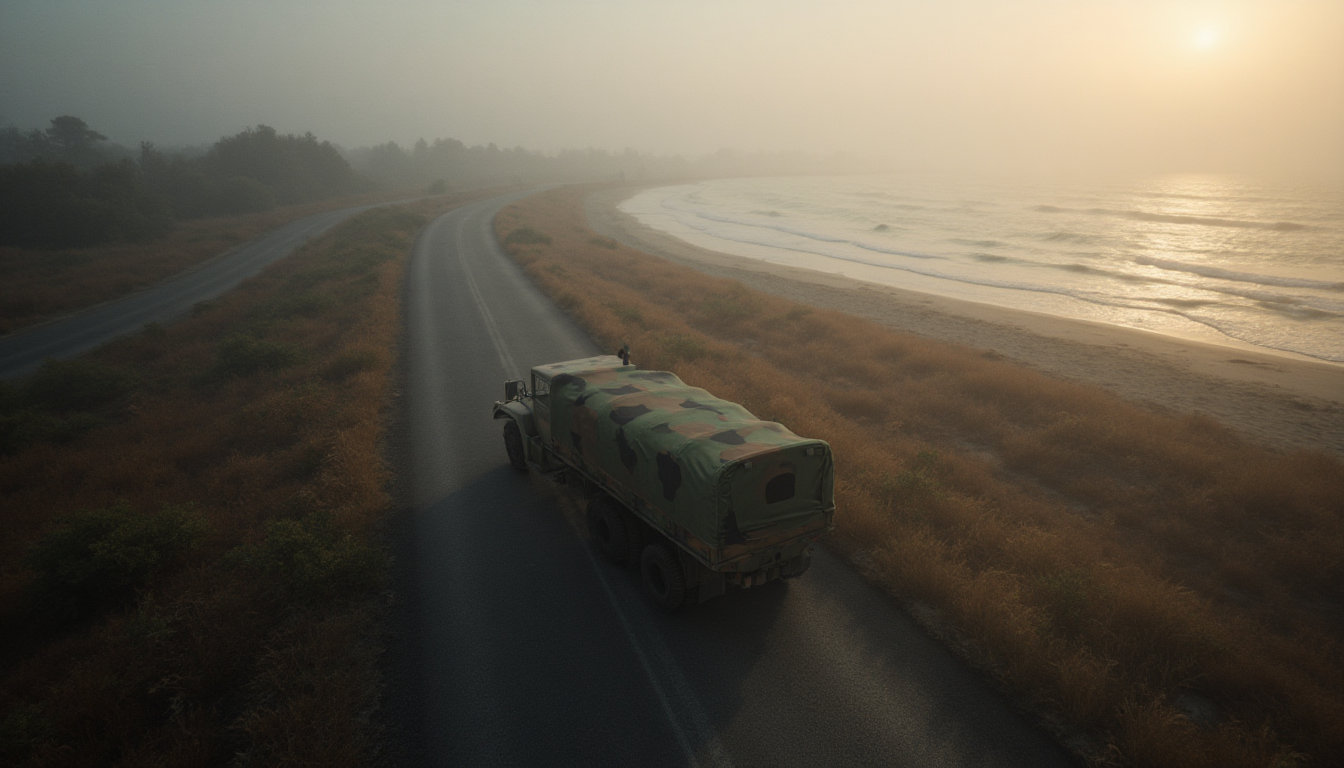
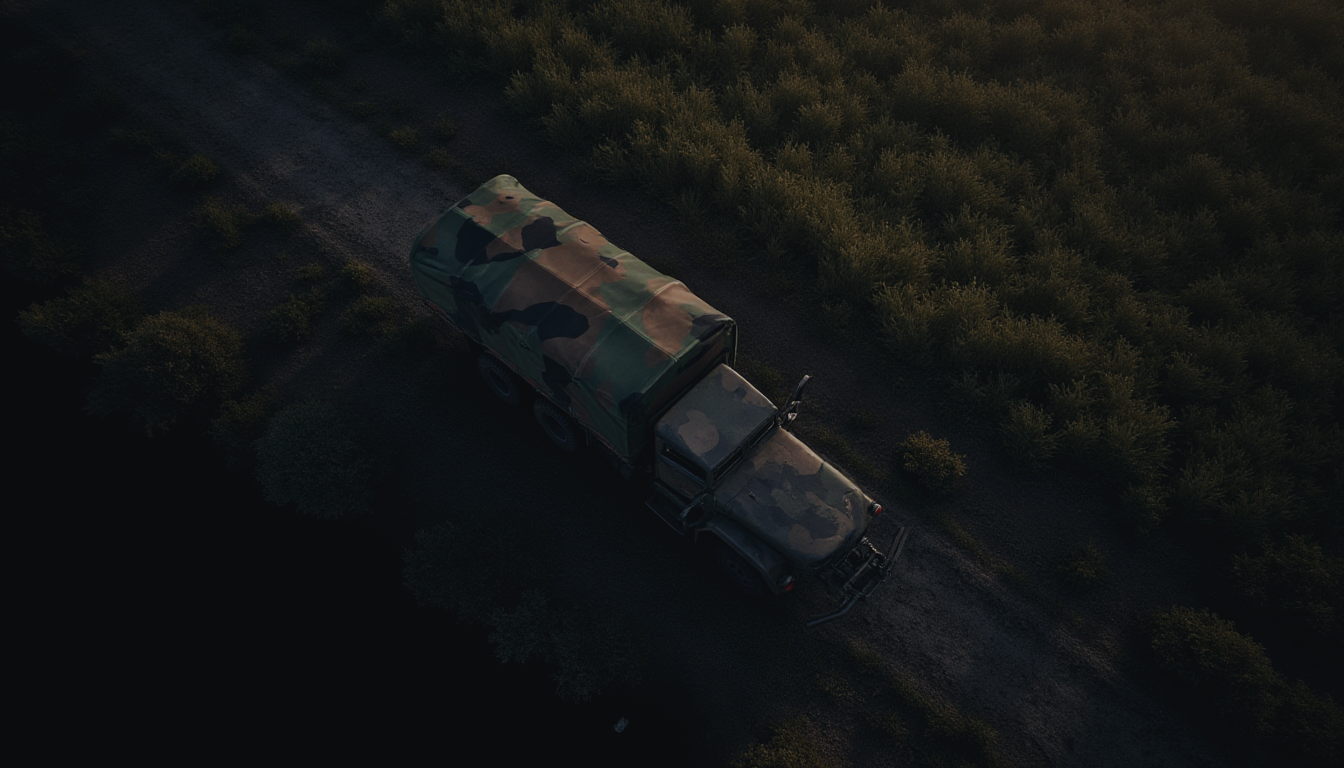
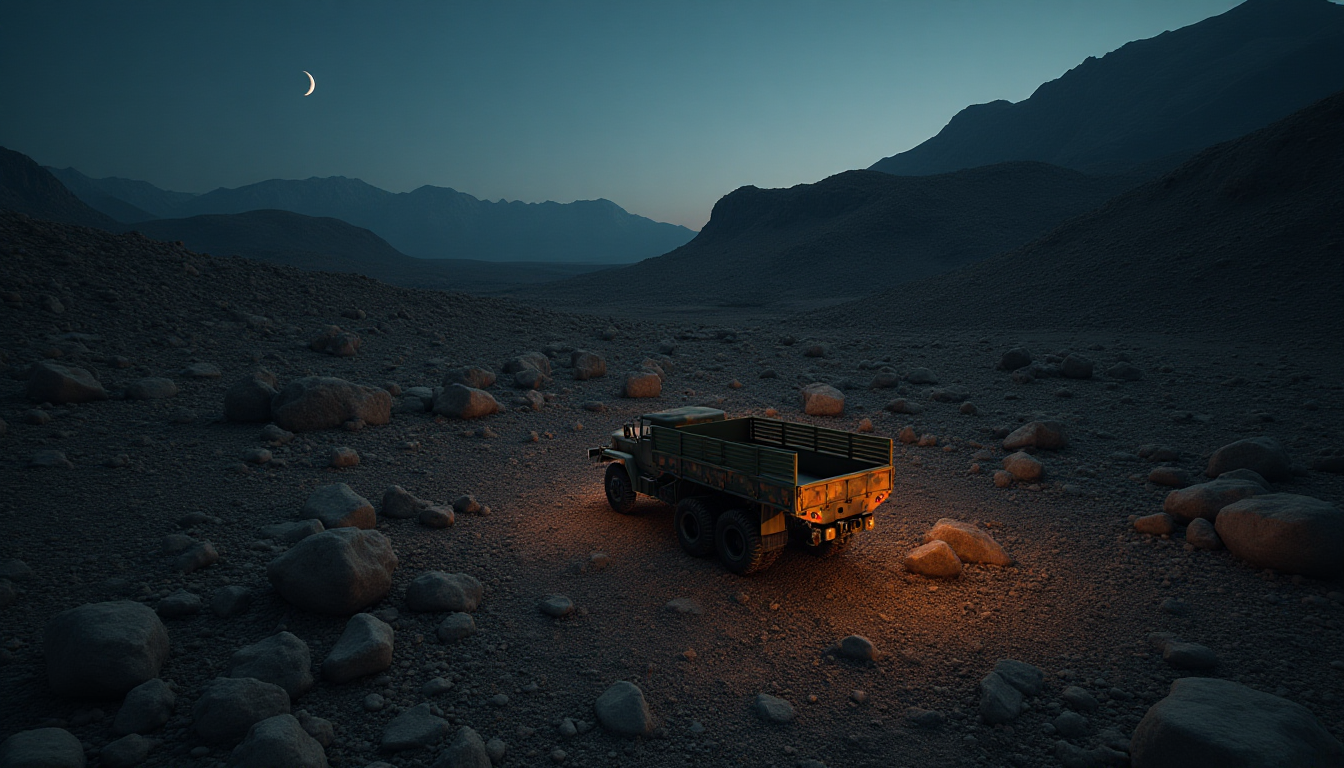
Orange Cluster (Community 0-0, n=30) — Fire/explosion backgrounds. Images captured in night combat environments form an independent cluster at the top of the embedding space.
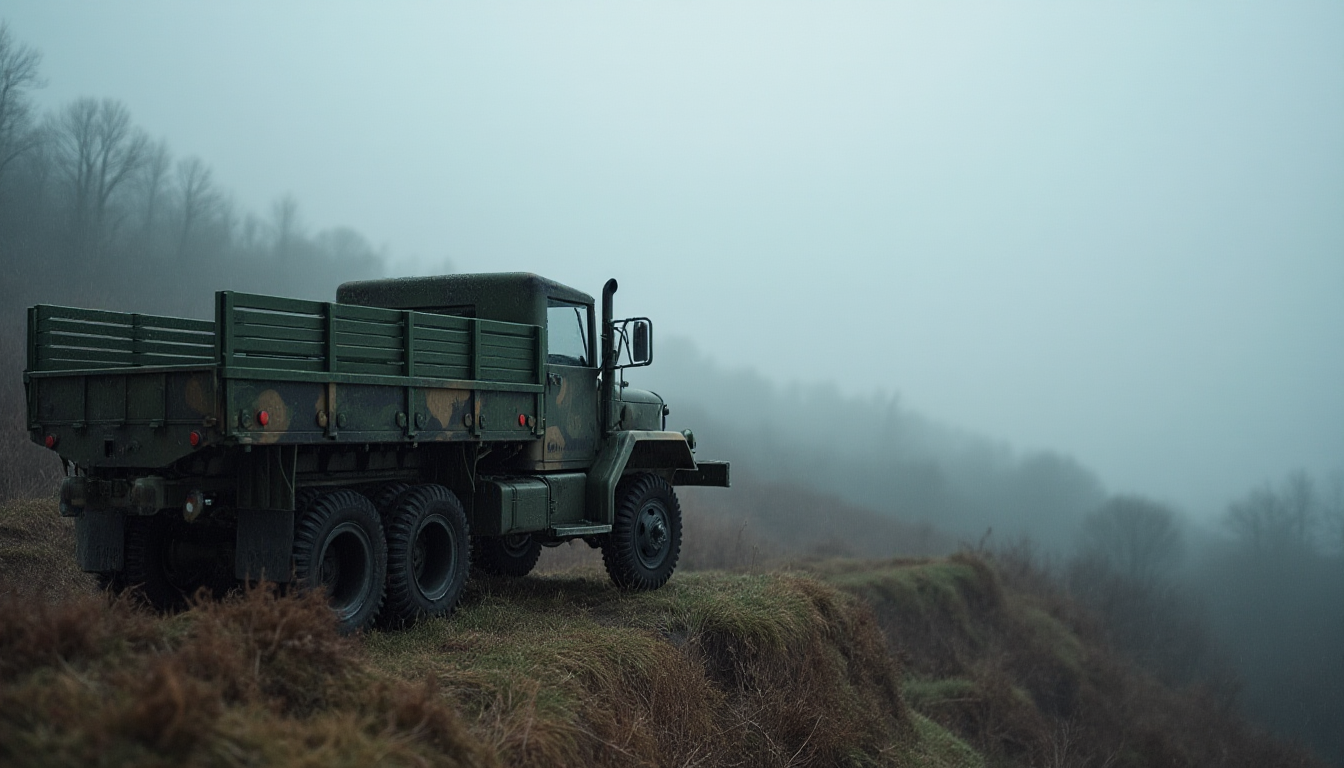
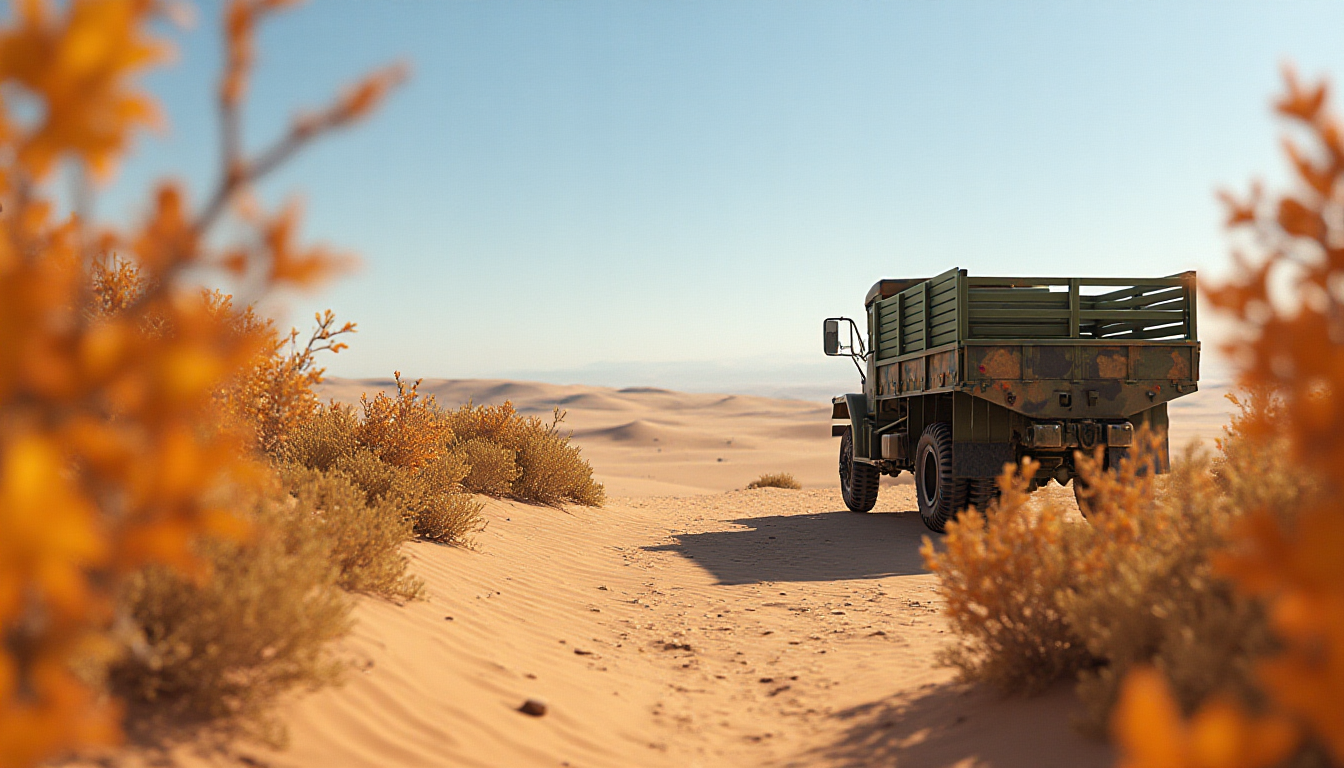
Blue Cluster (Community 0-3, n=23) — Normal backgrounds (grassland, desert, fog). Truck images from daytime/peacetime environments are clustered at the bottom.
▲ Explore this Pebbloscope snapshot directly → Click each node to view the actual image and leave comments for your team.
 Density
Actual
Density
Actual
 Density
Actual
Density
Actual
 Density
Actual
Density
Actual
▲ L2 density (left) + representative image (right). All three classes are multimodal, with camera angle-based subgroups forming separate peaks.
Level 3 — What the Military-Specialized Lens Reveals
Level 3 applies an optimized lens with 265 layers, 40 dimensions, trained on 3 million images. This lens is specialized for the military domain, capturing detailed characteristics that the general lens (L2) missed.
Geometry: Good ↑
The geometry grade that was Medium at L2 rises to Good at L3. The military-specialized lens distinguishes the differences between K9 and M35A2 far more clearly. A single cluster centered on military armored vehicles forms, with mean density of 0.829 and outlier ratio below 7.4%, showing a stable structure.
What this means: if a military-specialized AI trains on this dataset, it is highly likely to correctly distinguish K9 from M35A2 — rather than lumping them together as simply "military vehicles."
Distribution: Poor — Still Multimodal
Distribution remains Poor even at L3. Even through the military lens, camera angle-based sub-clusters exist within the same class. While overall relevance is high, this multimodal structure persists.
 Density
Actual
Density
Actual
 Density
Actual
Density
Actual
 Density
Actual
Density
Actual
▲ L3 density (left) + representative image (right). More compact overall than L2, but the multimodal structure still remains.
Typical vs Outliers — Reading Quality Through Real Images
DataClinic's outlier analysis identifies each class's most typical images (high-density) and most atypical images (low-density). By comparing these two types of actual samples, we can directly see which parameter combinations cause quality issues.
🔫 K9 Howitzer — Typical vs Outliers
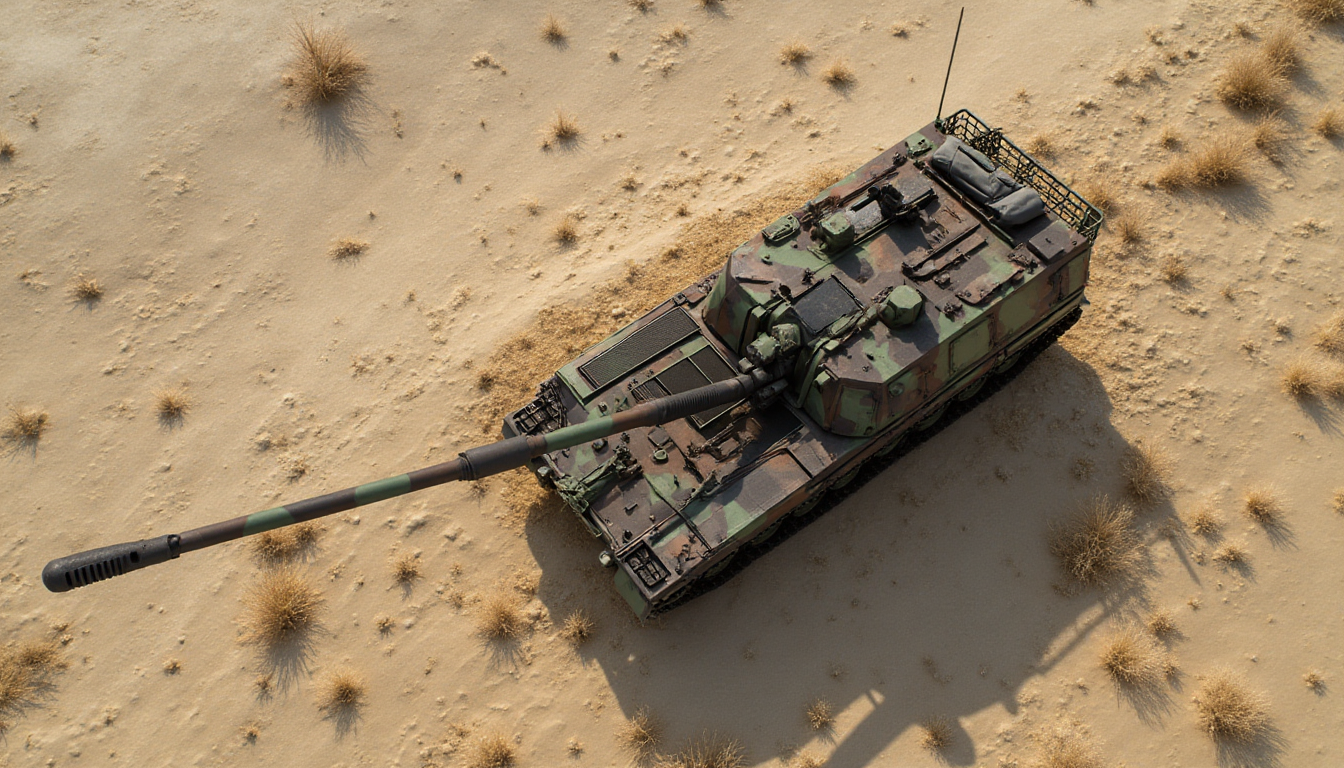
▲ K9 high-density (top) vs low-density (bottom). Low-density images have en1 (extreme lighting/weather) or bg9 (unusual background).
🚛 M35A2 (Covered) — Typical vs Outliers
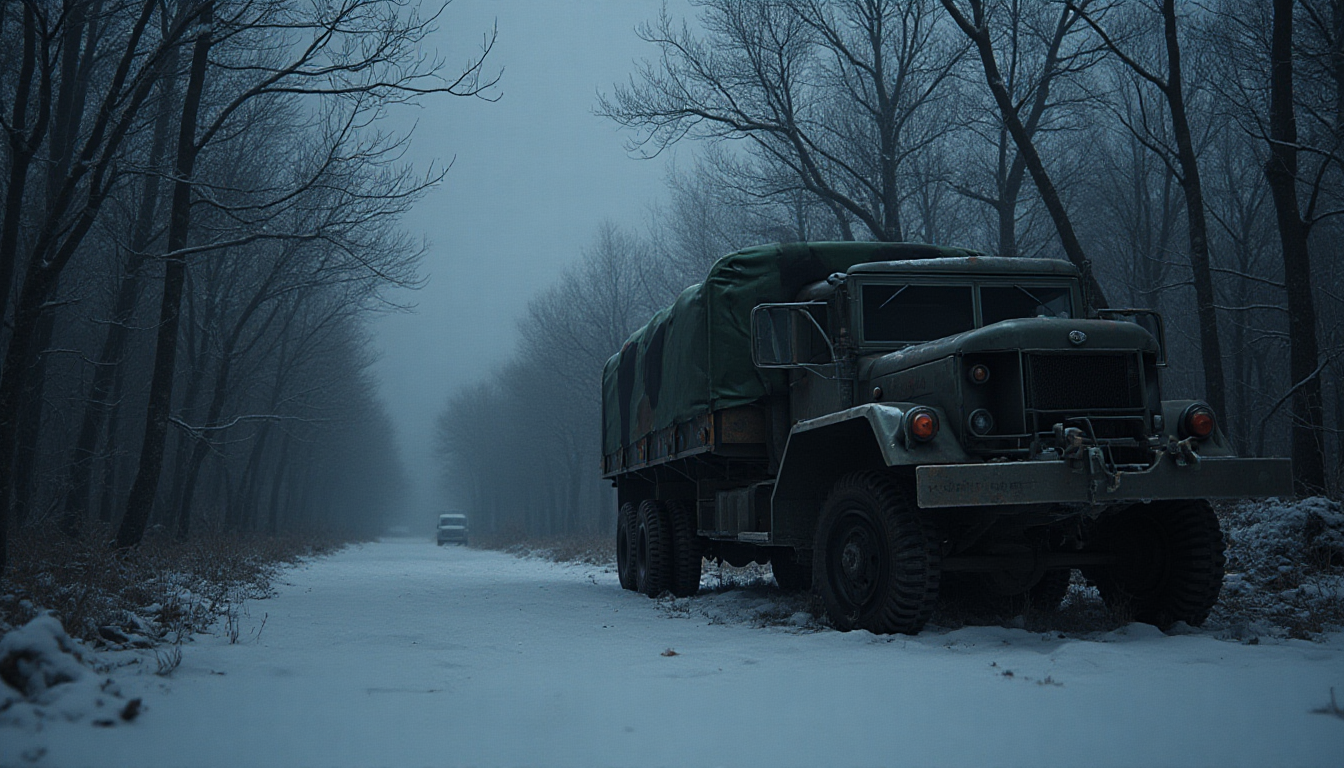
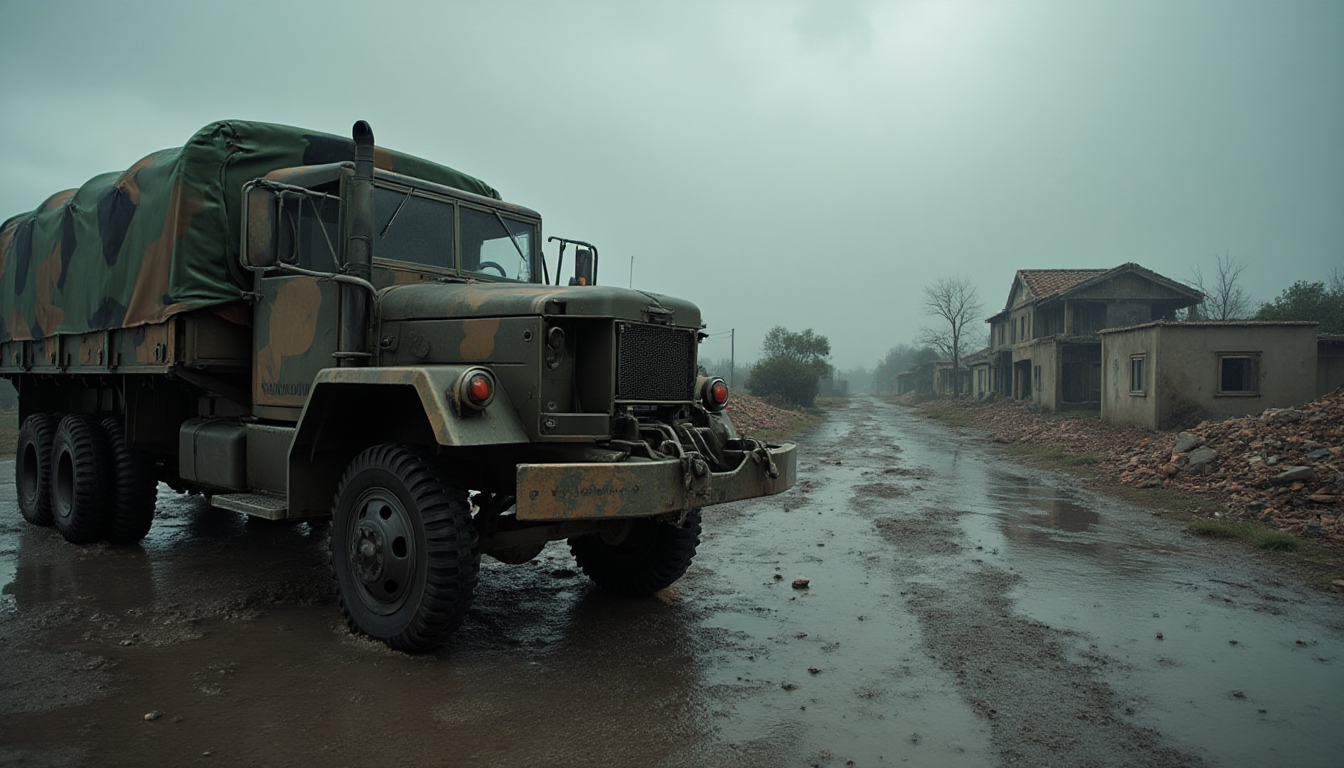
▲ All M35A2 high-density samples are cm1 (front). Low-density samples are cm3 (diagonal)/cm2 (side), confirming that camera angle is the key factor in outlier occurrence.
🚚 M35A2 (Uncovered) — Typical vs Outliers
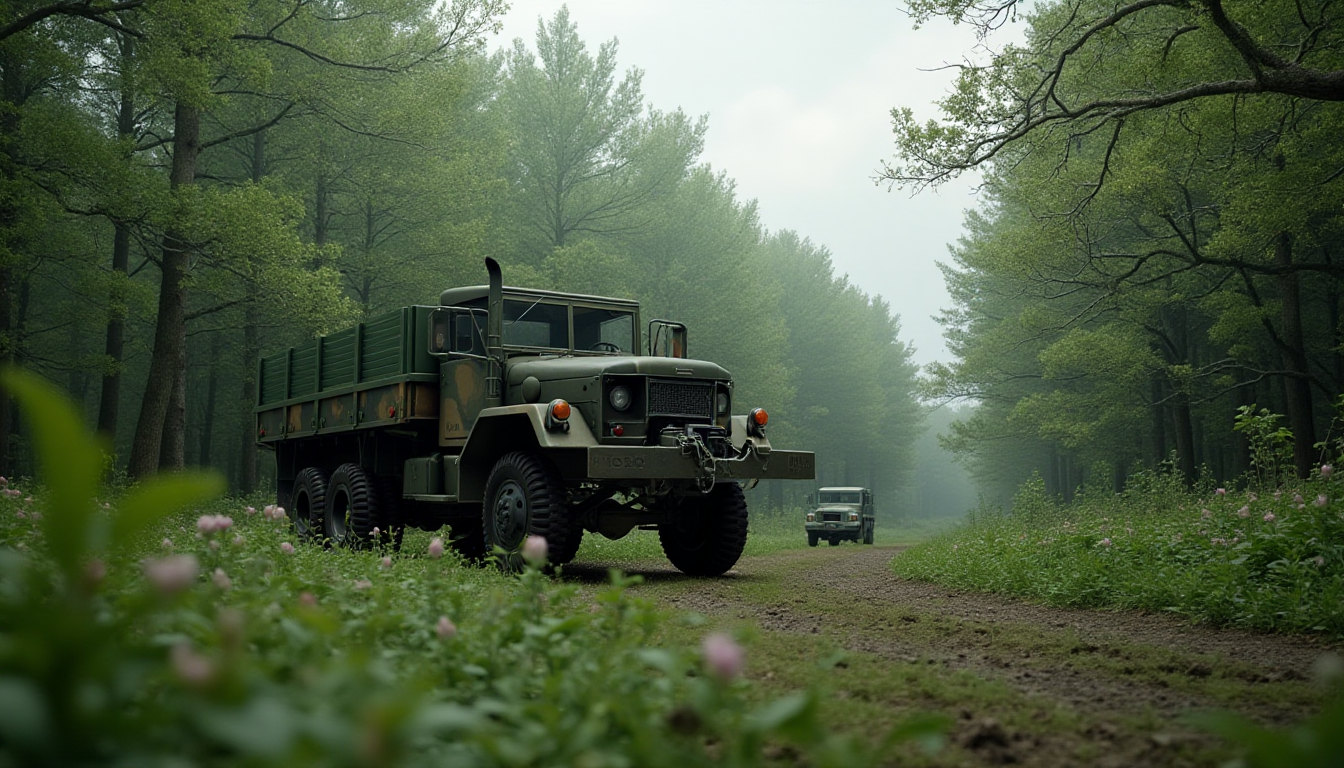
▲ Uncovered truck also shows high-density centered on cm1 (front), while low-density is dominated by cm3/cm2 or en1 combinations.
📊 High-Density vs Low-Density Parameter Pattern Summary
| Category | Camera (cm) | Environment (en) | Background (bg) | Quality Implication |
|---|---|---|---|---|
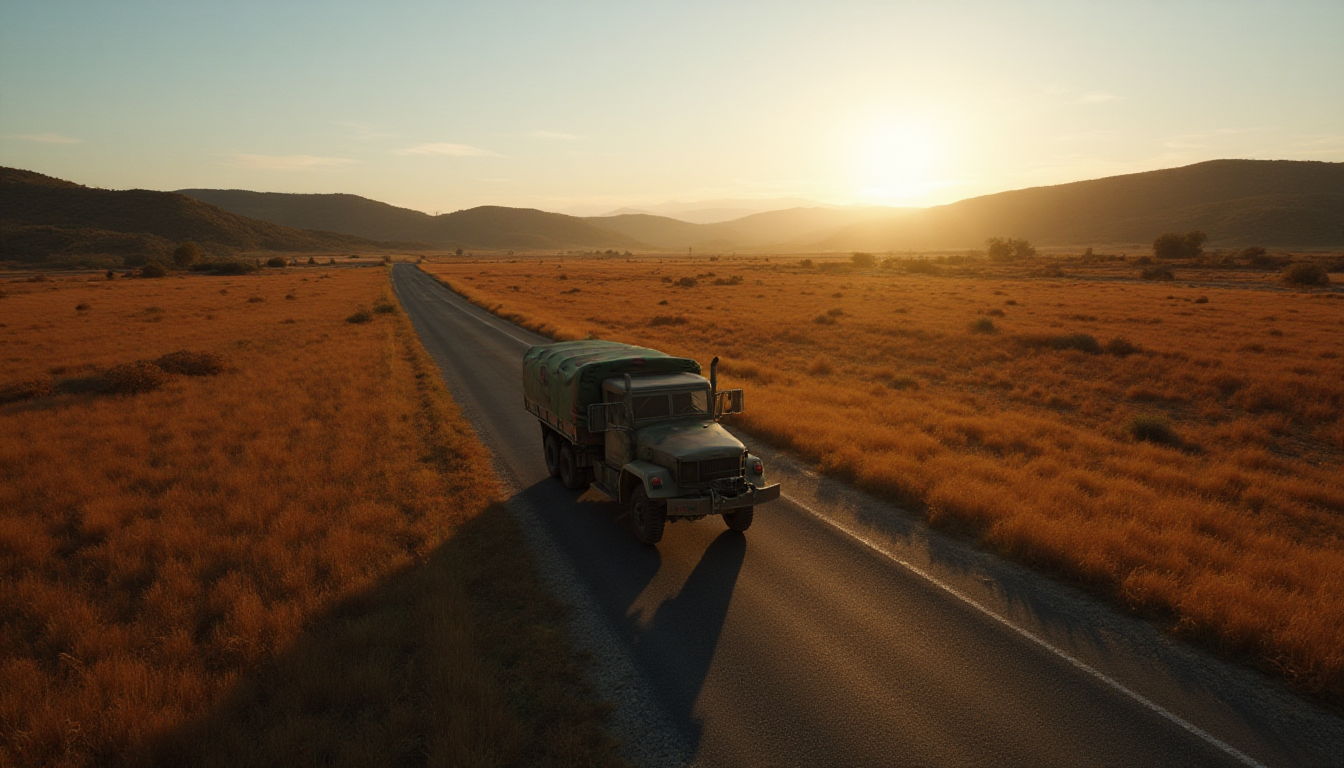
| ✅ High-Density (Typical) | cm1 front-view dominant | en2~en6 (daytime, normal conditions) | bg2~bg6 (natural terrain) | Compact within class → training efficiency ↑ |
| ⚠️ Low-Density (Outlier) | cm3·cm2 diagonal/side | en1 (extreme lighting/night) | bg1·bg7·bg9 (unusual terrain) | Distribution deviation → model confusion ↑ |
This pattern provides an important insight: low-density outliers are not data errors. cm3 (diagonal camera), en1 (extreme environment), and bg9 (unusual background) are all intentionally included synthetic conditions. The issue is that these conditions land far from other images in the feature space.
This presents an important challenge for real-world AI models: equipment captured under night or backlit conditions (en1) or extreme terrain (bg9) may be processed differently from the same equipment photographed in daylight on flat ground. These outlier images must be sufficiently included in the training set to enable robust recognition in real-world conditions.
Improvement Suggestions — From 79 to 90
Combining DataClinic's recommendations with our actual image analysis yields three actionable directions.
① Reinforce Camera Angles
Increase the proportion of cm2/cm3 beyond the current cm1 (front) dominance to expand training opportunities from various observation angles. Adding aerial (top-down) angles would particularly benefit drone recognition.
② Add Extreme Environments
Add more balanced en1 (night/backlit) and bg9 combination images. The goal is not to reduce outliers but to increase images under outlier conditions — real combat always happens at night too.
③ Strengthen M35A2 Pair Training
Increase shared scene (sn)/environment (en) combination images for M35A2 and M35A2_uncovered, strengthening paired image training where only cover status differs. This improves state change recognition accuracy for the same object.
The current dataset has no major defects and can be used for training as-is. However, to improve the L2/L3 Poor distribution, a small-scale additional generation that more evenly balances the number of images per camera angle — the root cause of multimodal clusters — would be effective.
Field Scenario — What If AI Gets It Wrong?
Data quality diagnosis doesn't end with numbers. The real question is: what errors could an AI trained on this data make in the field?
⚠️ Scenario: K9 Howitzer at Diagonal Angle + Extreme Environment
A K9 image in the low-density region (cm3·en1) — AI has barely learned this parameter combination.
Cause: The cm3·en1 combination is a low-density region for both classes — AI hasn't learned this condition enough, reducing its confidence in distinguishing K9 from M35A2.
🔄 The reverse error is also possible
If a low-density M35A2 truck (cm3 diagonal) is misidentified as a high-density K9 howitzer pattern, it leads to threat overestimation — classifying a supply vehicle as combat equipment. Unnecessary engagement alerts could be issued for friendly supply lines, or supply vehicle movements could be delayed. Both directions stem from insufficient learning of low-density parameter combinations.
✅ Solution: Reinforce Low-Density Parameter Combinations
By generating additional K9 images with cm3(diagonal) × en1(extreme environment) combinations, the low-density region gets filled, strengthening the AI's basis for judgment. Among the current 648 images, this combination is extremely rare — it's the key reinforcement point for achieving the target score of 85+.
Reinforcing low-density parameter combinations doesn't just improve scores — it directly strengthens AI's judgment in nighttime and extreme environments.
Conclusion
PBLS_Military 3-Class is a focused synthetic military dataset. It captures the tactical pair of K9 self-propelled howitzer and M35A2 trucks (covered/uncovered) with perfect class balance, and has secured solid basic quality with all L1 items rated Good.
The factor behind the DataClinic score of 79 is a multimodal distribution stemming from intentional diversity. Camera angle (cm), extreme environment (en1), and unusual background (bg9) are all intentionally included parameters, but they create separate clusters under both the general neural network lens and the military-specialized lens. This is not a defect but a design choice reflecting real-world environmental diversity.
In this analysis, we directly examined DataClinic's high-density and low-density samples as actual images. High-density (typical) is dominated by cm1/daytime environment combinations, while low-density (outliers) is dominated by cm3/night/unusual terrain combinations. Knowing this pattern makes it clear which parameter combinations to reinforce in the next synthetic data generation.
| Item | Result | One-Line Assessment |
|---|---|---|
| DataClinic Score | Quality score 79 (Medium) | 11 points above 10-class (68), target is 85+ |
| Class Balance | SD = 0.0 | Textbook-perfect synthetic data balance |
| L1 Quality | All items Good | Solid basic fitness |
| L2/L3 Distribution | Poor (multimodal) | Camera angle clusters = side effect of intentional diversity |
| Outlier Ratio | L3 below 7.4% | Stable, mainly from night/unusual terrain combinations |
| Key Improvement | Reinforce cm2/cm3 | Camera angle balancing to mitigate multimodal pattern |
The full DataClinic Diagnosis Report #225 for this dataset is available on DataClinic. Reading it in comparison with the 10-class version (#224) provides a deeper understanding of the design philosophy behind synthetic military datasets.