Executive Summary
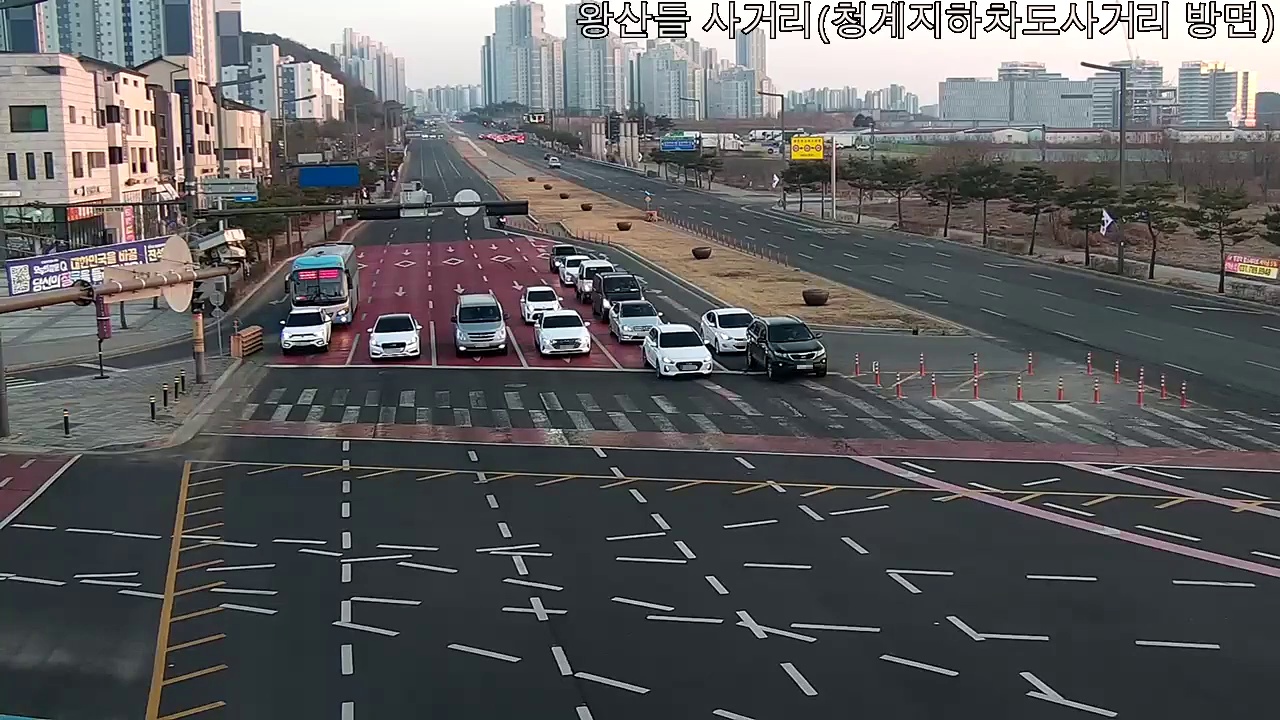
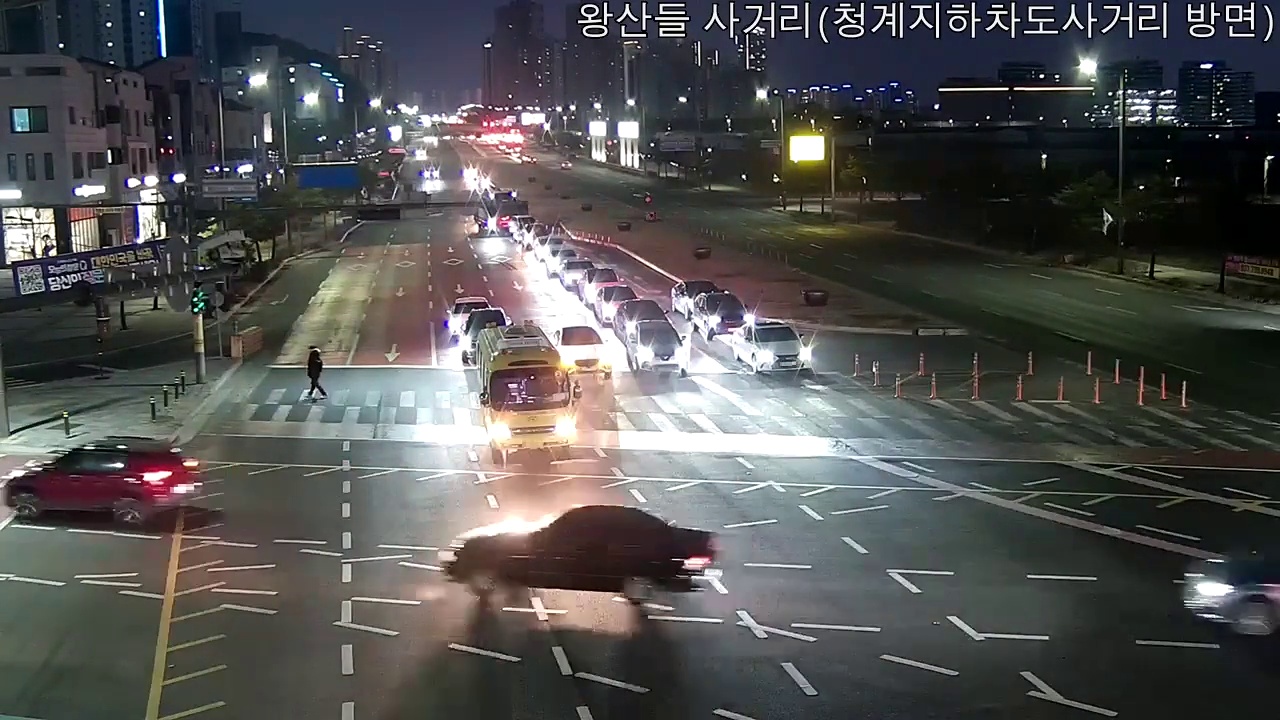
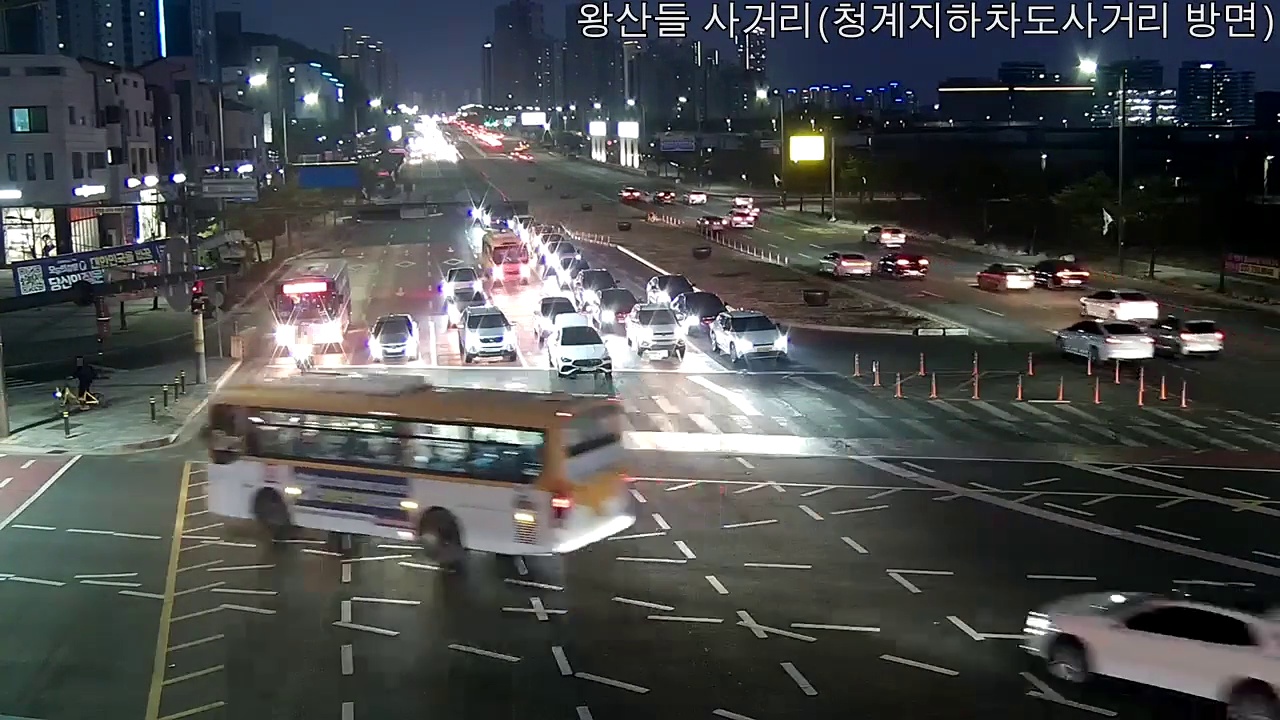
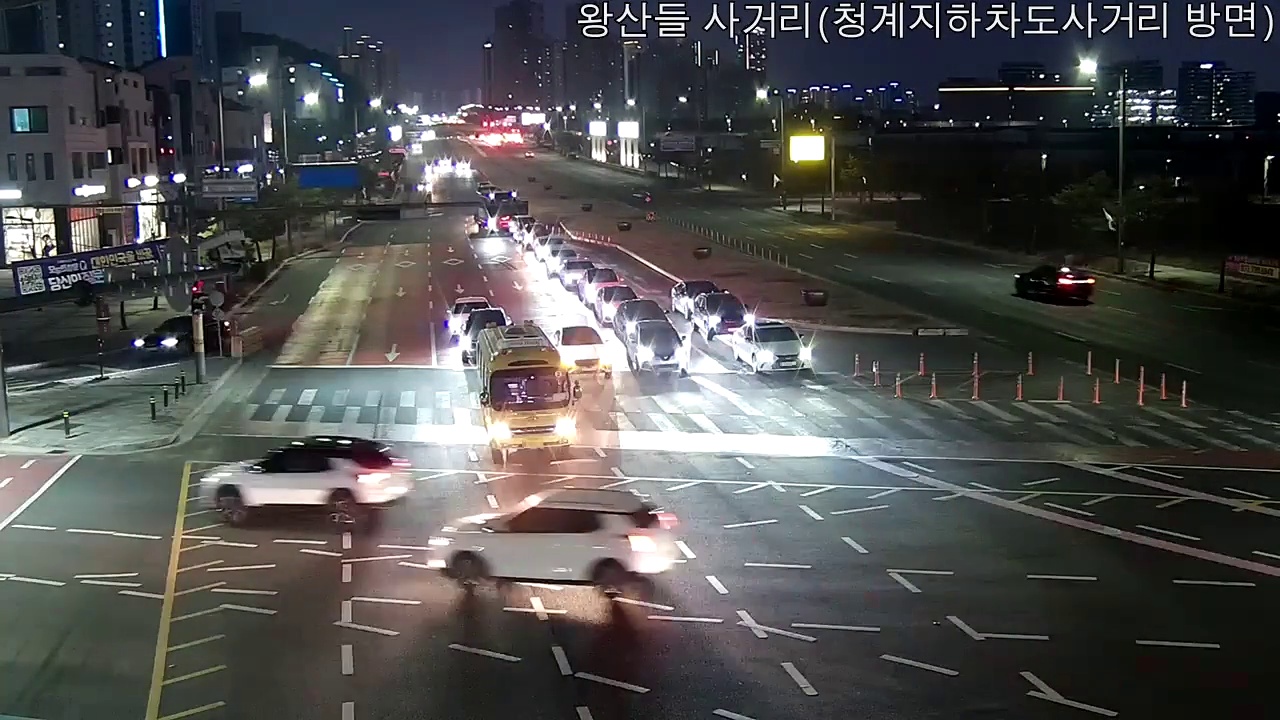
This article is based on the diagnostic results of DataClinic Report #204. When 61,545 traffic video frames captured by a fixed CCTV at Wangsandeul Intersection are viewed through an AI lens, a single intersection splits into two entirely different data distributions. Daytime shows a clear, quiet road under natural light; nighttime reveals a completely different scene flooded with headlight glare and dense traffic.
This bifurcation is not just a dataset characteristic -- it is a training hazard. If an autonomous driving perception AI is trained on this data, it learns "intersection = bright, empty daytime road" and its recognition performance collapses at night. On top of this, the sheer volume of 60,000 frames poses a video frame overfitting risk, where quantity becomes a liability rather than an asset.
Even in a single-class, unlabeled dataset, DataClinic precisely captures environmental sub-structures. This case makes a compelling argument: data itself must be diagnosed before it is fed into training.
Dataset Overview — 60,000 Frames from a Single Intersection
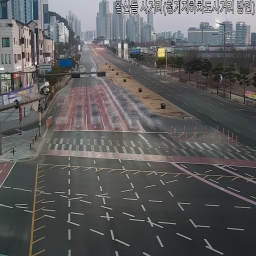
Wangsandeul Intersection is a four-way junction in South Korea, monitored around the clock by a fixed CCTV camera positioned toward Cheonggye Underpass. The dataset, provided by the Korea Public Traffic Video Analysis Association, consists of 61,545 frames extracted from this camera. Each frame is 1280x720 RGB, totaling approximately 20 GB.
What makes this dataset unusual is that it has no labels. There are no bounding boxes for vehicles, pedestrians, or traffic lights -- just a single class of raw frames. So does unlabeled data even need diagnosis? DataClinic examines the internal structure of data without relying on labels at all.
Below is the collage generated by DataClinic. It shows representative samples from across the 61,545 frames. Even though every image was shot at the same intersection, you can immediately spot the mix of bright daytime and dark nighttime scenes.
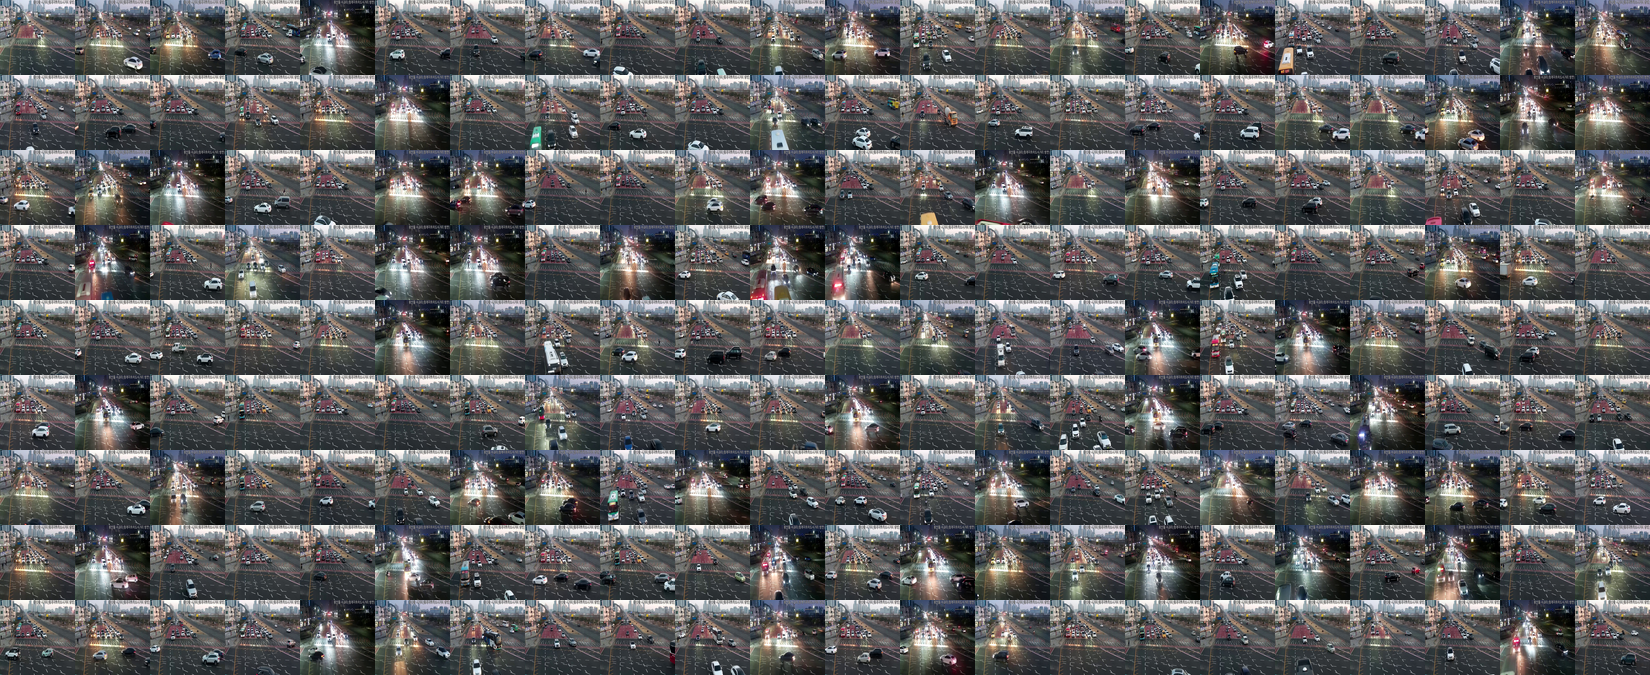
DataClinic collage — representative samples from 61,545 frames at Wangsandeul Intersection
| Item | Value |
|---|---|
| Dataset Name | 2502_Wangsandeul Intersection (Korea Public Traffic Video Analysis Association) |
| Report ID / Dataset ID | #204 / 599 |
| Image Count | 61,545 |
| Resolution | 1280 x 720 (RGB) |
| Size | ~20 GB |
| Classes | Single (unlabeled) |
| Source | Korea Public Traffic Video Analysis Association |
| Camera | Fixed CCTV (Wangsandeul Intersection, toward Cheonggye Underpass) |
L1: Perfect Integrity — So Why Diagnose Further?
DataClinic Level 1 checks basic data integrity: image dimensions, channel count, missing values, and class balance. The Wangsandeul dataset passes this stage cleanly. All 61,545 images are consistently 1280x720 RGB with zero missing values, and as a single-class dataset, there is no imbalance to speak of.
If L1 is clean, why dig deeper? The answer lies in the Mean Image. When you average all 60,000 frames pixel by pixel, what stays constant and what changes become strikingly clear.
In the mean image below, lane markings and road geometry remain sharp, while vehicles appear as ghostly blurs. Lane markings are the static background; vehicles are the ever-shifting foreground. In other words, this dataset contains "things that never change" and "things that always change" in coexistence -- and their ratio directly determines AI training quality.
Overall mean image — lane markings stay sharp while vehicles dissolve into ghosts
What the mean image tells us: The ghostly vehicles mean "their position is never constant," while the crisp lane markings mean "they are identical in every single frame." From the AI's perspective, lane markings are a persistent signal and vehicles are perpetual noise. Without understanding this structure, you might judge data quality by volume alone -- a costly mistake.
L2: Two Worlds Through the AI Lens
Level 2 analyzes the data through the eyes of a pre-trained general-purpose AI model (ImageNet-based). Each image is projected into a high-dimensional embedding space, then compressed to 2D via PCA to reveal the overall data structure.
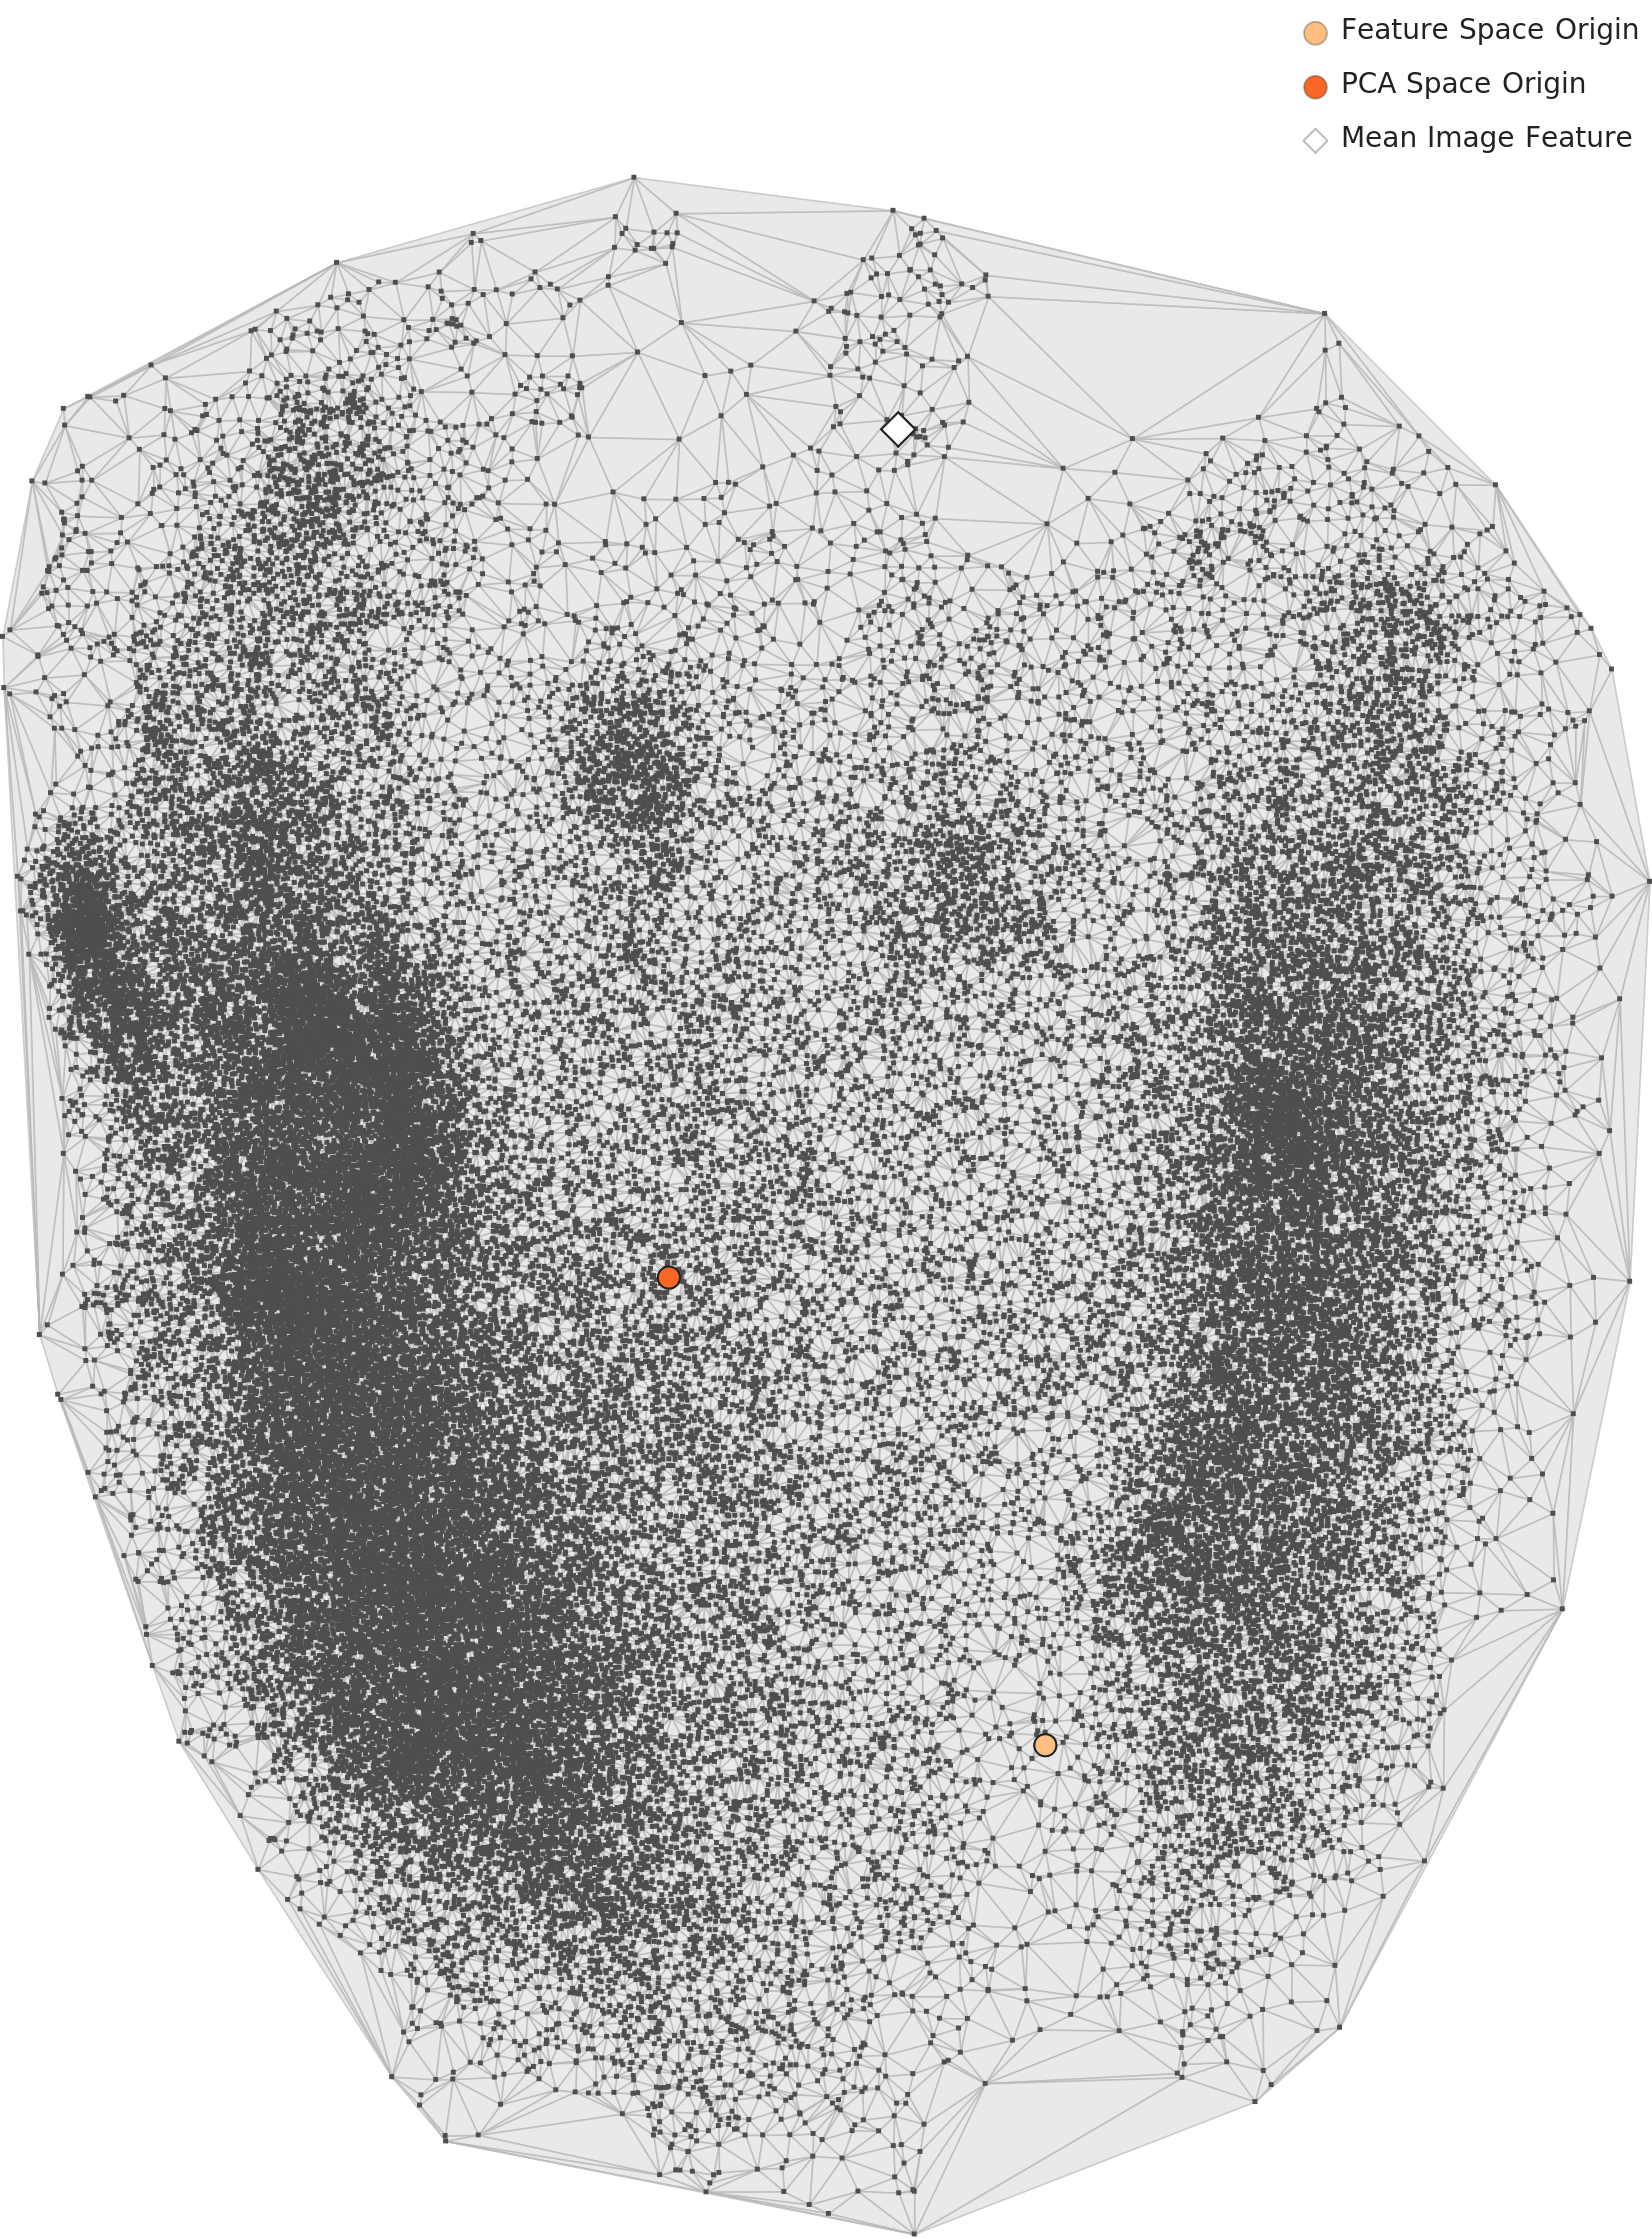
3.1 PCA Distribution — Two Clusters Split Apart
The L2 PCA chart below tells a striking story: the 60,000 frames separate into two distinct clusters. One intersection, one camera -- yet AI sees two entirely different places. The left cluster is daytime imagery; the right cluster is nighttime.
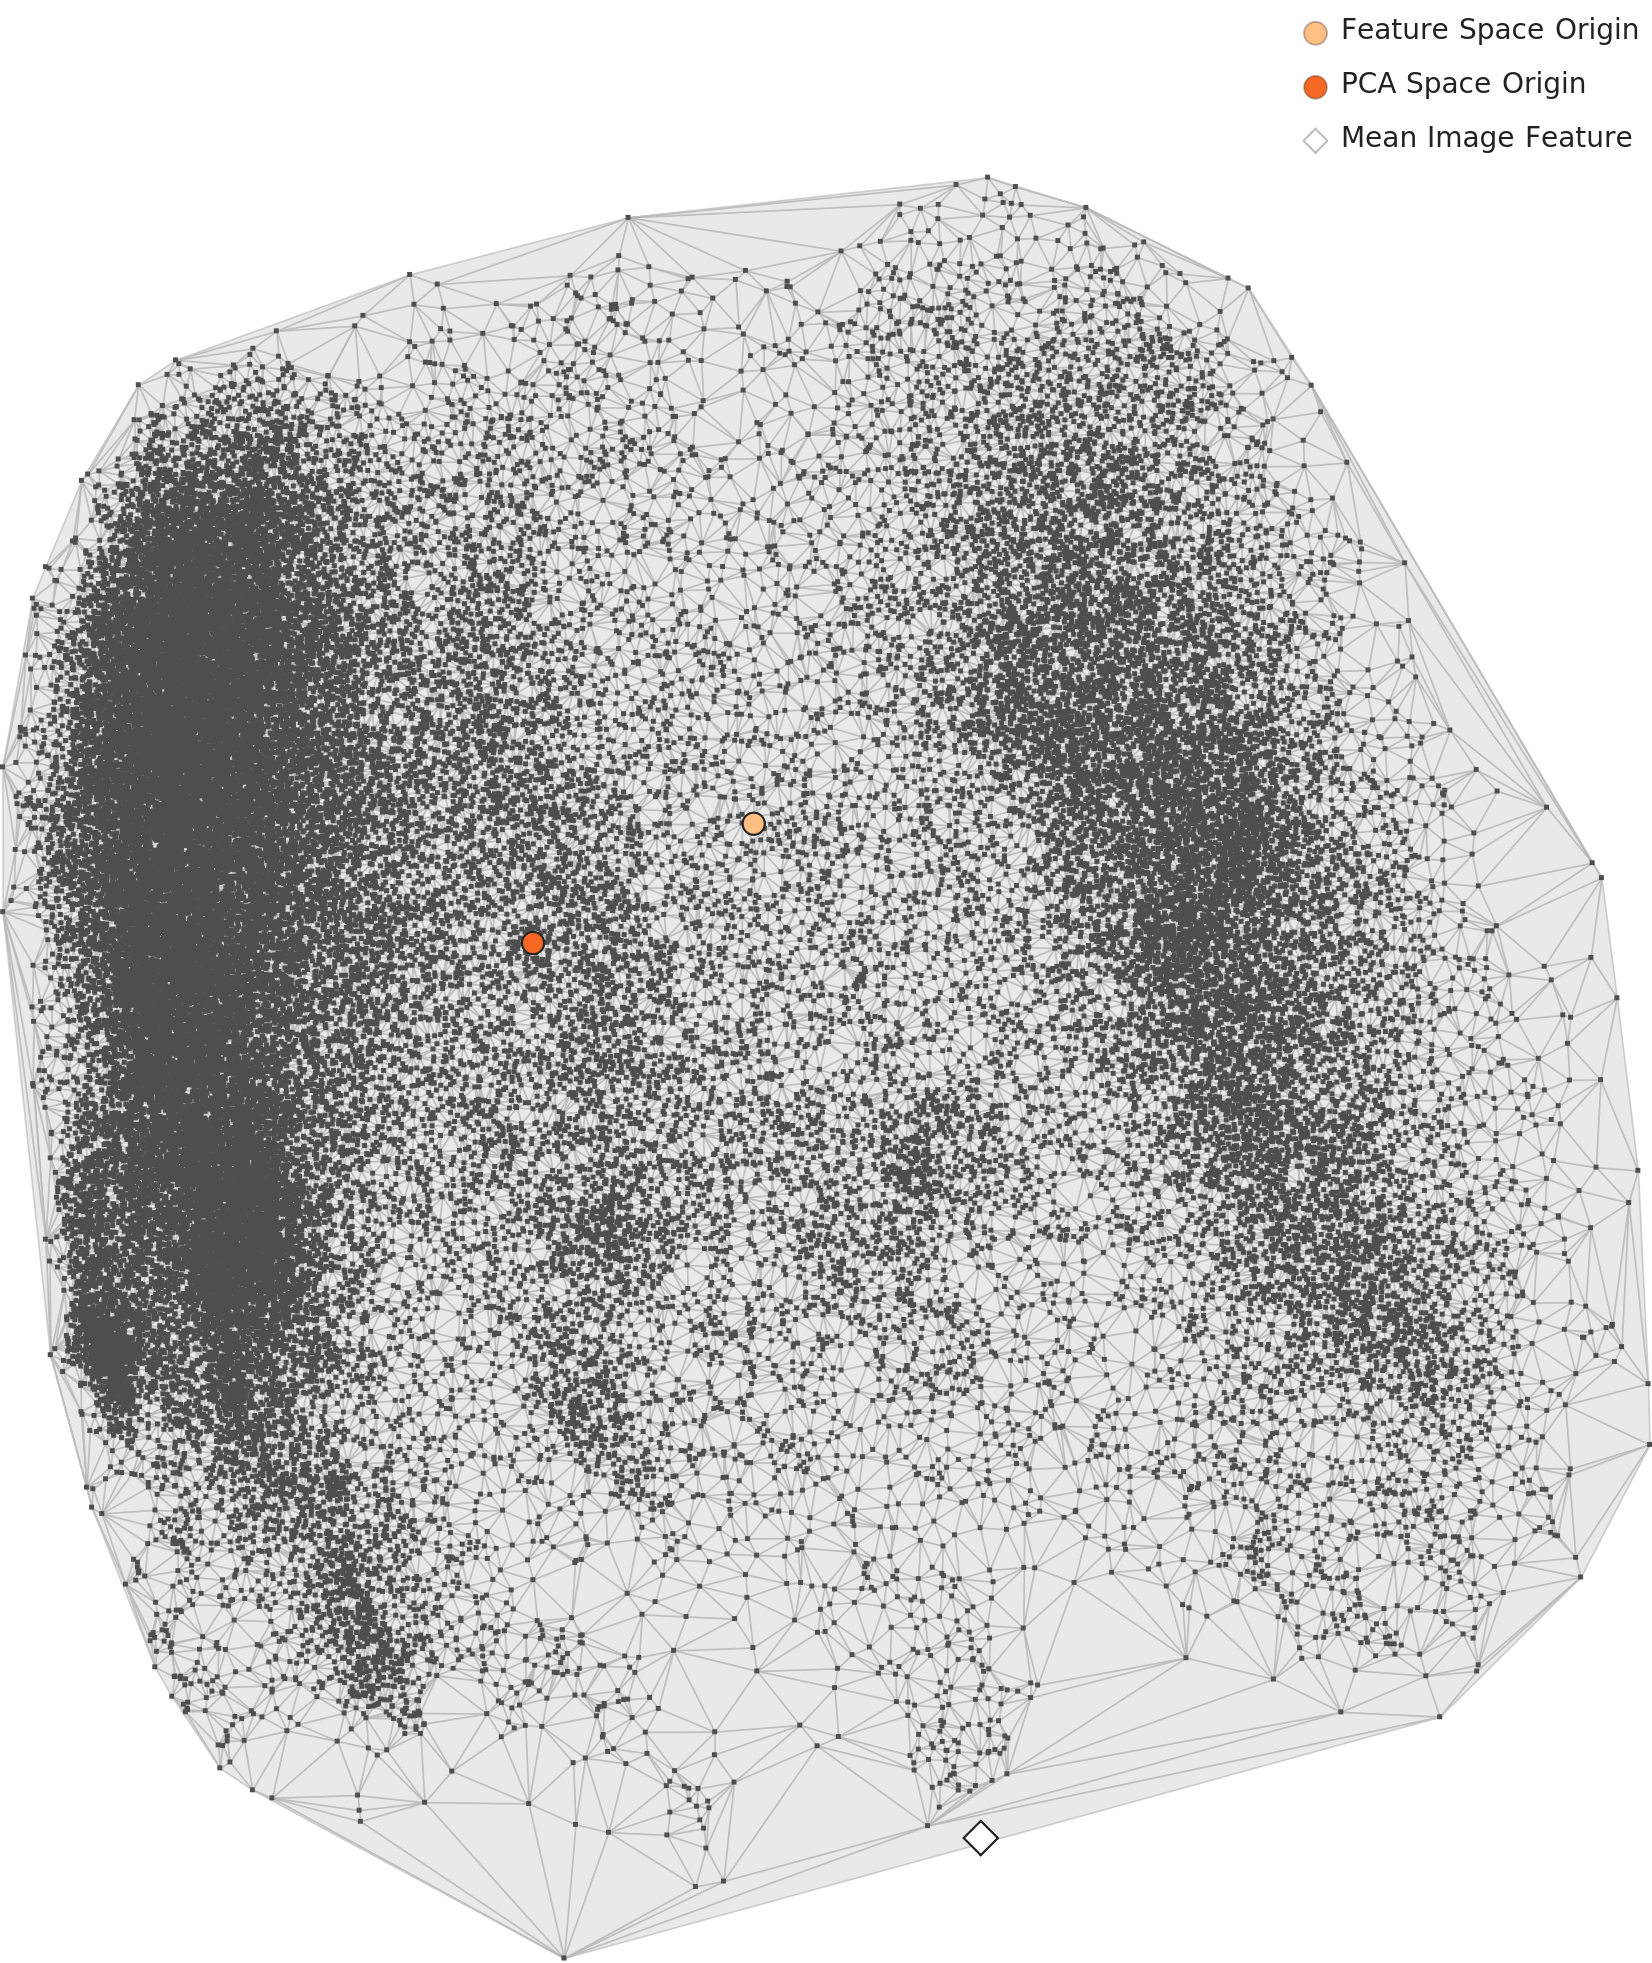
L2 PCA distribution — data splits into two distinct clusters
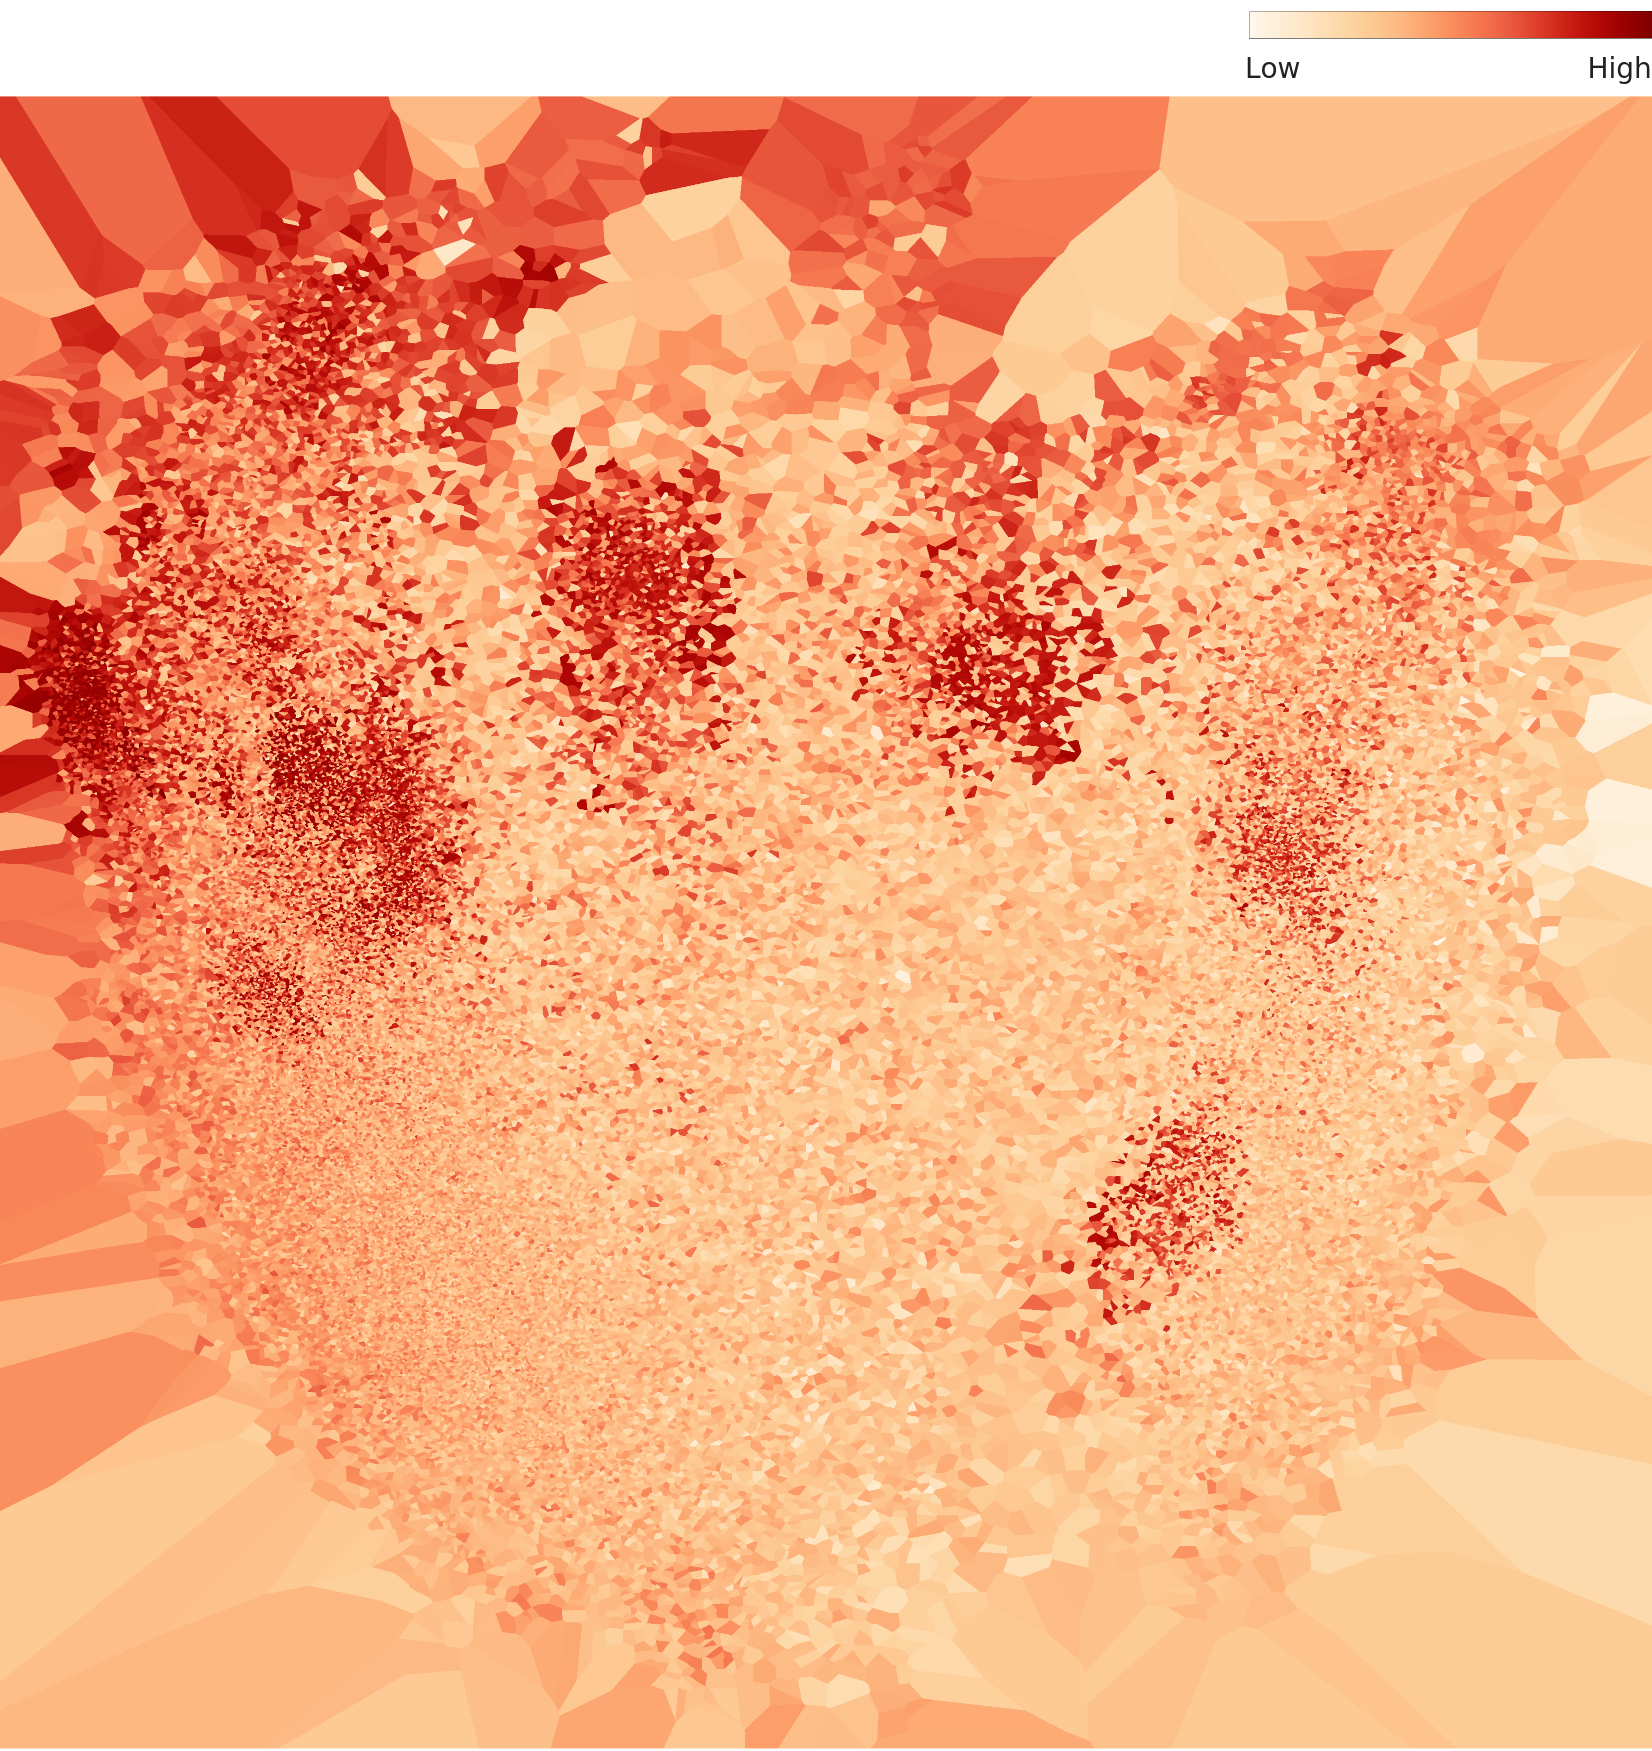
3.2 Density Distribution — Hotspots and Periphery
The density chart shows how tightly images cluster in embedding space. Two or more high-density hotspots appear, separated by a low-density periphery. This means the data distribution is not continuous -- it has a discontinuous gap between two populations.
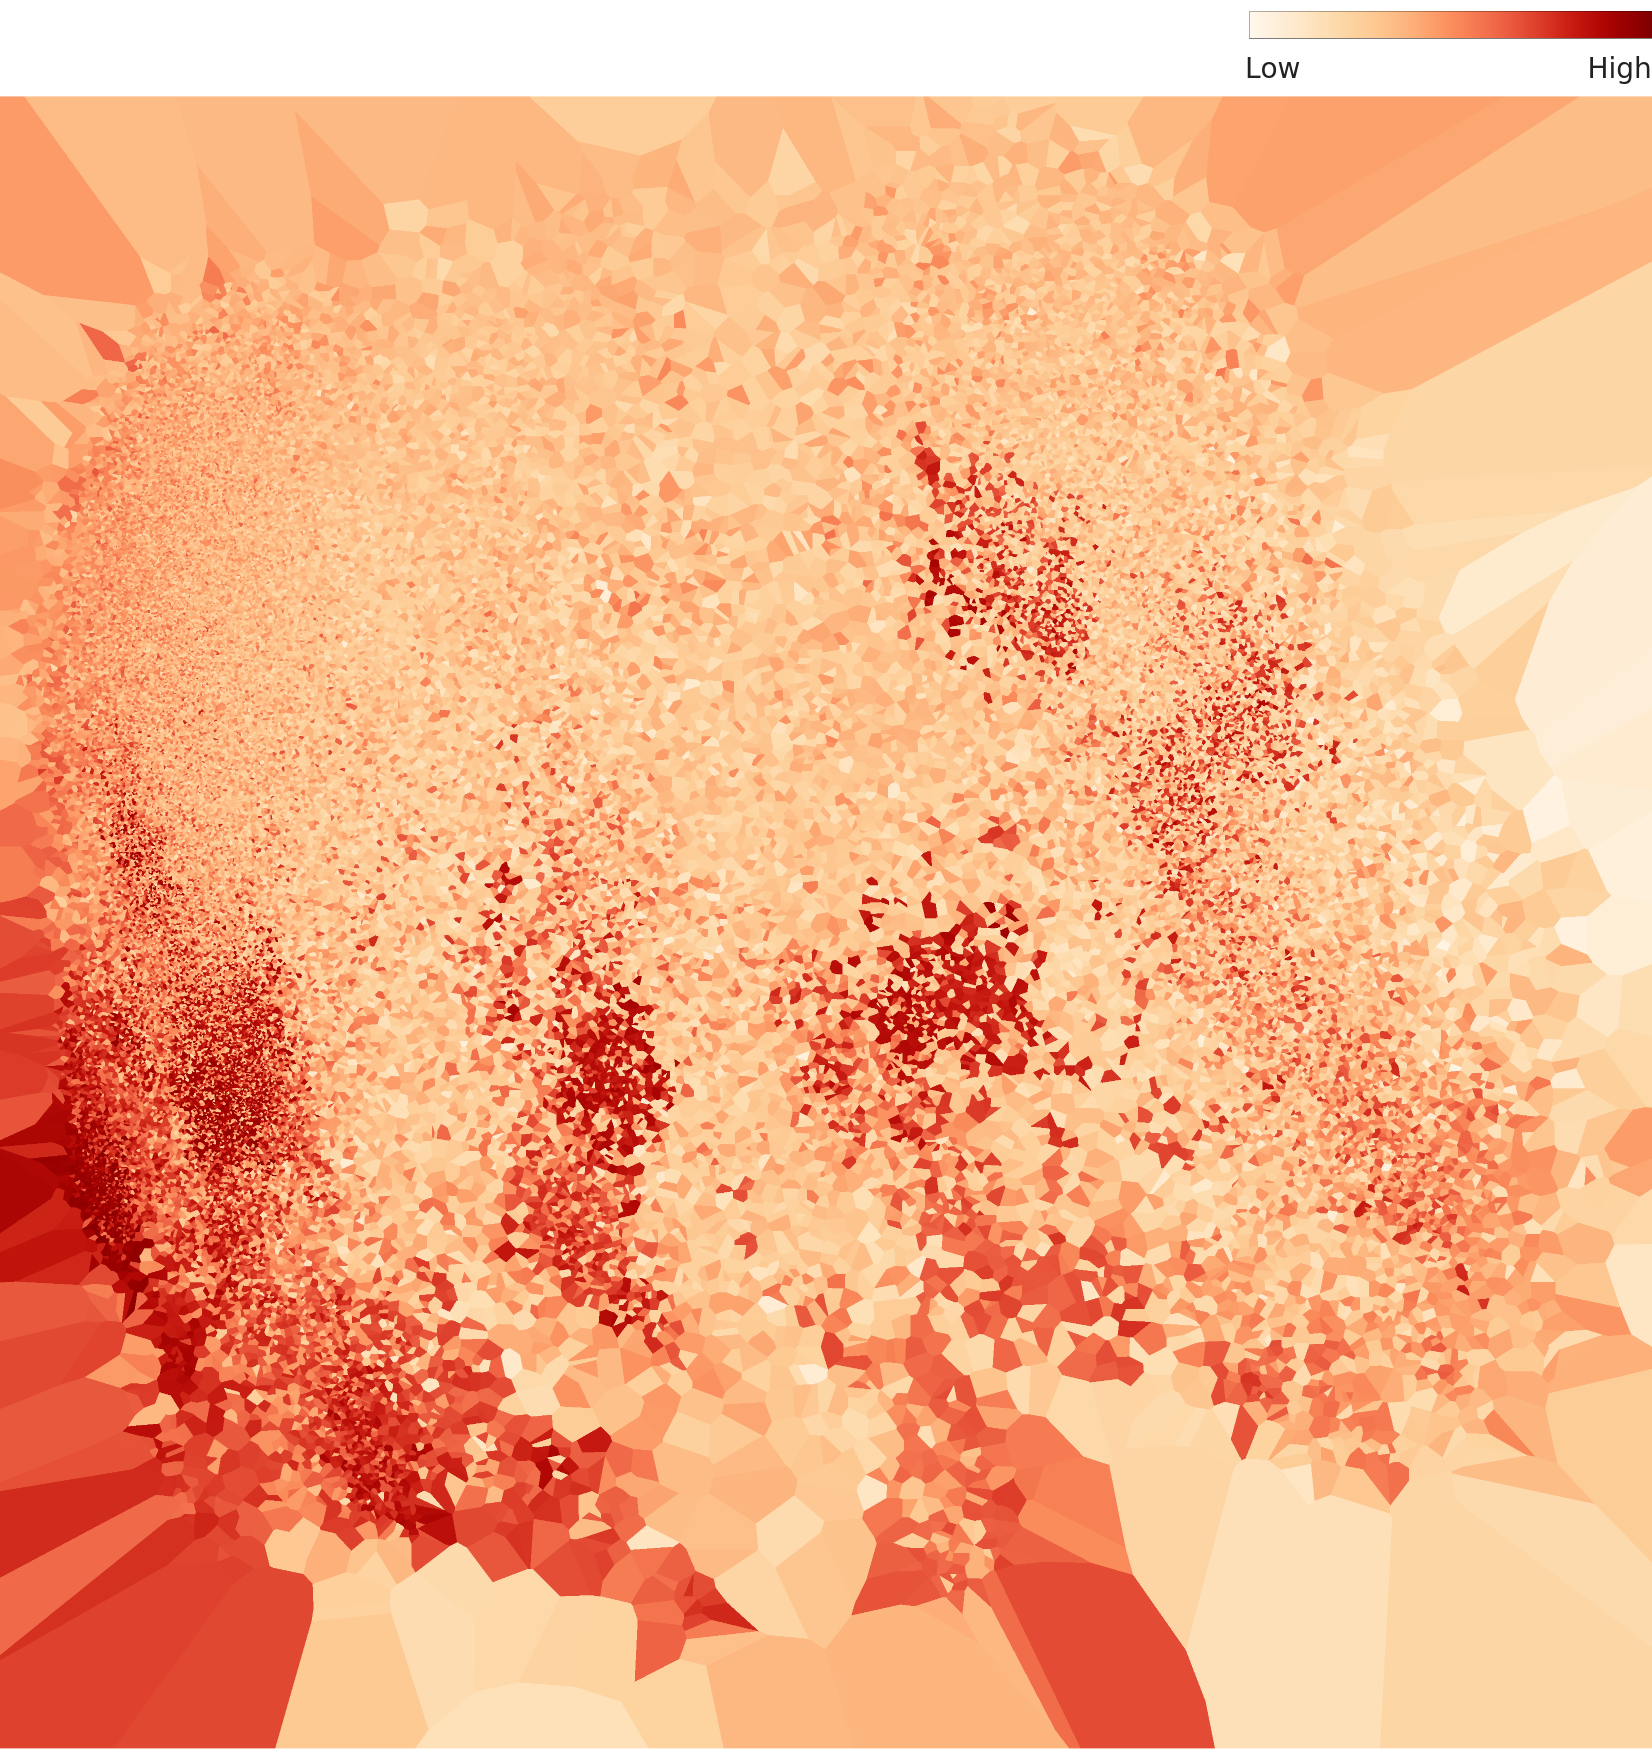
L2 density distribution — a low-density gap separates the hotspots
3.3 High Density vs. Low Density — Day and Night Side by Side
To see what these clusters actually look like, we compare the highest-density images (typical) with the lowest-density images (outliers). High-density samples are daytime shots: clear weather, sparse traffic, crisp lane markings. Low-density samples are nighttime scenes: headlight glare, dense vehicle clusters, pedestrians crossing.
High Density Samples (Daytime, Typical)


Low Density Samples (Nighttime, Outliers)
Top: daytime high-density samples (typical) / Bottom: nighttime low-density samples (outliers) — two completely different faces of the same intersection
Key finding: Same CCTV, same intersection -- yet in the AI embedding space, daytime and nighttime images separate as if shot at entirely different locations. There is a 5x gap between density 0.698 (daytime) and 0.136 (nighttime). When this imbalance feeds into training, the AI becomes over-reliant on daytime patterns.
L3: What the Domain Lens Sees Deeper
Level 3 swaps the general-purpose lens for an 835-dimensional domain-optimized lens. The embedding space is fine-tuned to the specific characteristics of the dataset. The key question: how does the day/night bifurcation seen in L2 change under this specialized view?
4.1 L3 PCA — Even Sharper Separation
In the L3 PCA chart, the two clusters are separated even more clearly than in L2. The domain-optimized lens captures traffic video characteristics with greater precision. A wider gap between day and night means these two conditions are fundamentally different domains from the AI's perspective.
L3 PCA distribution — after 835-dim domain optimization, the two clusters separate even more clearly
4.2 L3 Density — Finer Sub-Structures Emerge
In the L3 density chart, L2's two hotspots fragment into three or more sub-clusters. Within the daytime cluster, clear days begin to separate from overcast days, and early morning from midday. The nighttime cluster also develops sub-structures based on headlight direction and traffic density.
L3 density distribution — L2's two hotspots have fragmented into three or more sub-clusters
L2 vs. L3: The general-purpose lens (L2) captures the big picture -- "day vs. night." The domain lens (L3) goes deeper, distinguishing weather conditions, time-of-day nuances, and traffic volume within each cluster. Even a single-class dataset contains multi-layered structures that directly affect AI training outcomes.
The Video Frame Trap — When 60,000 Images Become a Liability
There is another critical issue hiding in this dataset. DataClinic's nearest-neighbor analysis reveals that the most similar images are clustered in consecutive frame numbers.


Consecutive frames 00003741 through 00003745 — nearly identical daytime intersection scenes treated as five "independent" data points
Frames 00003741, 00003742, 00003743 -- these are consecutive frames captured within the same second. A CCTV camera extracts dozens of frames per second, so adjacent frames capture virtually the same scene. Another sequential group, 00058638 through 00058642, shows the same pattern.
Overfitting Warning
When consecutive frames are treated as independent samples, the AI ends up memorizing the same scene multiple times. The number 61,545 looks impressive, but without frame sampling, the actual information content may be equivalent to just a few thousand images. It is diversity, not volume, that determines AI performance.
Conversely, the farthest (most dissimilar) images concentrate in nighttime scenes. Frames 00039949 (density 0.268), 00050352 (0.179), and 00050330 (0.136) represent the images most distant from the typical daytime pattern -- nighttime scenes dominated by intense headlight glare and heavy traffic.
The core of the video frame trap: Consecutively captured frames are not statistically independent. Training directly on this data means (1) redundant daytime frames dominate the learning signal, (2) nighttime outliers become even more marginalized, and (3) the model becomes an AI that only recognizes "daytime intersections." Frame-interval sampling (extracting 1 frame every N frames) or embedding-based deduplication is essential.
Real-World Impact — What Happens When You Train Autonomous Driving AI on This Data
The day/night bifurcation and video frame duplication in the Wangsandeul dataset carry real consequences for production AI systems. This is not a hypothetical scenario. It is a concrete risk for every autonomous driving, smart city, and traffic management AI that trains on CCTV video data.
Scenario 1: Daytime-Biased Learning
Since high-density (typical) images concentrate in daytime conditions, the AI learns "intersection = bright, empty road." It achieves high accuracy on daytime test sets, but this score merely reflects the data's majority population -- not real-world generalization.
Scenario 2: Nighttime Performance Collapse
Nighttime images fall into the low-density outlier category and carry little weight during training. The result: the model fails to recognize pedestrian crossings, traffic congestion, and signal changes at nighttime intersections. The most dangerous hours produce the weakest performance -- a paradox with potentially fatal consequences.
Scenario 3: Sim-to-Real Gap
A mixed-traffic simulation trained only on the daytime distribution of this data cannot reproduce real nighttime intersection conditions. The gap between simulator and reality -- the Sim-to-Real Gap -- starts at the data collection stage. This is the data-side manifestation of the Evaluation Crisis identified in our Mixed-Traffic AI Simulation Report.
What DataClinic can warn you about in advance: L2/L3 density analysis quantifies the day/night imbalance, and nearest-neighbor analysis detects video frame duplication. Had this diagnosis been run before training, the prescription would have been clear: frame sampling plus nighttime data augmentation. DataClinic proves with data just how dangerous the assumption "60,000 images is enough" can be.
Conclusion — Even Unlabeled Data Needs a Diagnosis
The Wangsandeul Intersection dataset is a single-class, unlabeled collection of images. No class taxonomy, no object detection labels. Yet DataClinic uncovered the environmental sub-structures hidden within this data with remarkable precision.
Sixty thousand frames from the same intersection split into two worlds -- day and night. Consecutive frame duplication erodes real diversity. An AI trained on this data could fail at nighttime intersections. These findings demonstrate that data quality diagnosis is essential regardless of whether labels exist.
Below is a structural comparison with other datasets diagnosed by DataClinic. Despite different domains and class counts, they all share a common challenge: hidden structures within the data.
| Comparison | #204 Wangsandeul | #227 Drone Classification | #225 Military 3-Class |
|---|---|---|---|
| Classes | 1 (unlabeled) | 12 | 3 |
| Images | 61,545 | 28,801 | 1,947 |
| Key Pattern | Day/night bifurcation | Background repetition | Camera angle clusters |
| Video Frame Issue | Consecutive frame overfitting | Simulation frame duplication | N/A |
| DataClinic Finding | Environmental sub-structures | Trap of perfect balance | Camera angle clusters |
The core value of DataClinic diagnosis is "data quality analysis that does not depend on labels." Whether labels exist or not, whether images number one thousand or sixty thousand, without first understanding the internal structure of your data, you cannot predict your training outcomes. The Wangsandeul case proves it.
Full DataClinic Report
The complete diagnostic report behind this article is available at DataClinic Report #204.
References
- [1] DataClinic Report #204 — Wangsandeul Intersection Public Traffic Video. dataclinic.ai/en/report/204
- [2] Mixed-Traffic AI Simulation Report — Evaluation Crisis and Sim-to-Real Gap. /report/mixed-traffic-ai-simulation/en/
- [3] DataClinic Report #227 — PBLS_Drone_classification Drone Classification Diagnosis. dataclinic.ai/en/report/227
- [4] DataClinic Report #225 — PBLS_Military_vehicle_3class Military Vehicle Diagnosis. dataclinic.ai/en/report/225