2026.03 · Pebblous Data Communication Team
Reading time: ~10 min · 한국어
Executive Summary
This article is based on the analysis results from DataClinic Report #131. The Industrial Waste Image dataset is the largest industrial waste image collection provided by AI Hub (Korea's national AI data platform under the Ministry of Science and ICT). Despite its impressive scale of 72 waste categories and 1 million images, it scored only 51 (Poor) in the DataClinic diagnosis. Class imbalance reaches up to 3,978x, and the dataset is flooded with visually similar images.
DataClinic Grade Summary
The DataClinic composite score is a weighted sum of sub-grades across L1 (basic quality), L2 (general neural network), and L3 (domain-specific), yielding a 0–100 score. This dataset scored 'Good' on L2/L3 distribution and geometry, but 'Bad' on L1 class balance and statistics — dragging down the overall score significantly. In short, the data structure is sound, but basic quality management failed — a textbook case.
📊 DataClinic's 3-Level Diagnostic Framework
DataClinic diagnoses datasets at 3 levels of depth. From surface-level statistics to domain-specific analysis, each level uncovers increasingly precise quality issues.
Basic Quality Diagnostics
Checks missing values, class balance, resolution, and statistical diversity — the dataset's fundamental health. The fastest way to spot problems.
DataLens Analysis (General-Purpose Neural Network)
Vectorizes images via Wolfram ImageIdentify Net V2 (1,280 dimensions), then analyzes geometric relationships and density distributions between classes. Seeing data through "AI's eyes."
Domain-Specific Analysis (Optimized Lens)
Optimizes dimensions for the specific domain (136 dimensions for this dataset). Captures domain-specific patterns and outliers that general-purpose L2 misses.
Dataset Overview — Government-Built Waste AI Data
South Korea generates approximately 200 million tons of industrial waste annually, much of which is still sorted manually. Automating waste classification is a critical challenge for achieving carbon neutrality and a circular economy, with AI-based sorting systems at the center of the solution. Against this backdrop, the government embarked on building large-scale waste image datasets.
Since 2019, the Korean government has been building national AI training data through AI Hub. The Industrial Waste Image dataset is Korea's largest industrial waste image collection produced as part of this initiative. It consists of high-resolution images of 72 types of waste captured at actual factories and industrial sites.
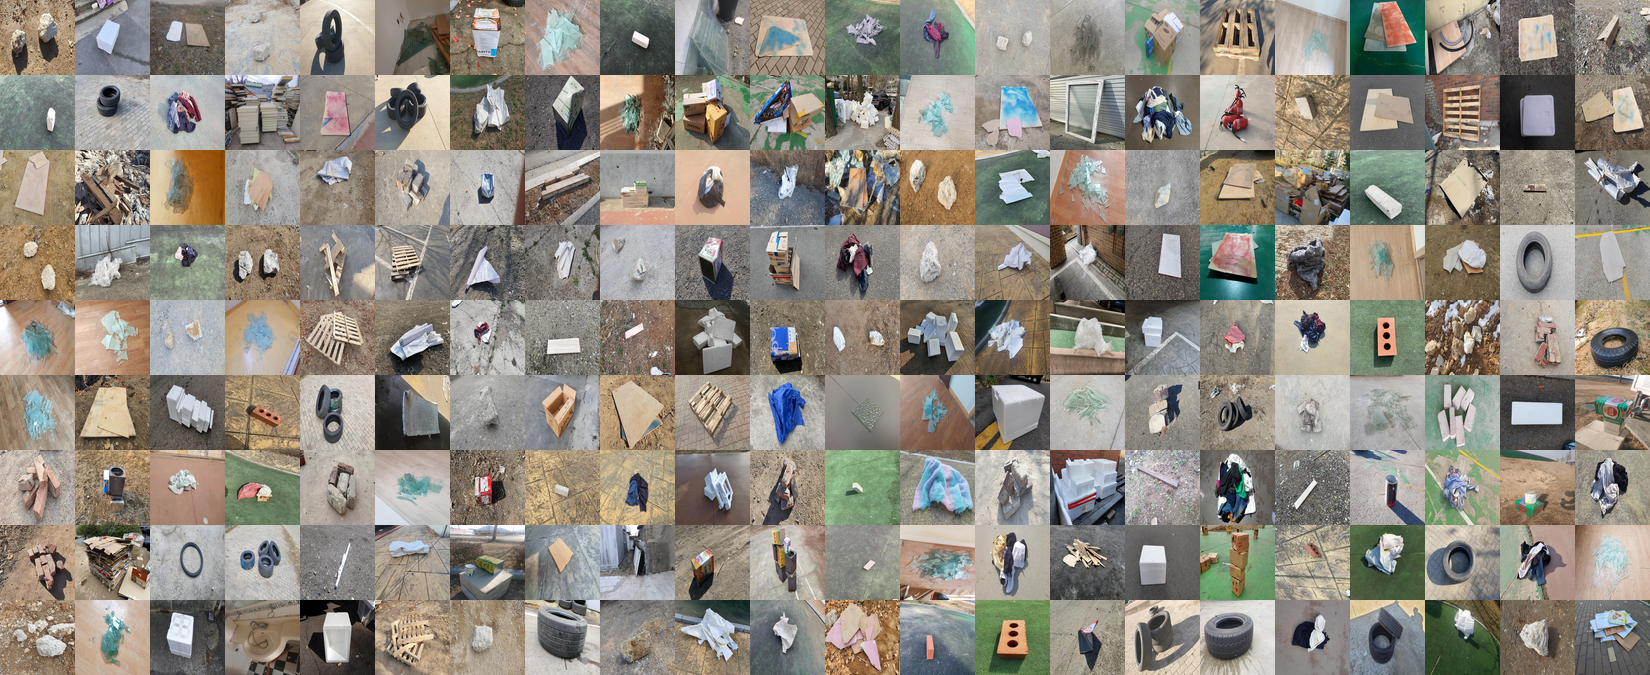
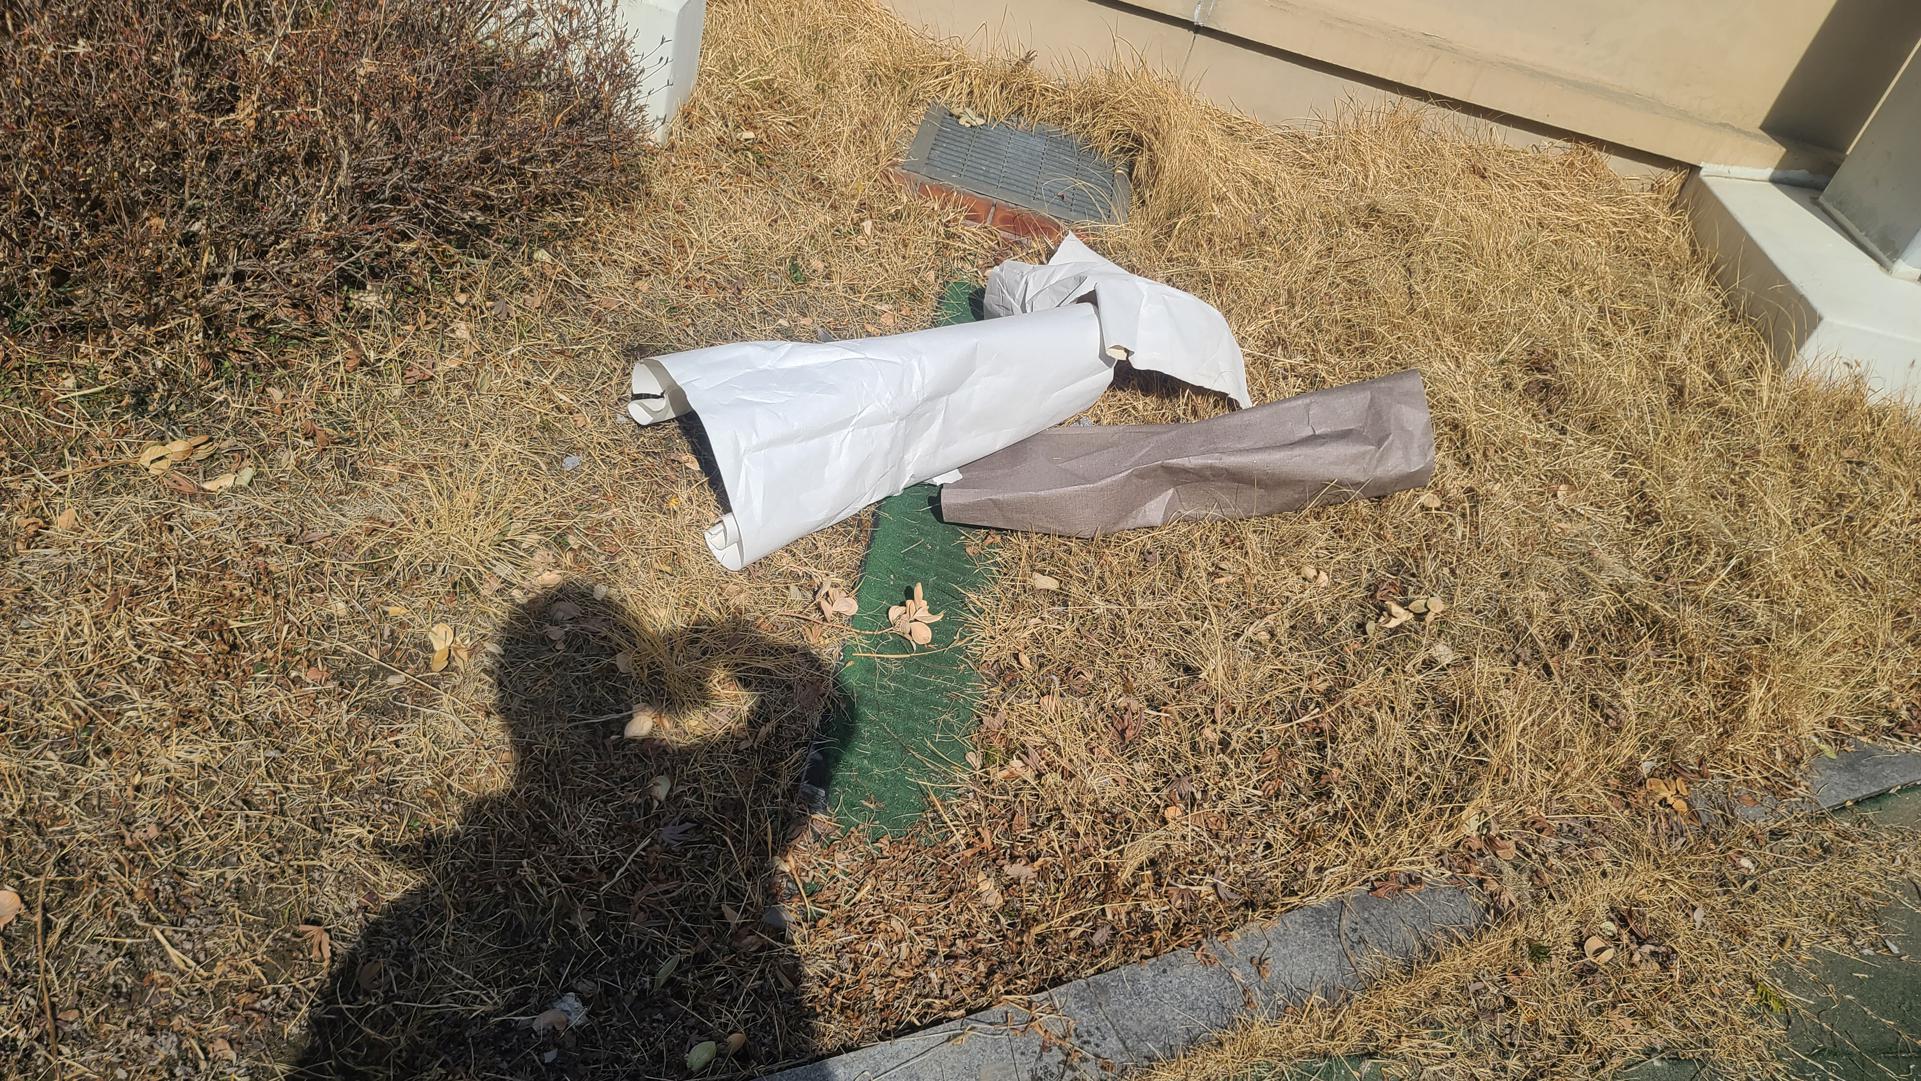
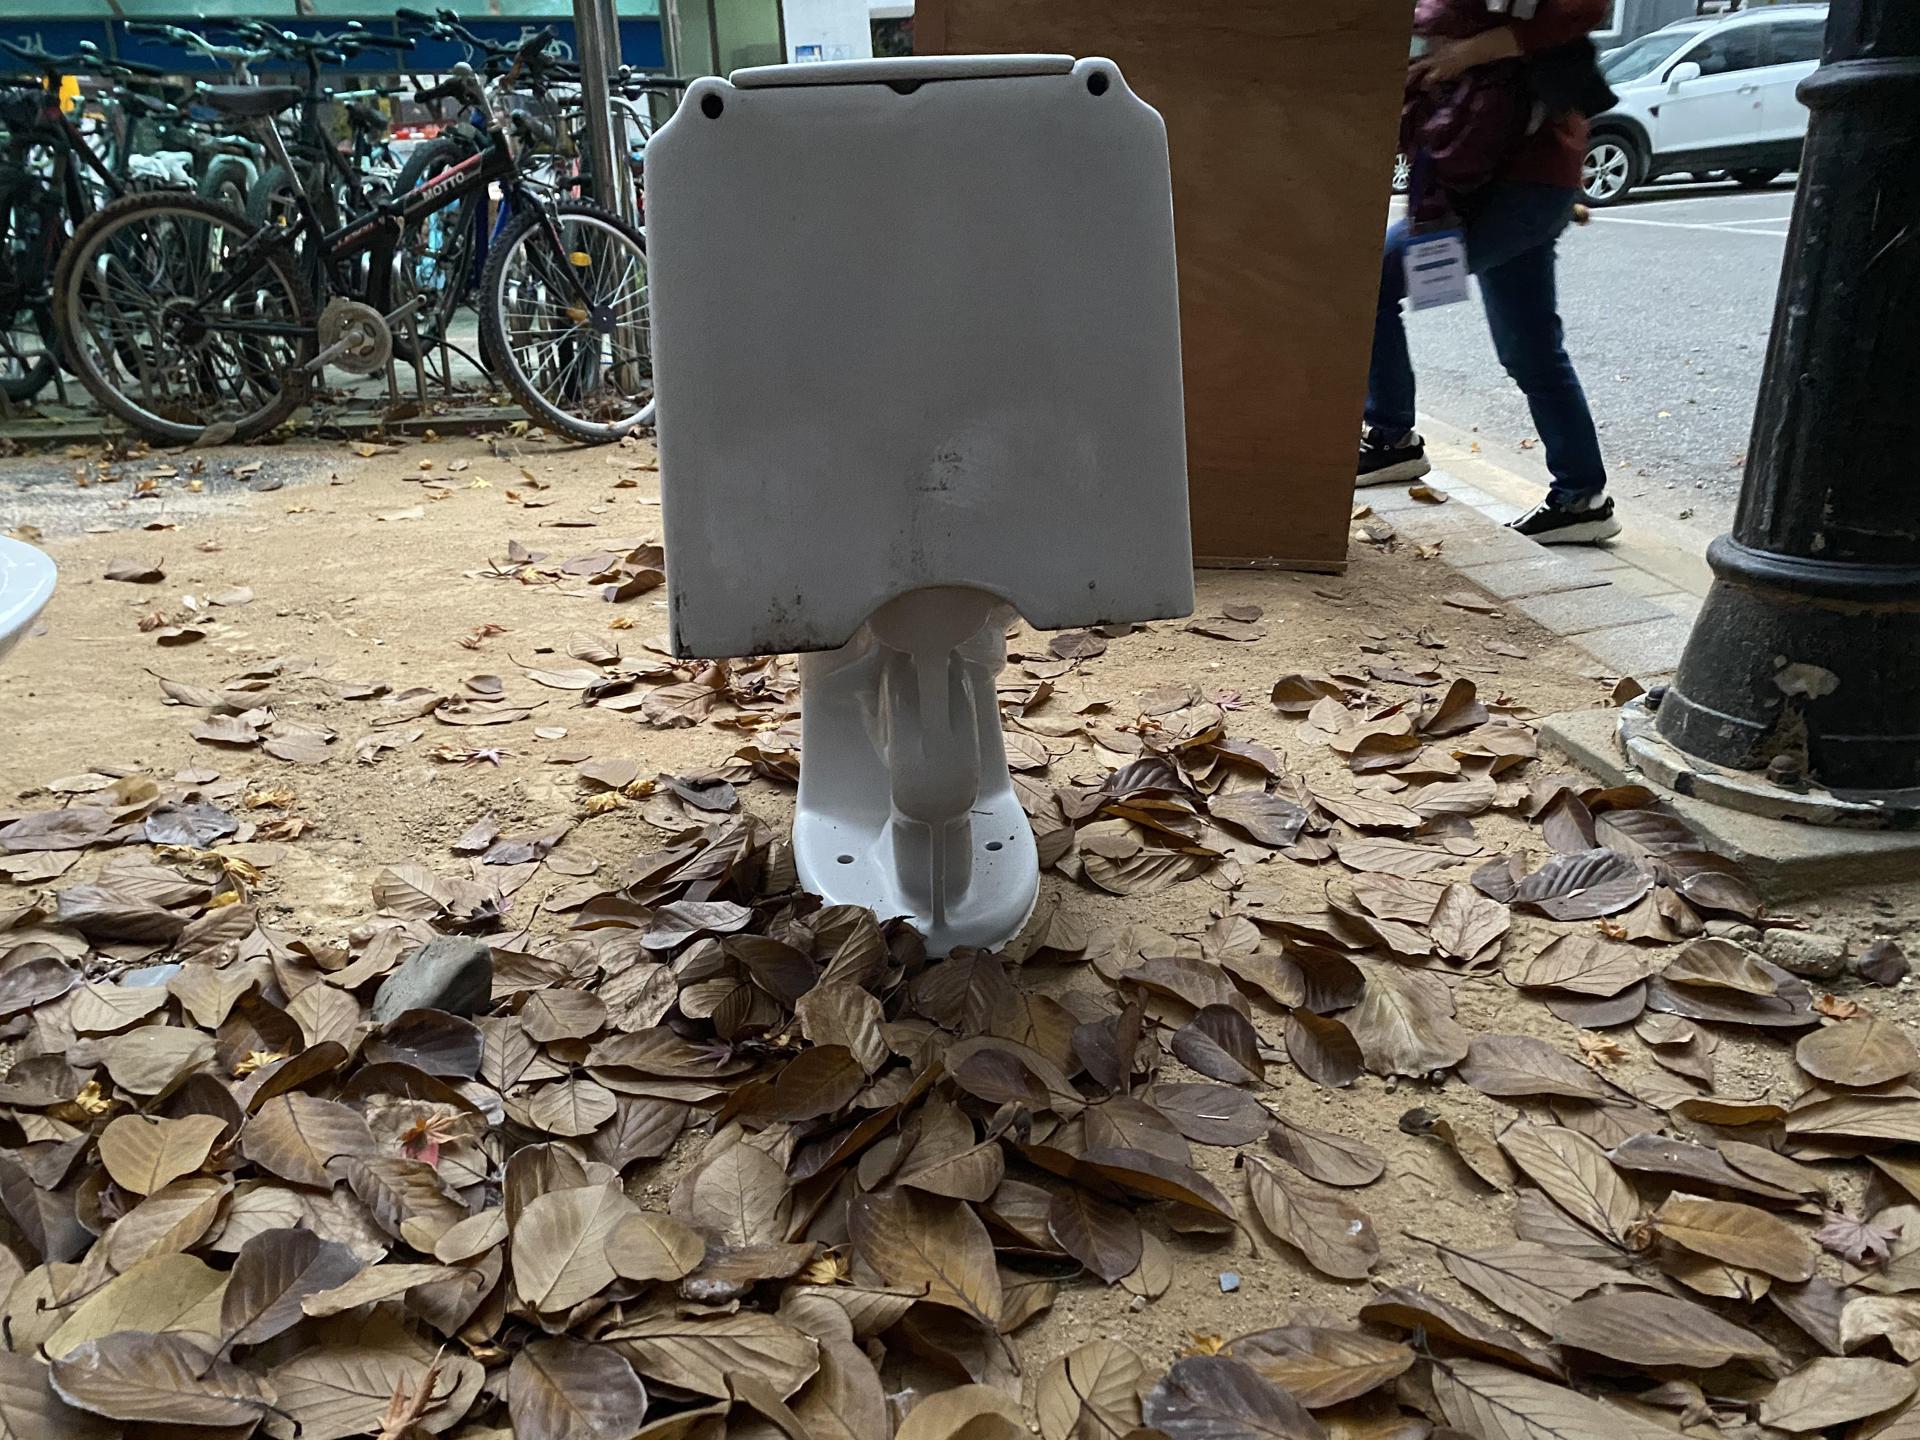
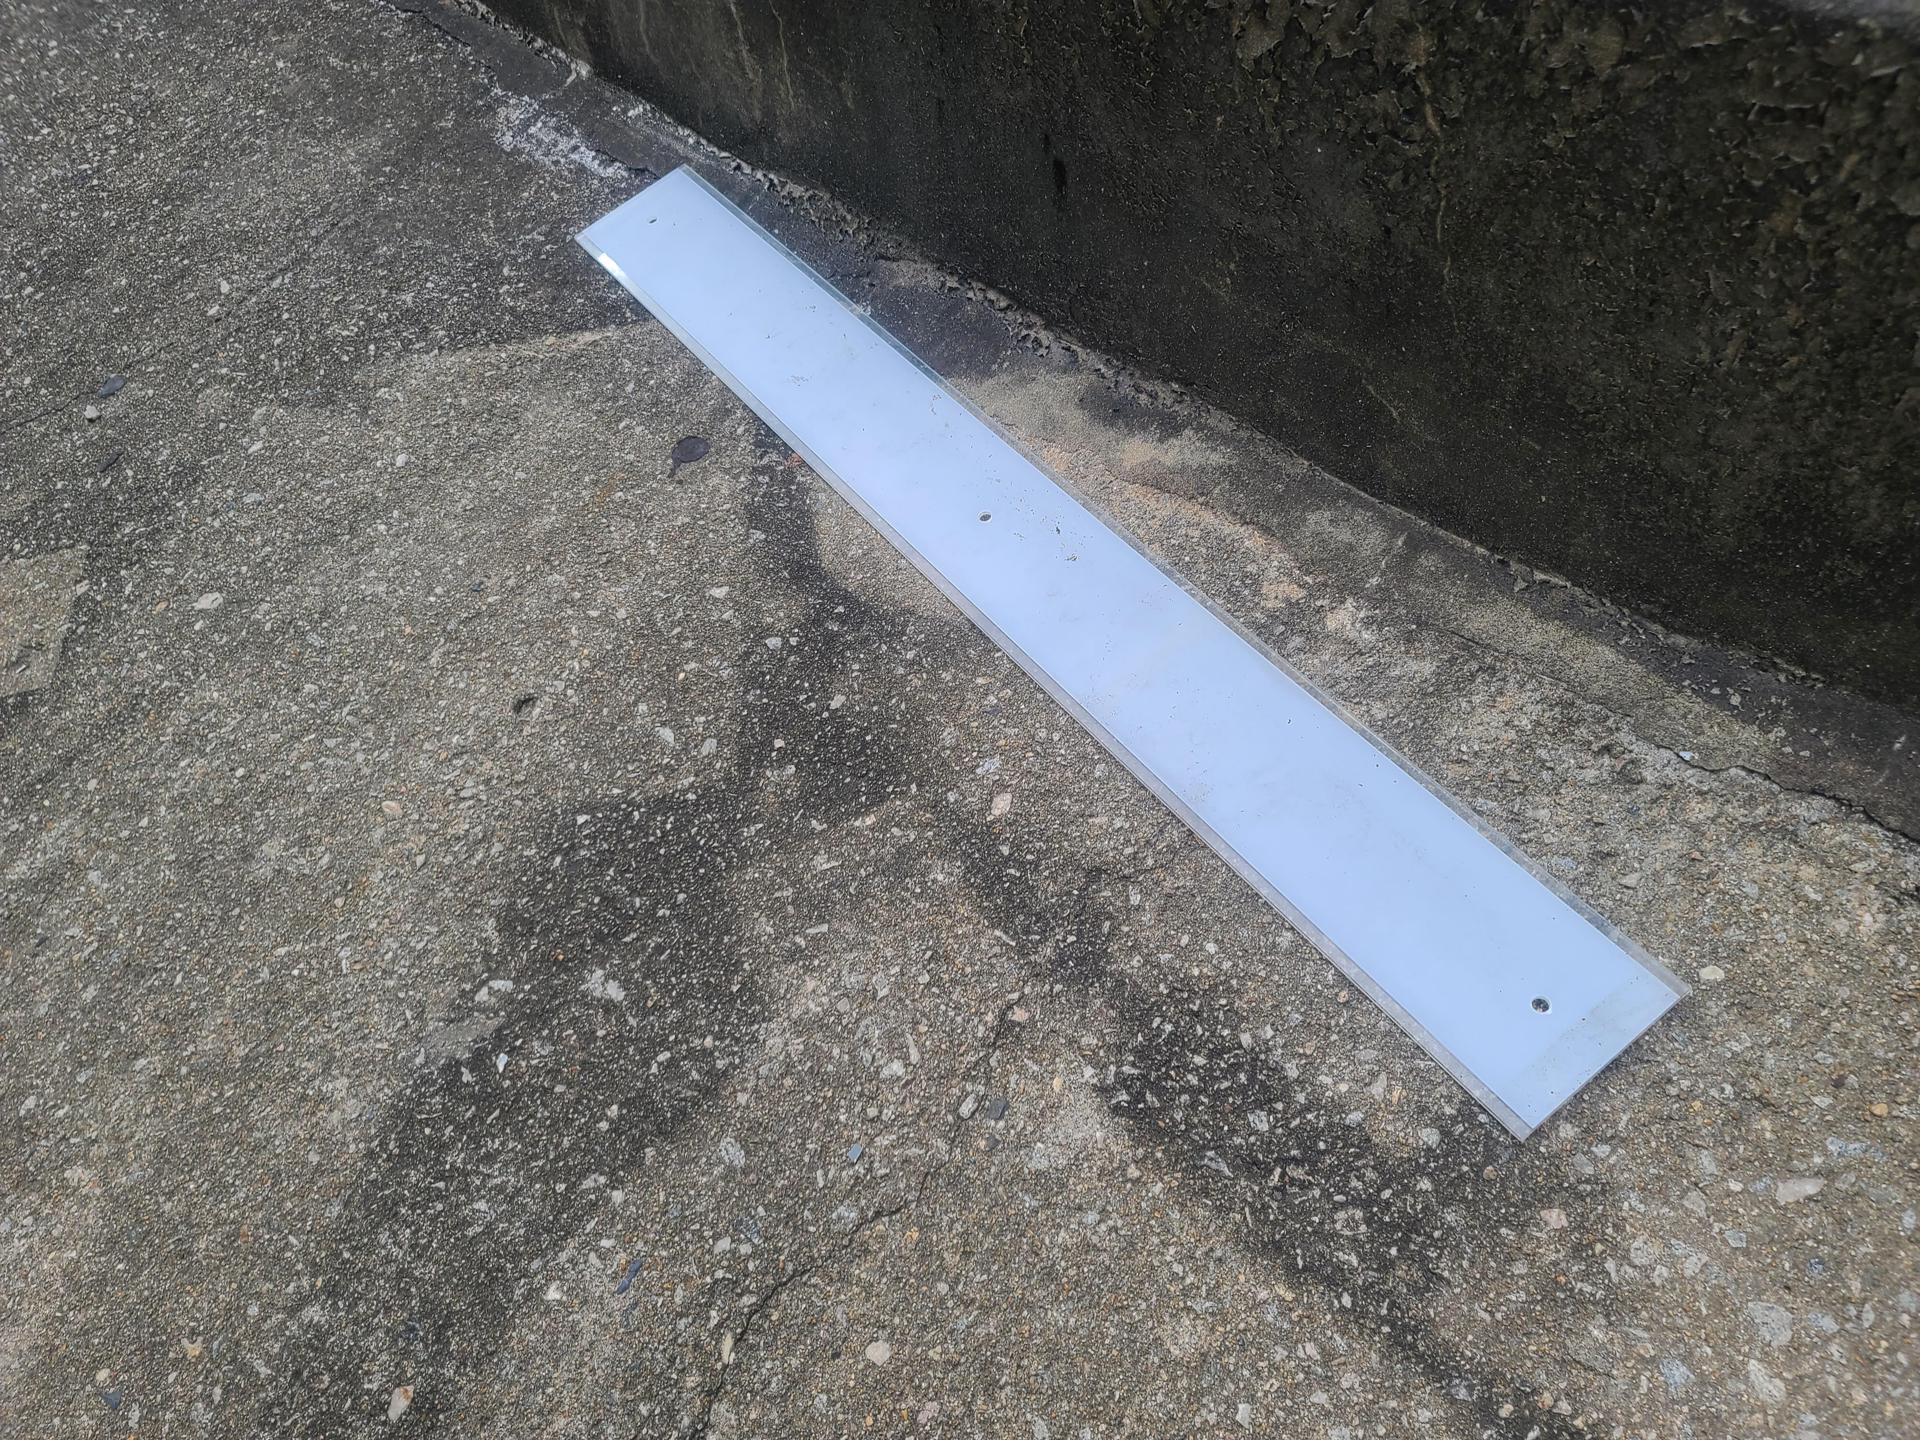
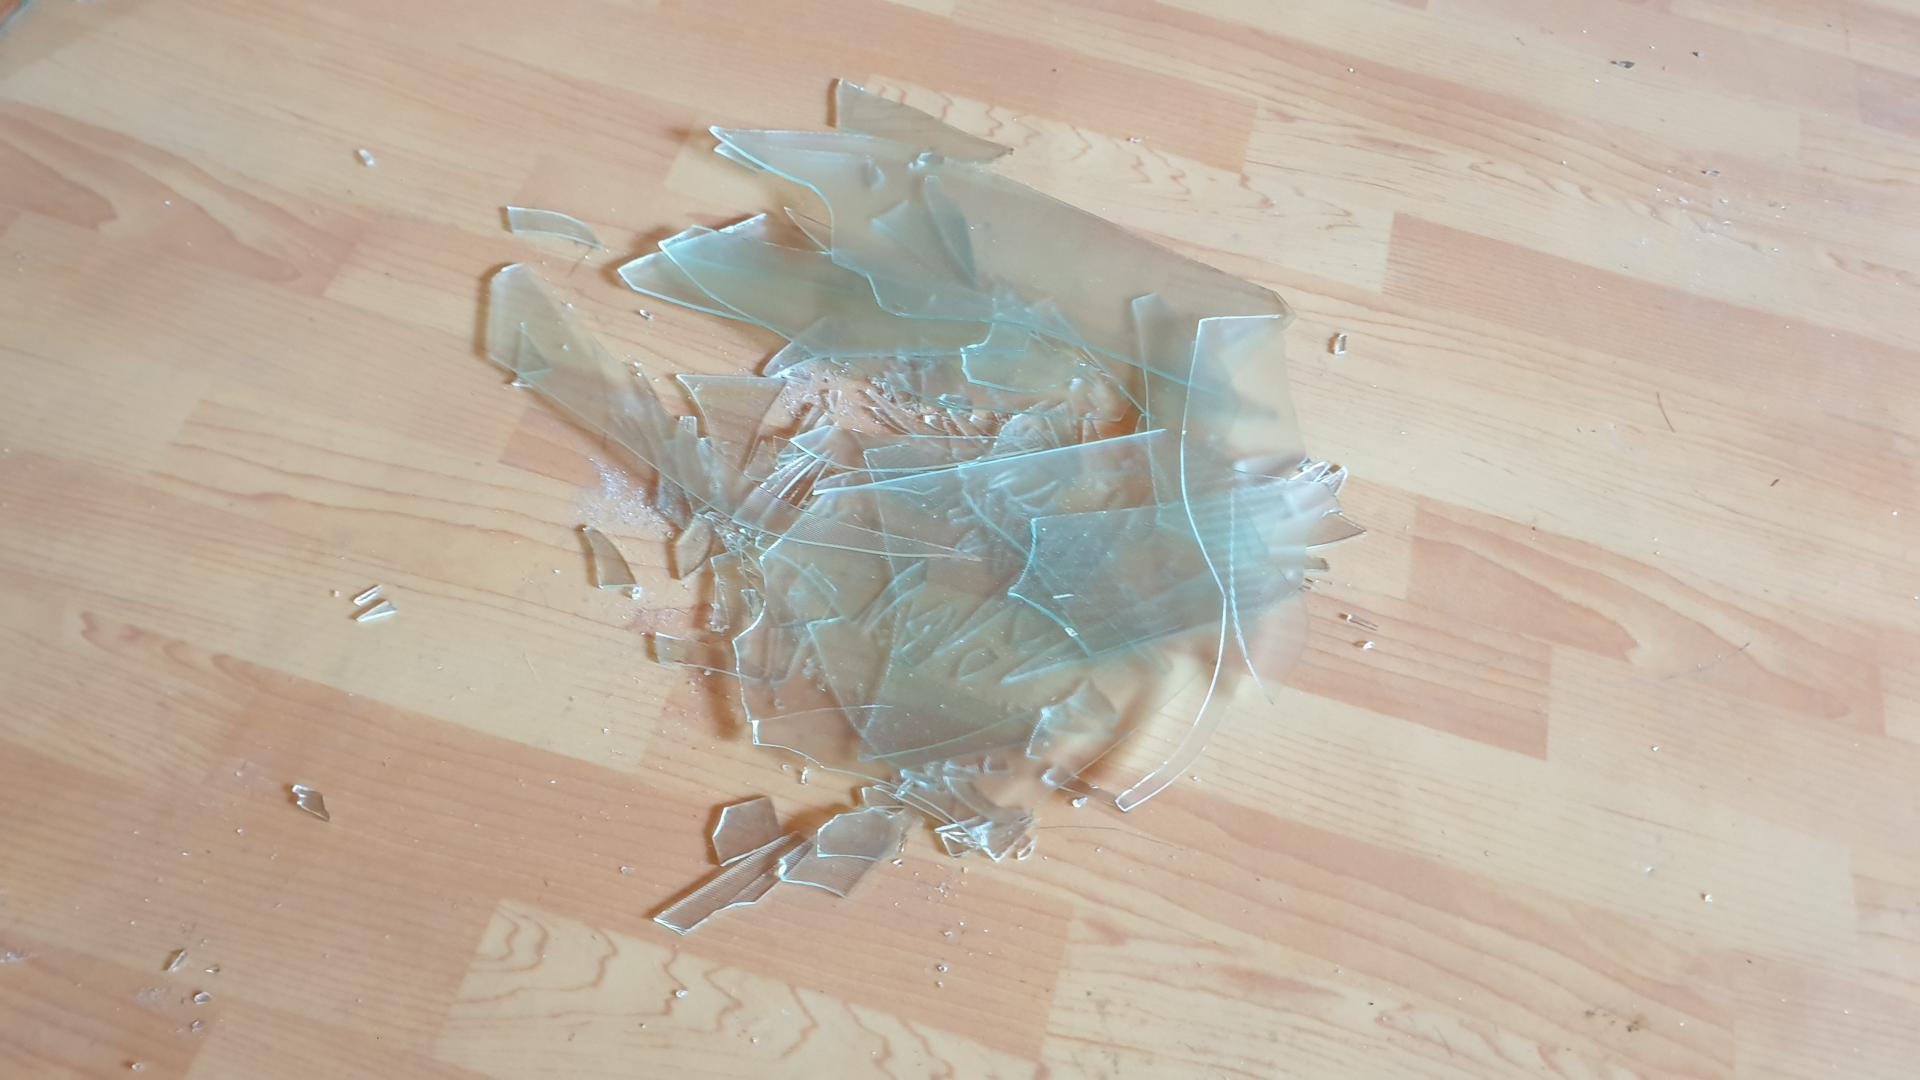
▲ Industrial waste image dataset collage — 72 diverse waste types including Metal Waste, Textile Waste, Glass & Ceramic, Synthetic Resin, and more
National AI Data
Official AI Hub (MSIT) dataset
Commercial use allowed
Real-World High-Res
Up to 3,024×4,032px
Shot at actual industrial sites
Recycling & Classification AI
Classification, detection, segmentation
Multi-purpose applications
Filename Structure Decoded: 01_X020_C056_0223_3.jpg
First 2 digits: major category number · X-number: shooting location · C-number: sub-class code · MMDD: shooting date · Last digit: sequential shot number of same subject
72 Waste Categories — What Kinds of Trash Are There?
The 72 classes are organized under 6 major categories with further sub-classifications. From metal cans to waste concrete sewer pipes, the dataset covers nearly every type of waste found at industrial sites.
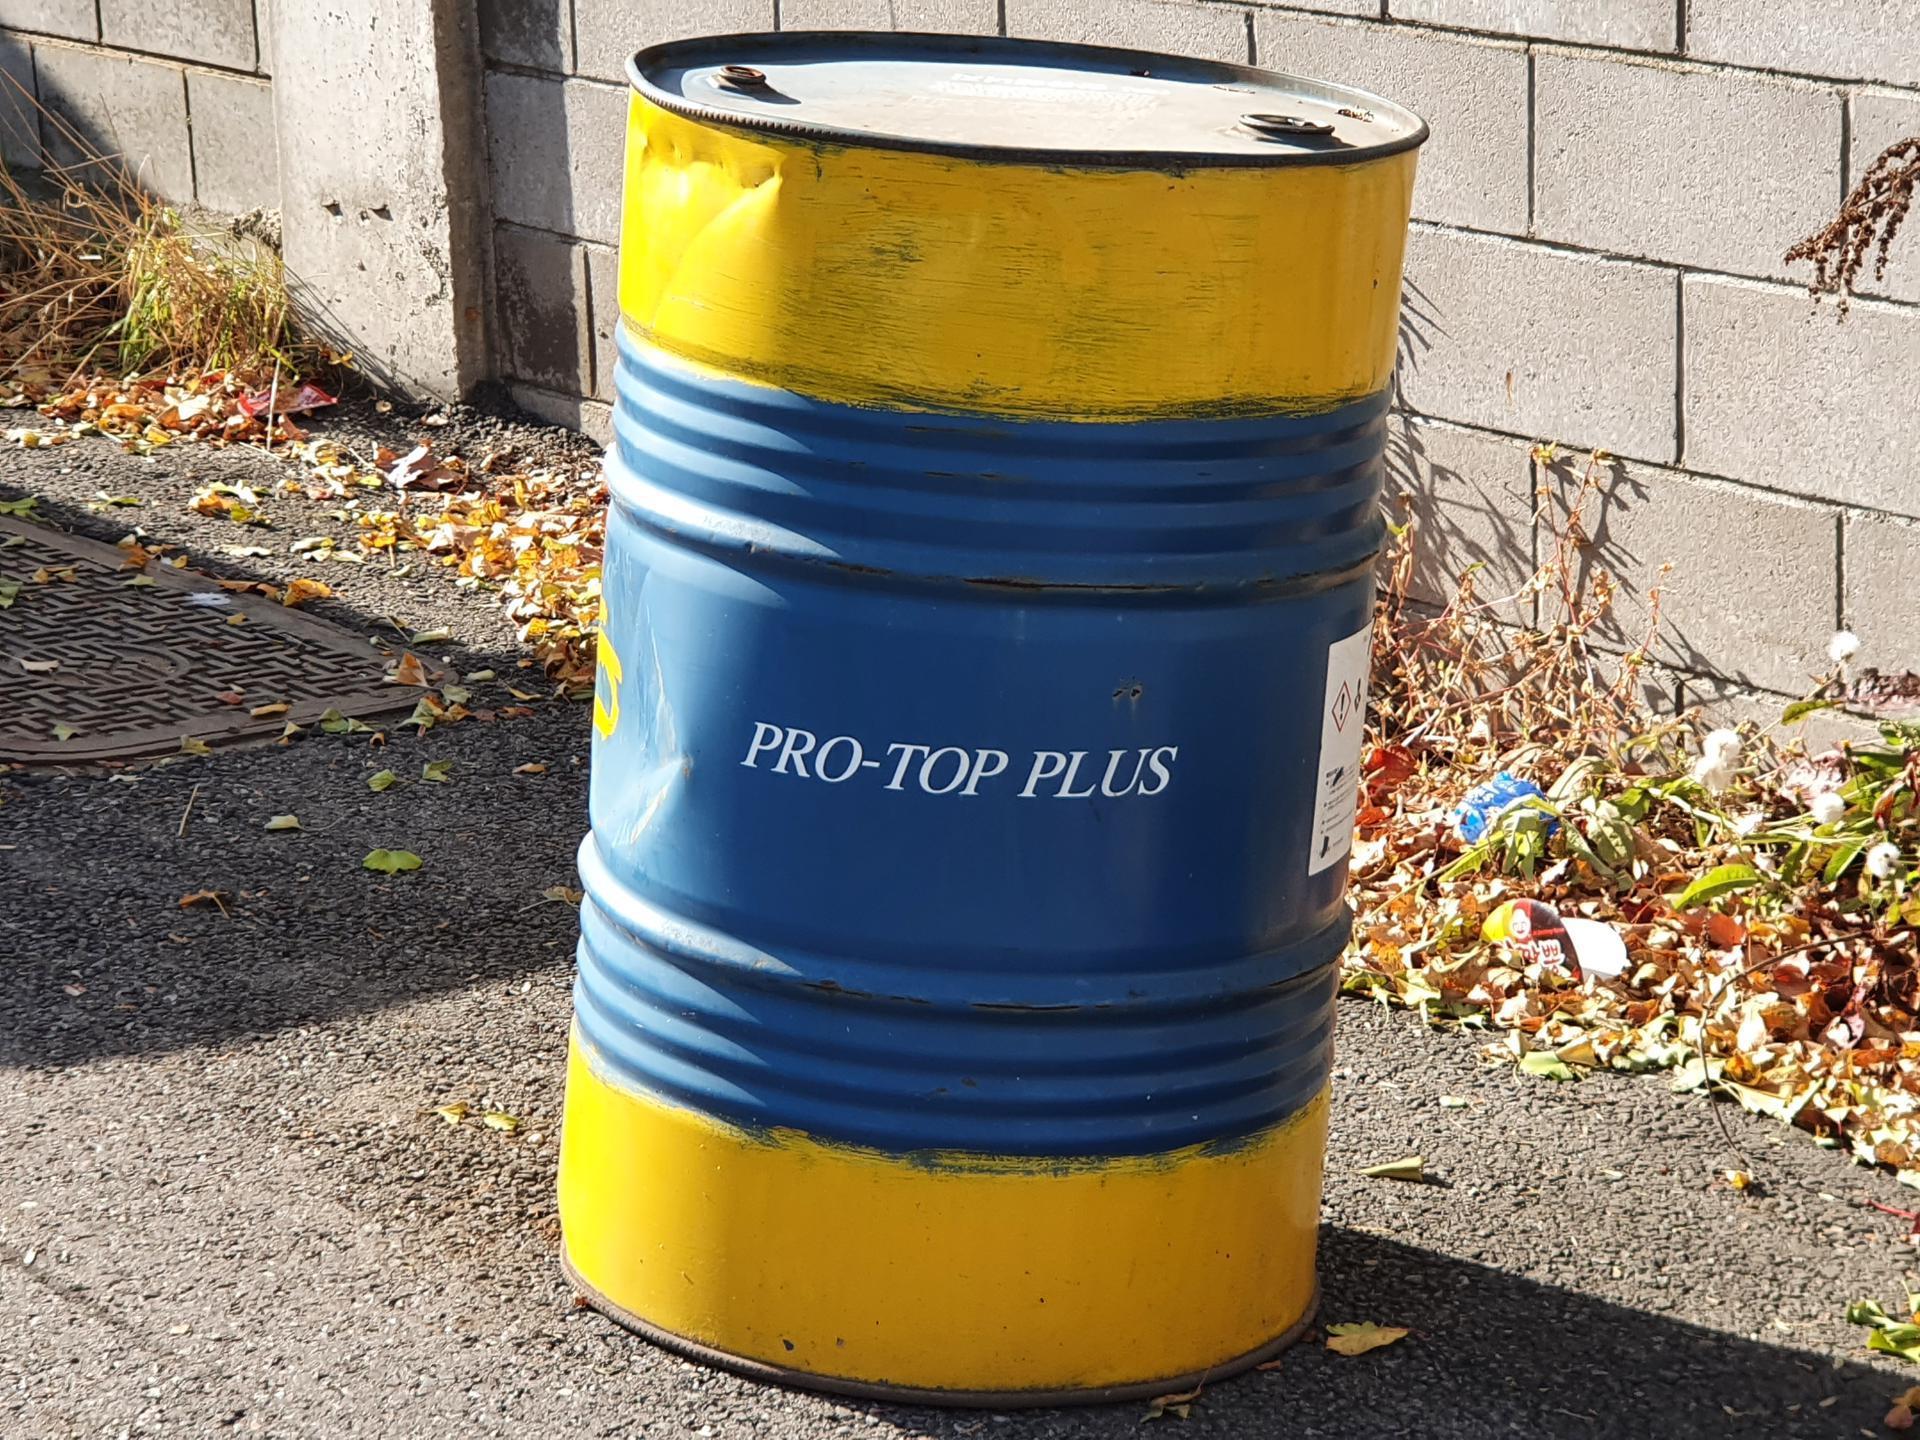
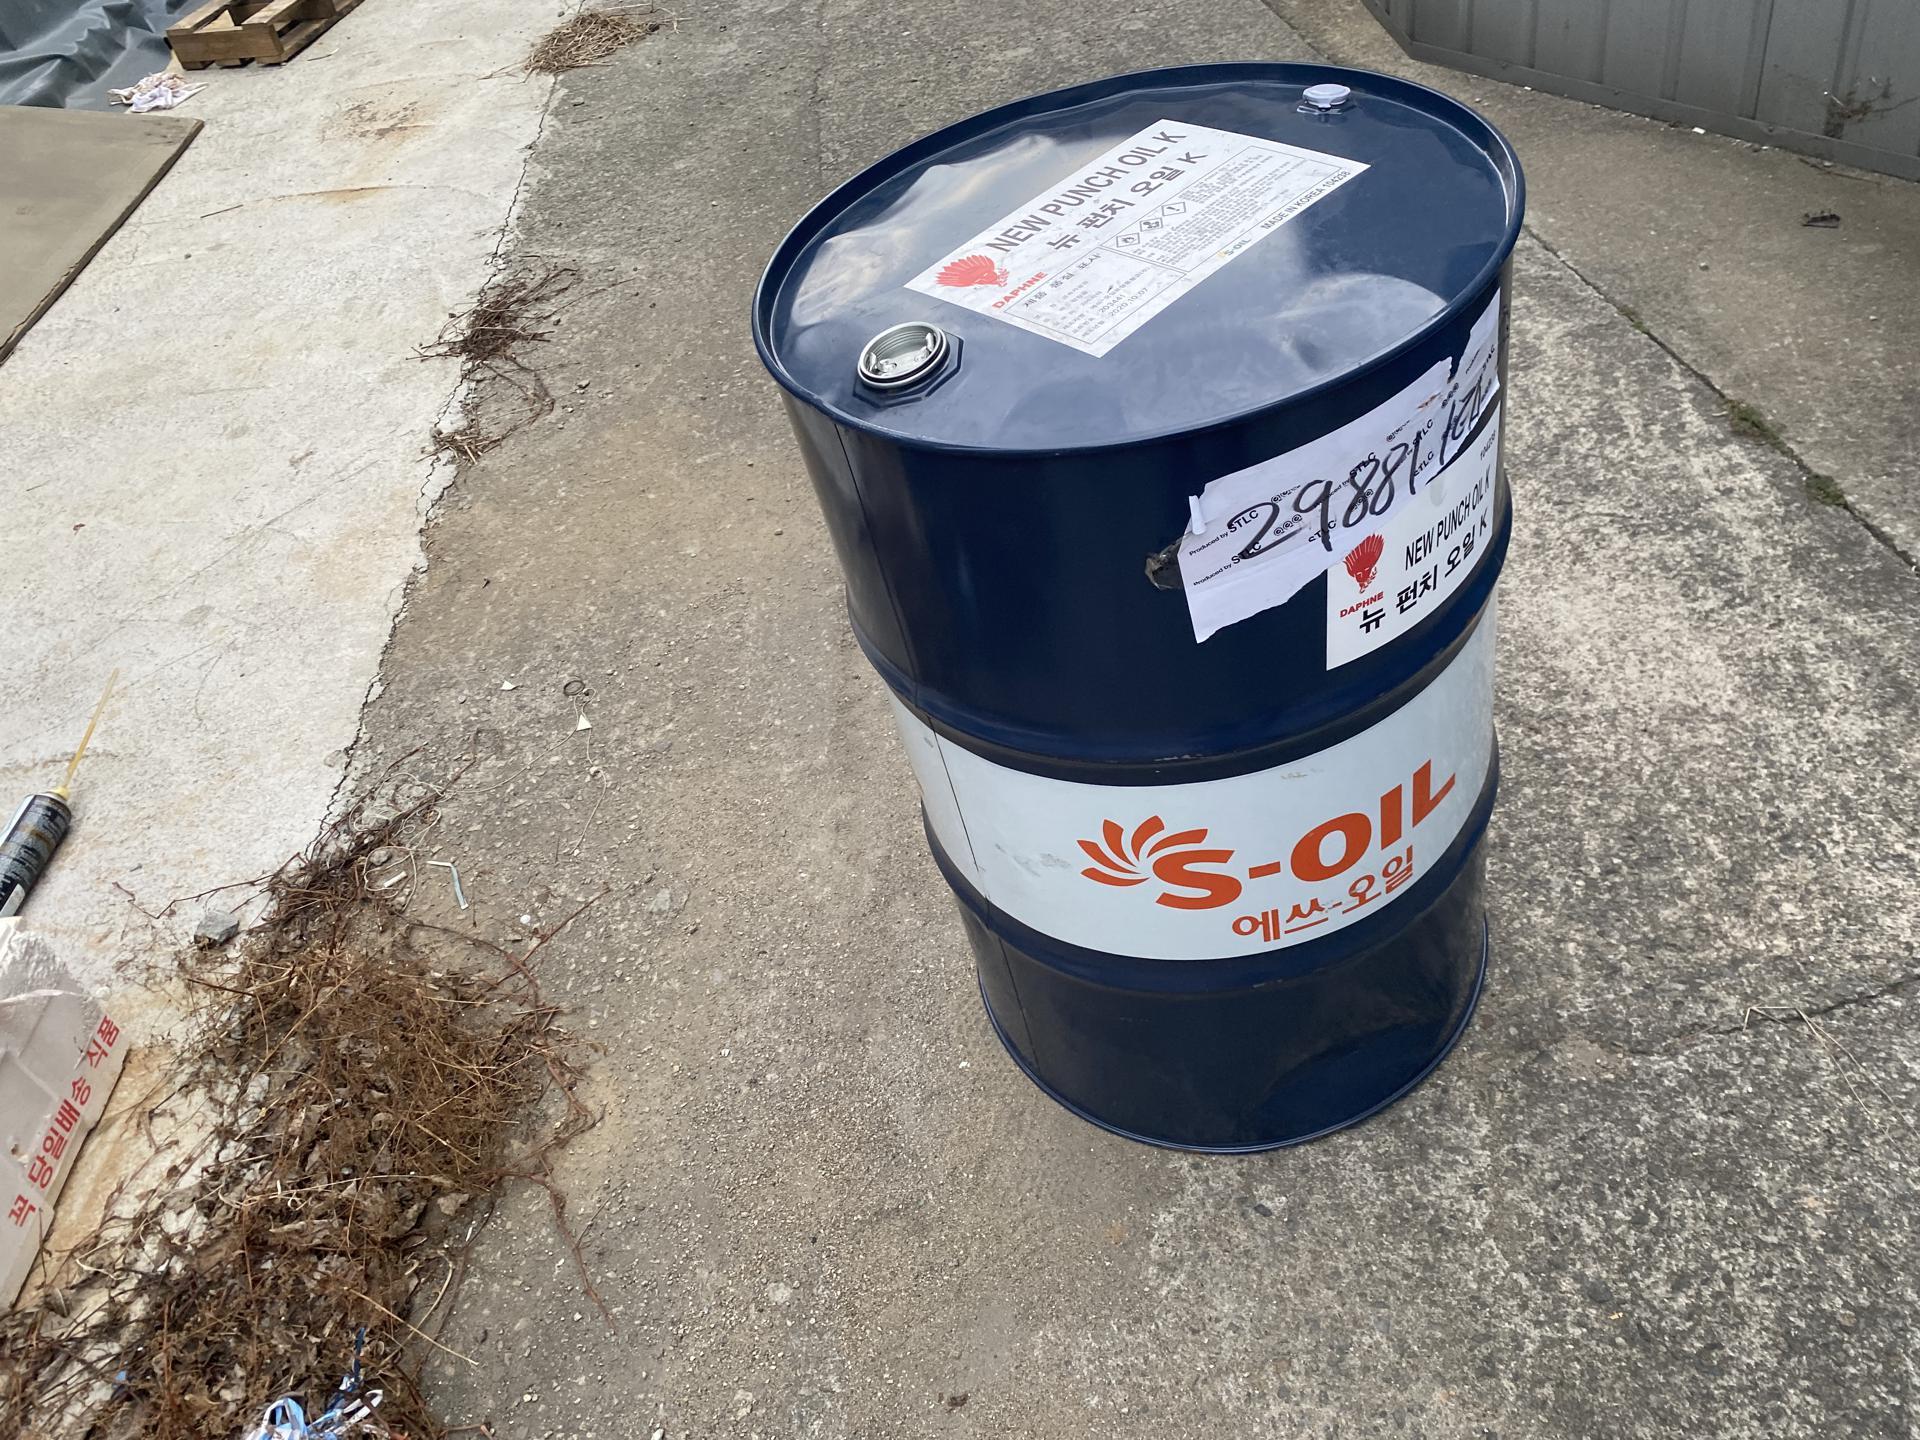
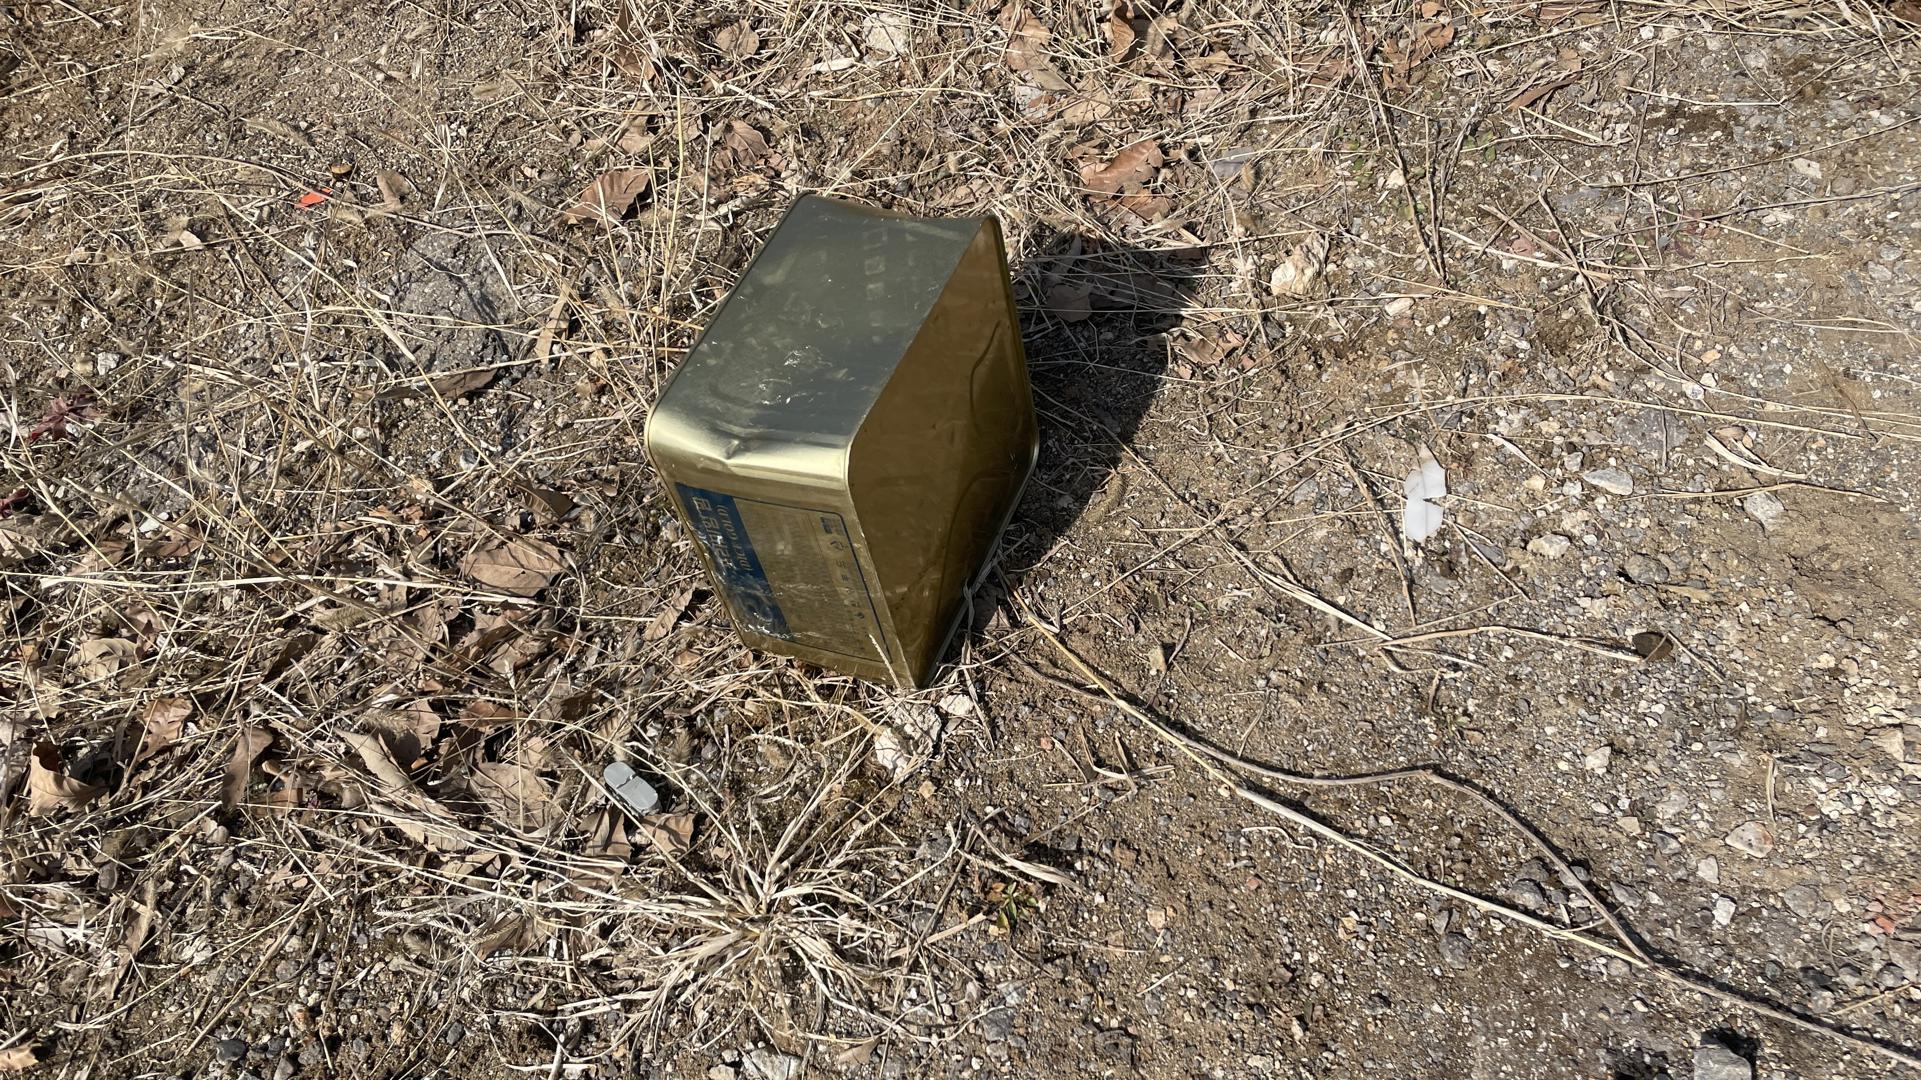
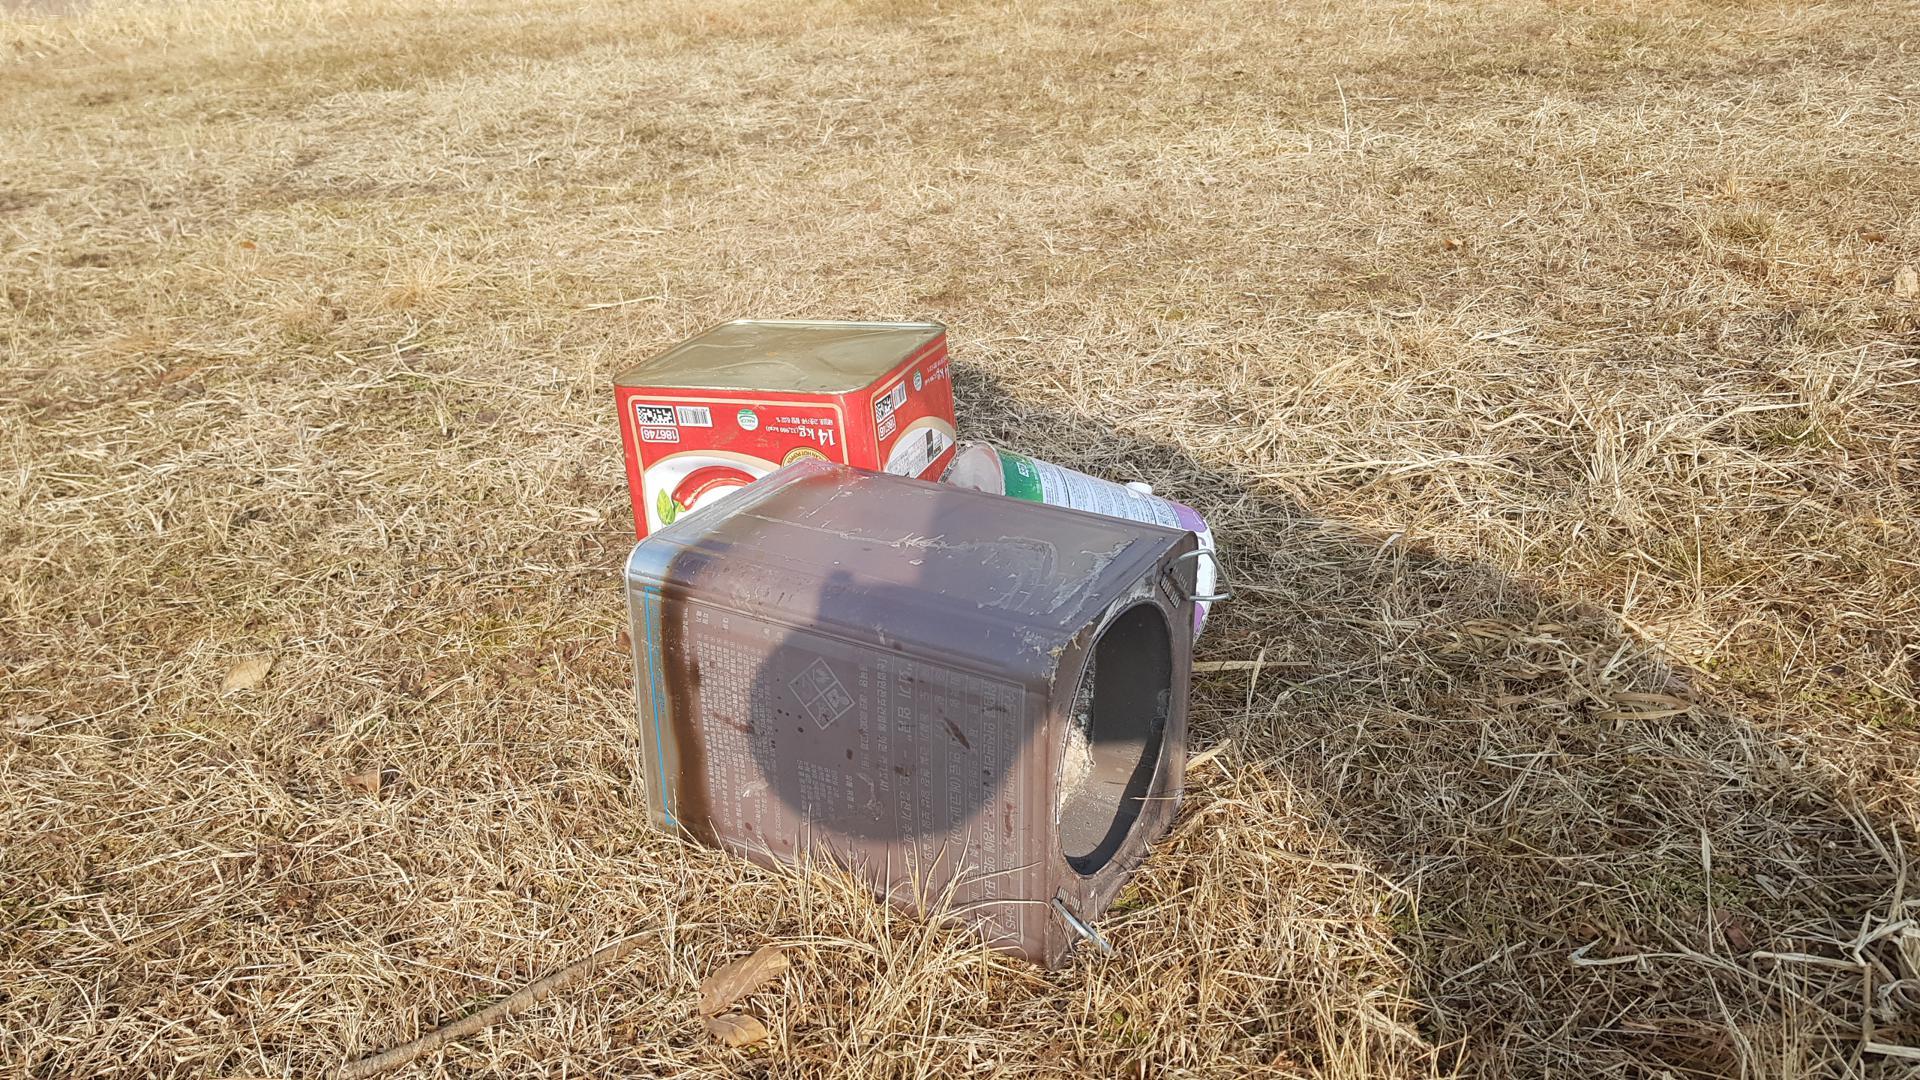
Iron, aluminum, and metal containers. High recycling value. Lacquer and paint cans are managed separately as hazardous waste.
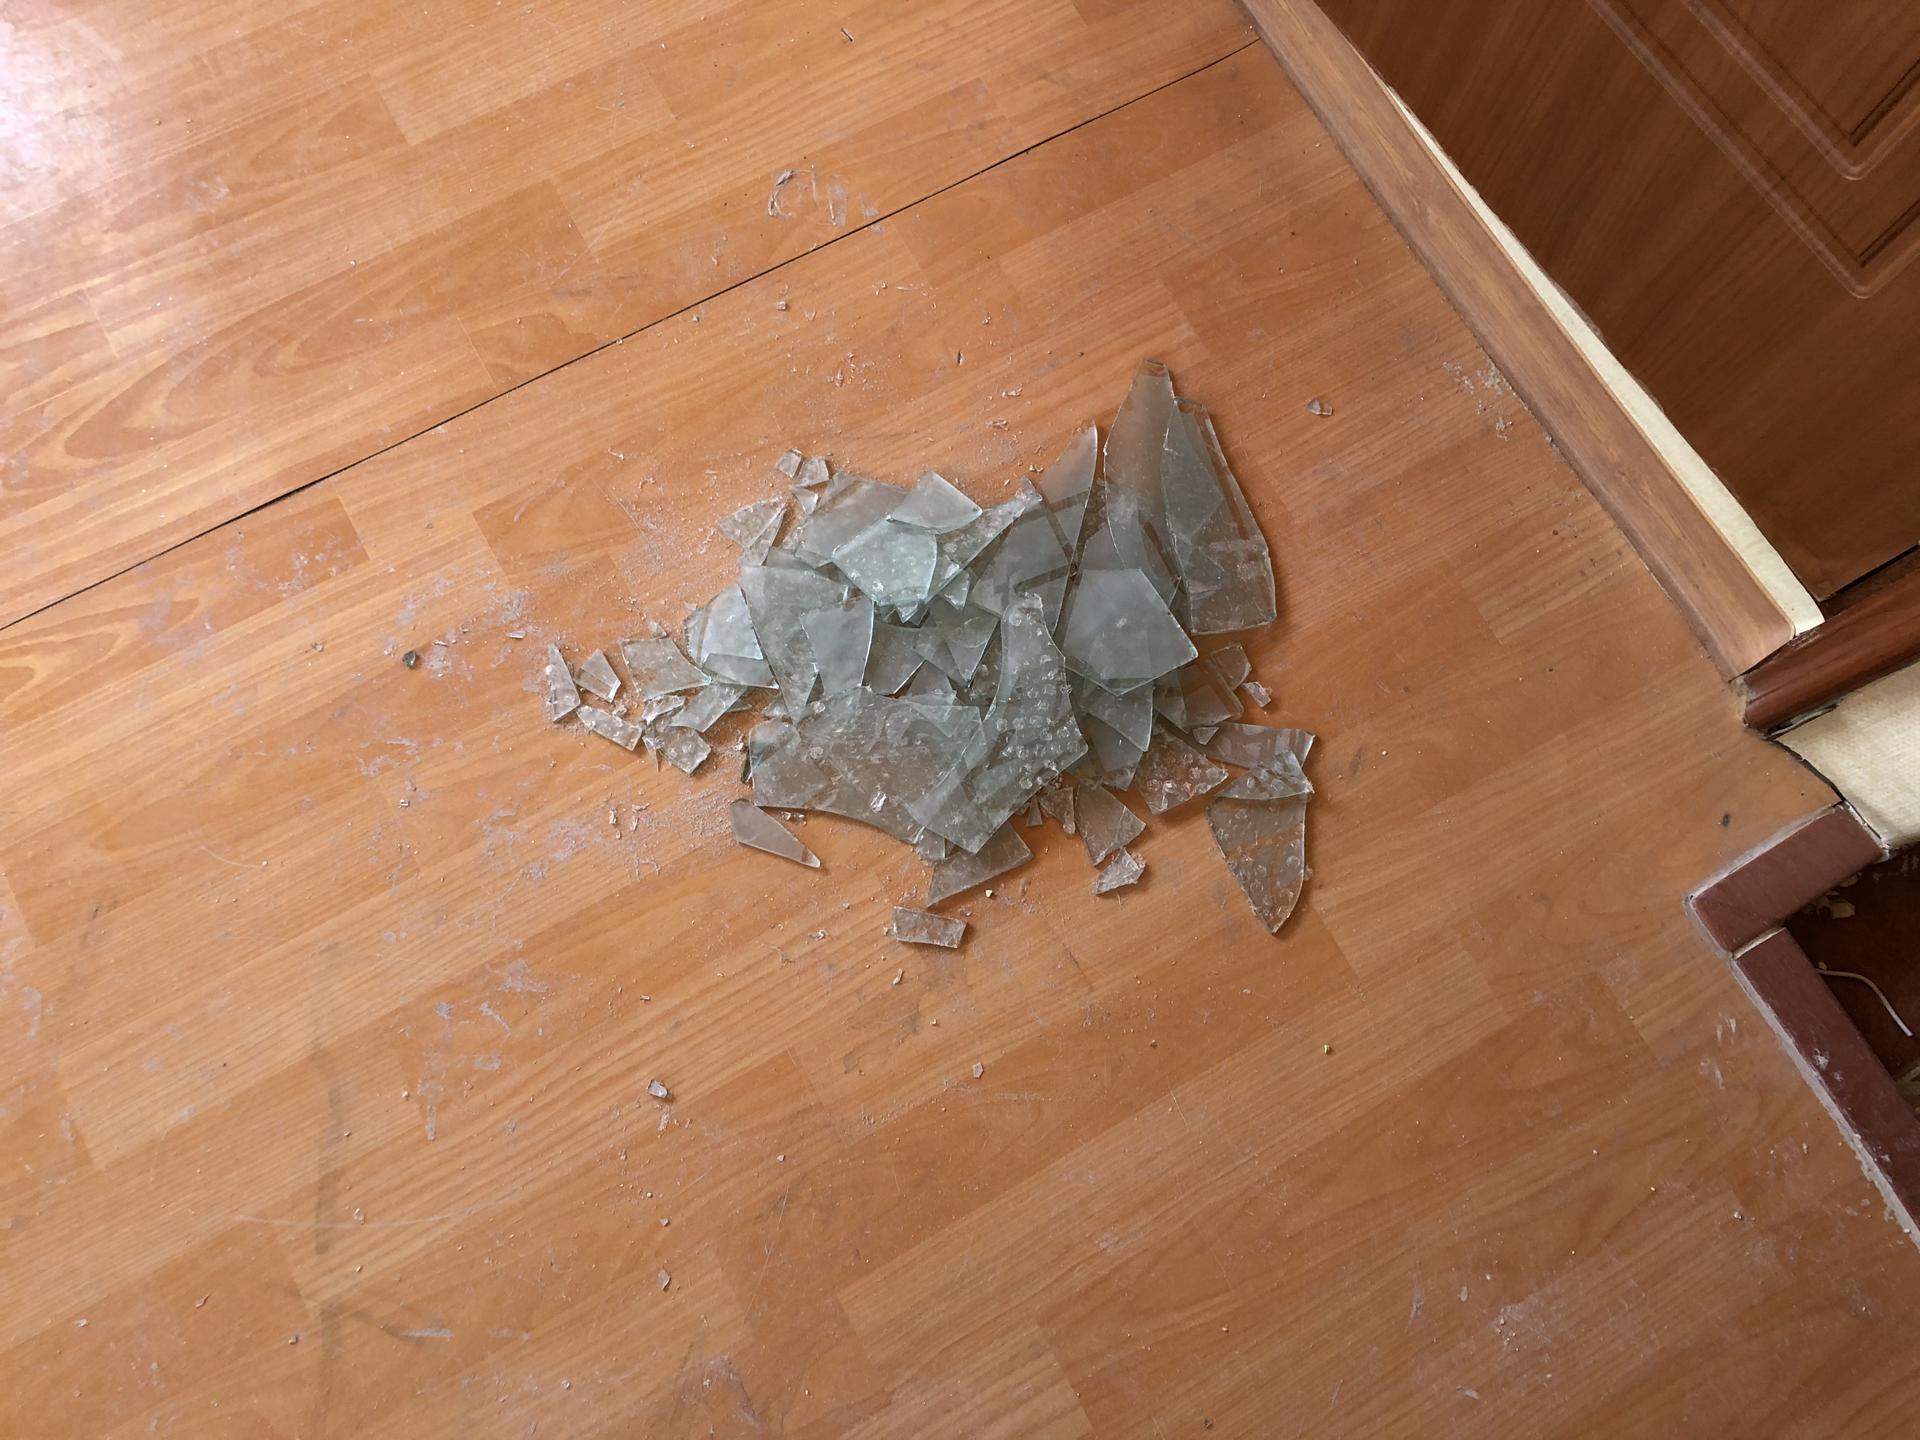
Ceramic fragments, glass bottles, window glass, etc. The most 'typical' waste for AI — #1 high density (density 2.13).
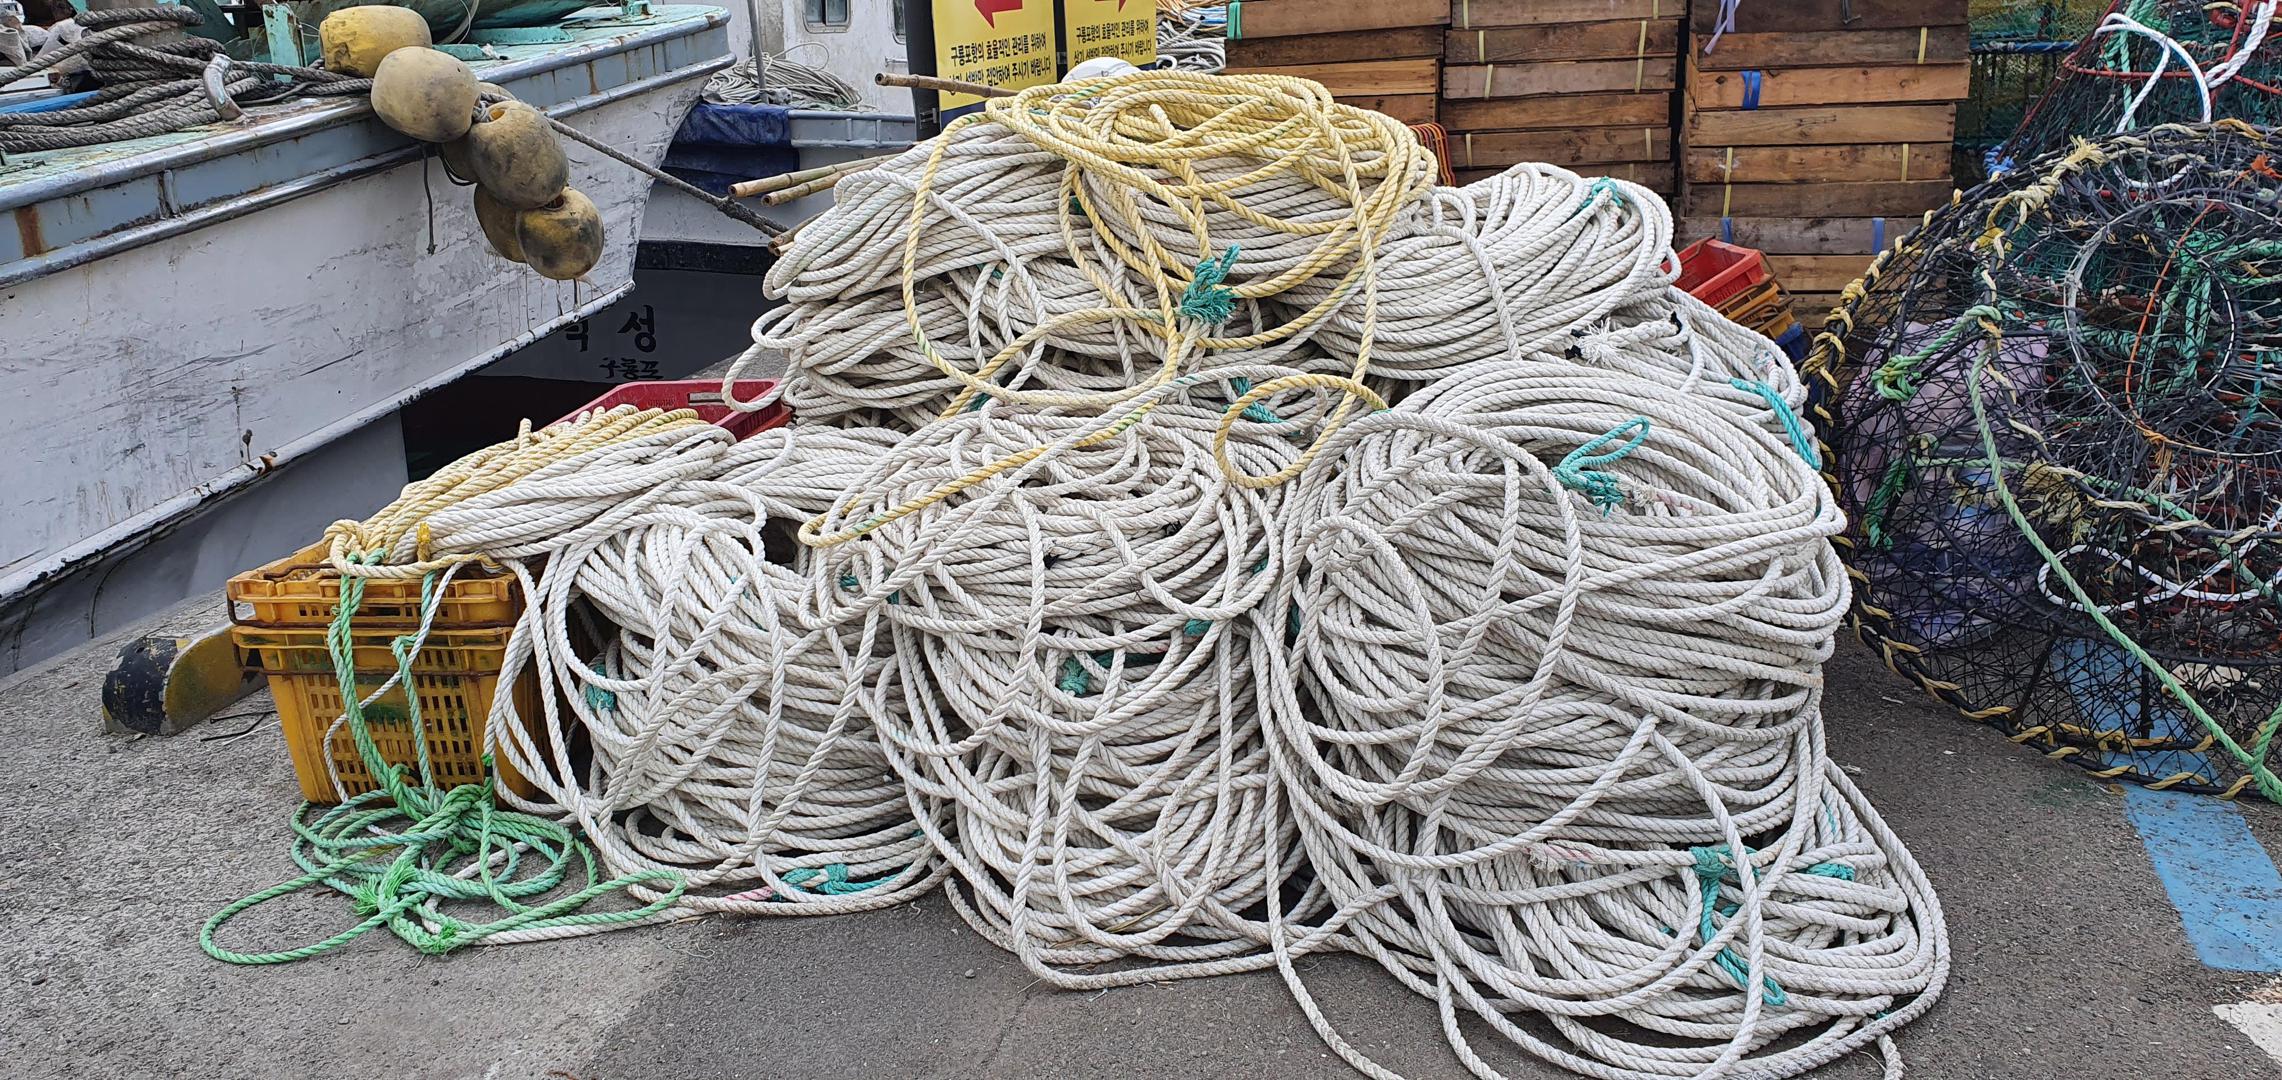
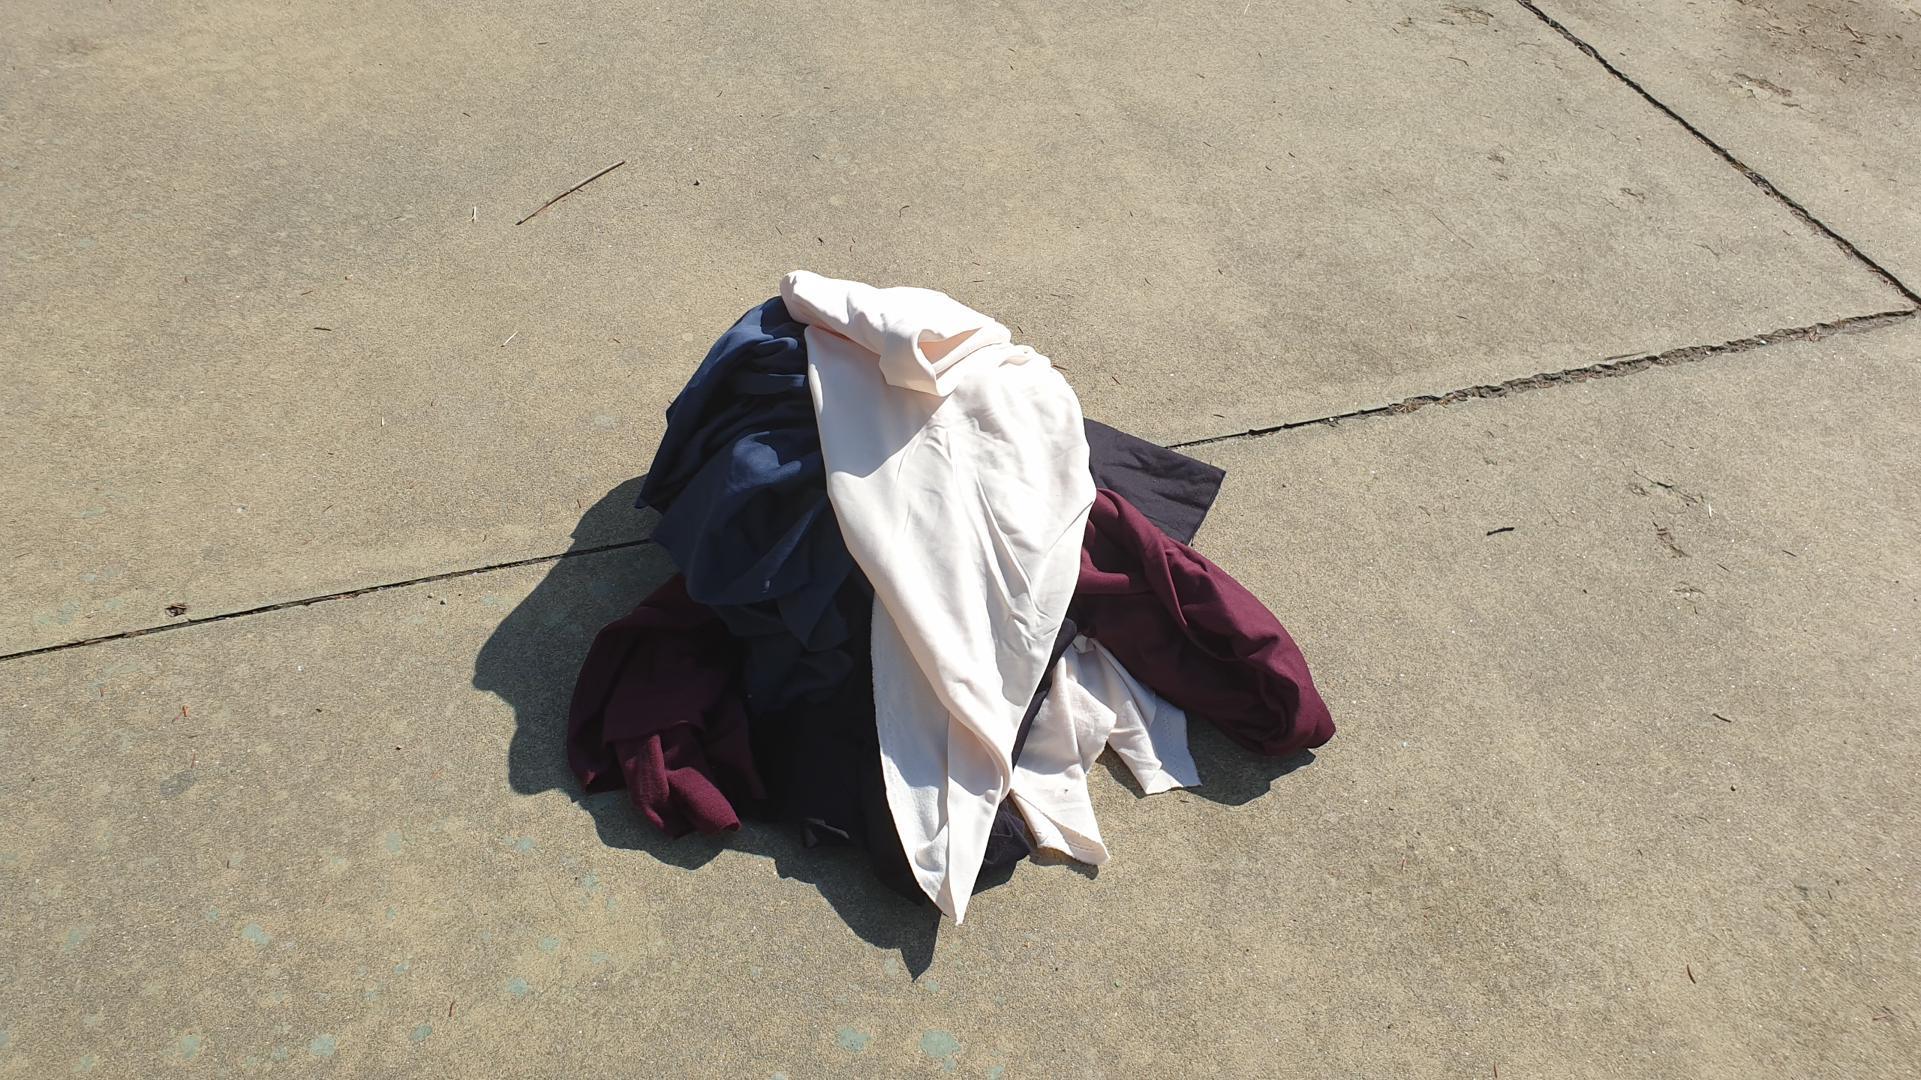
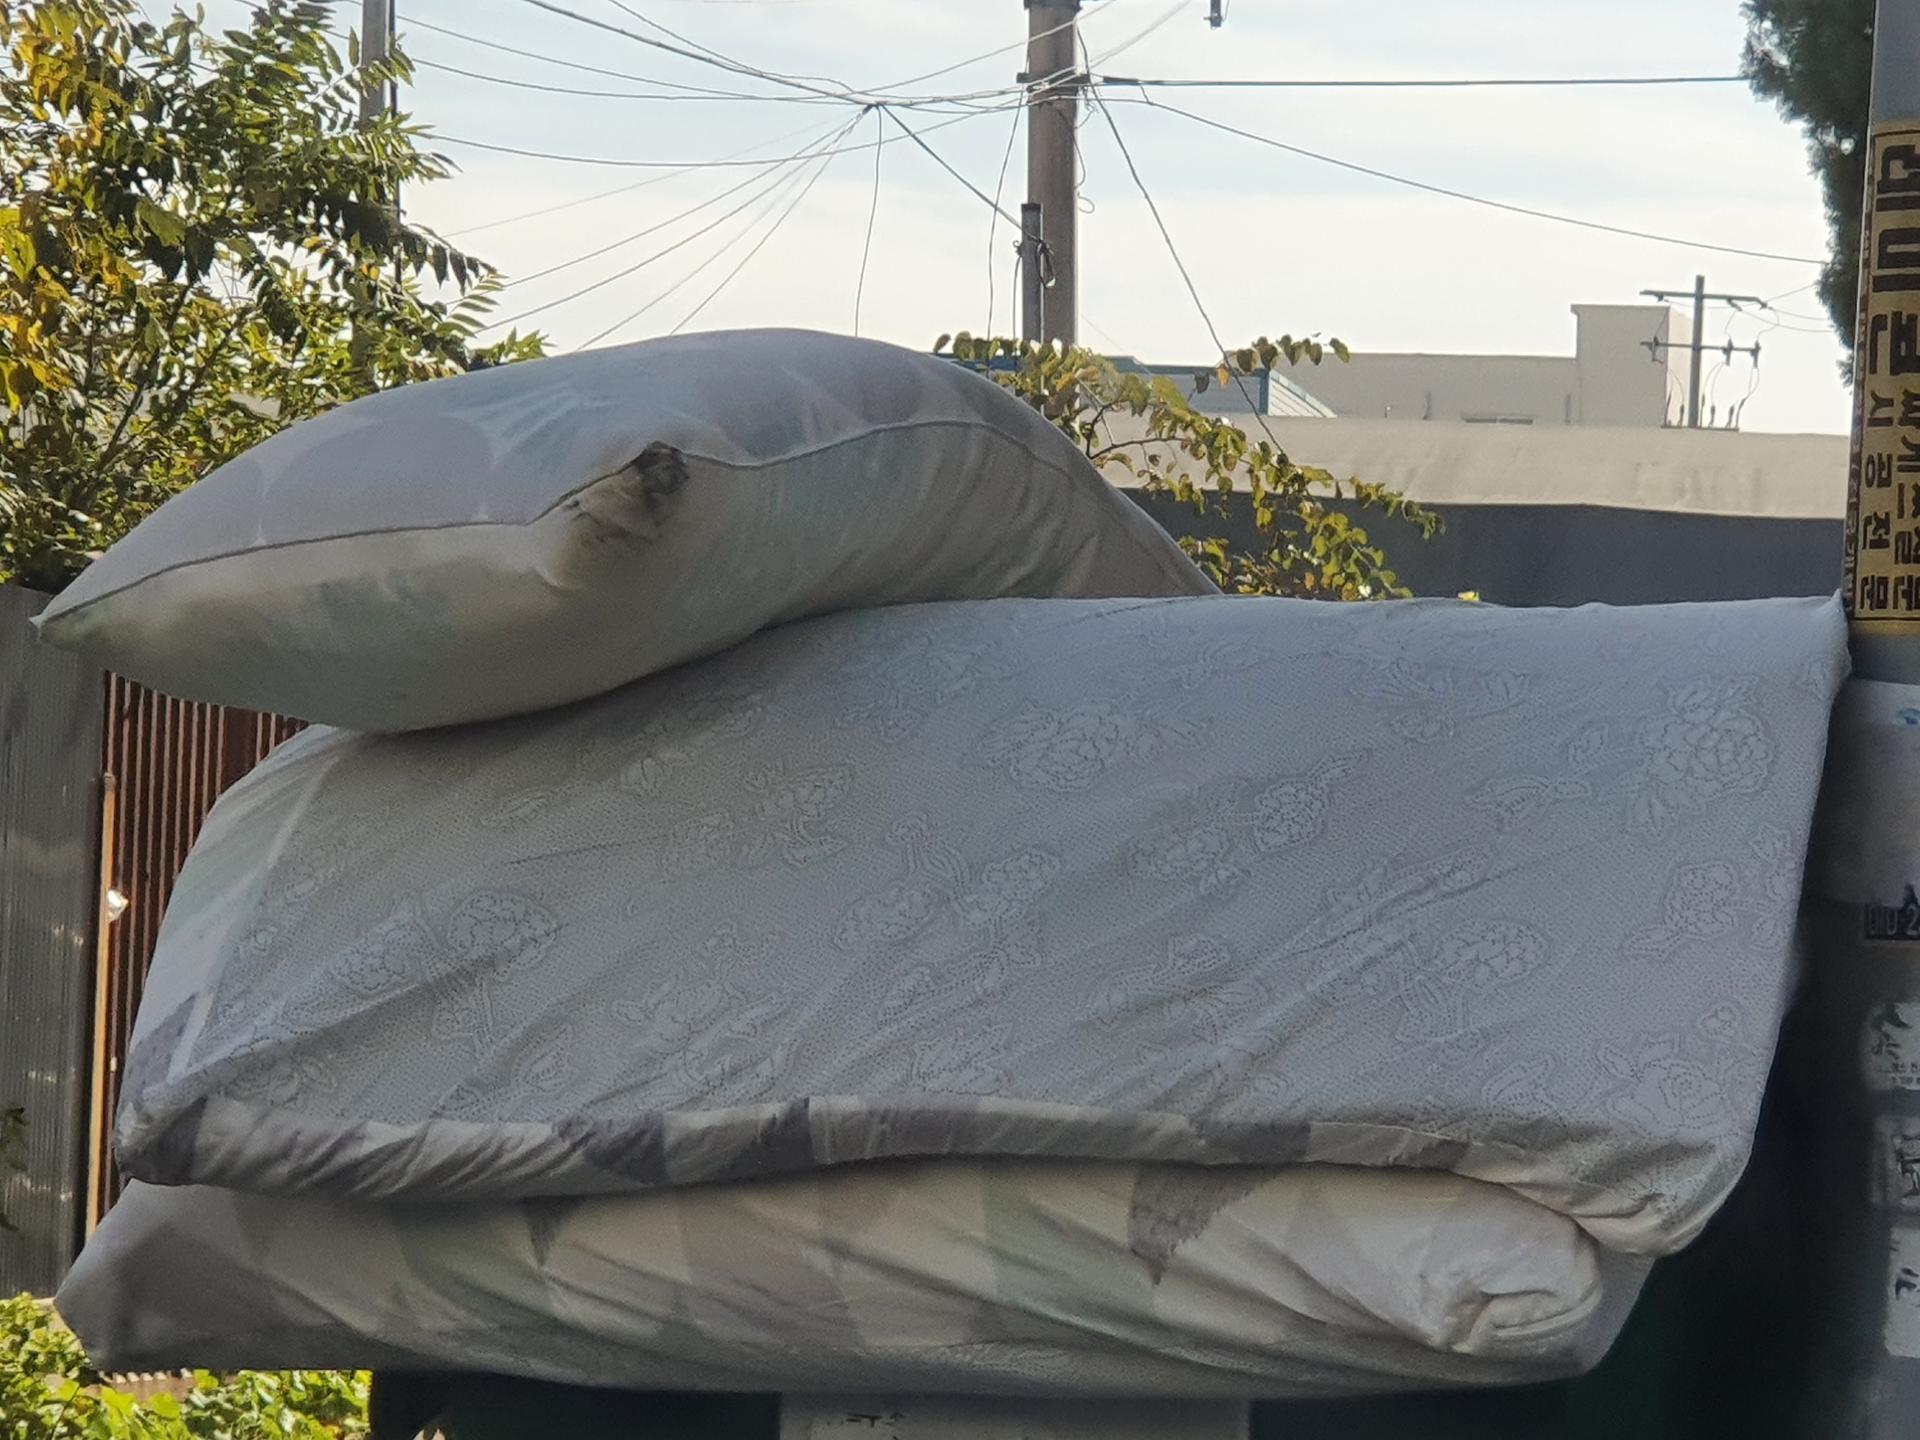
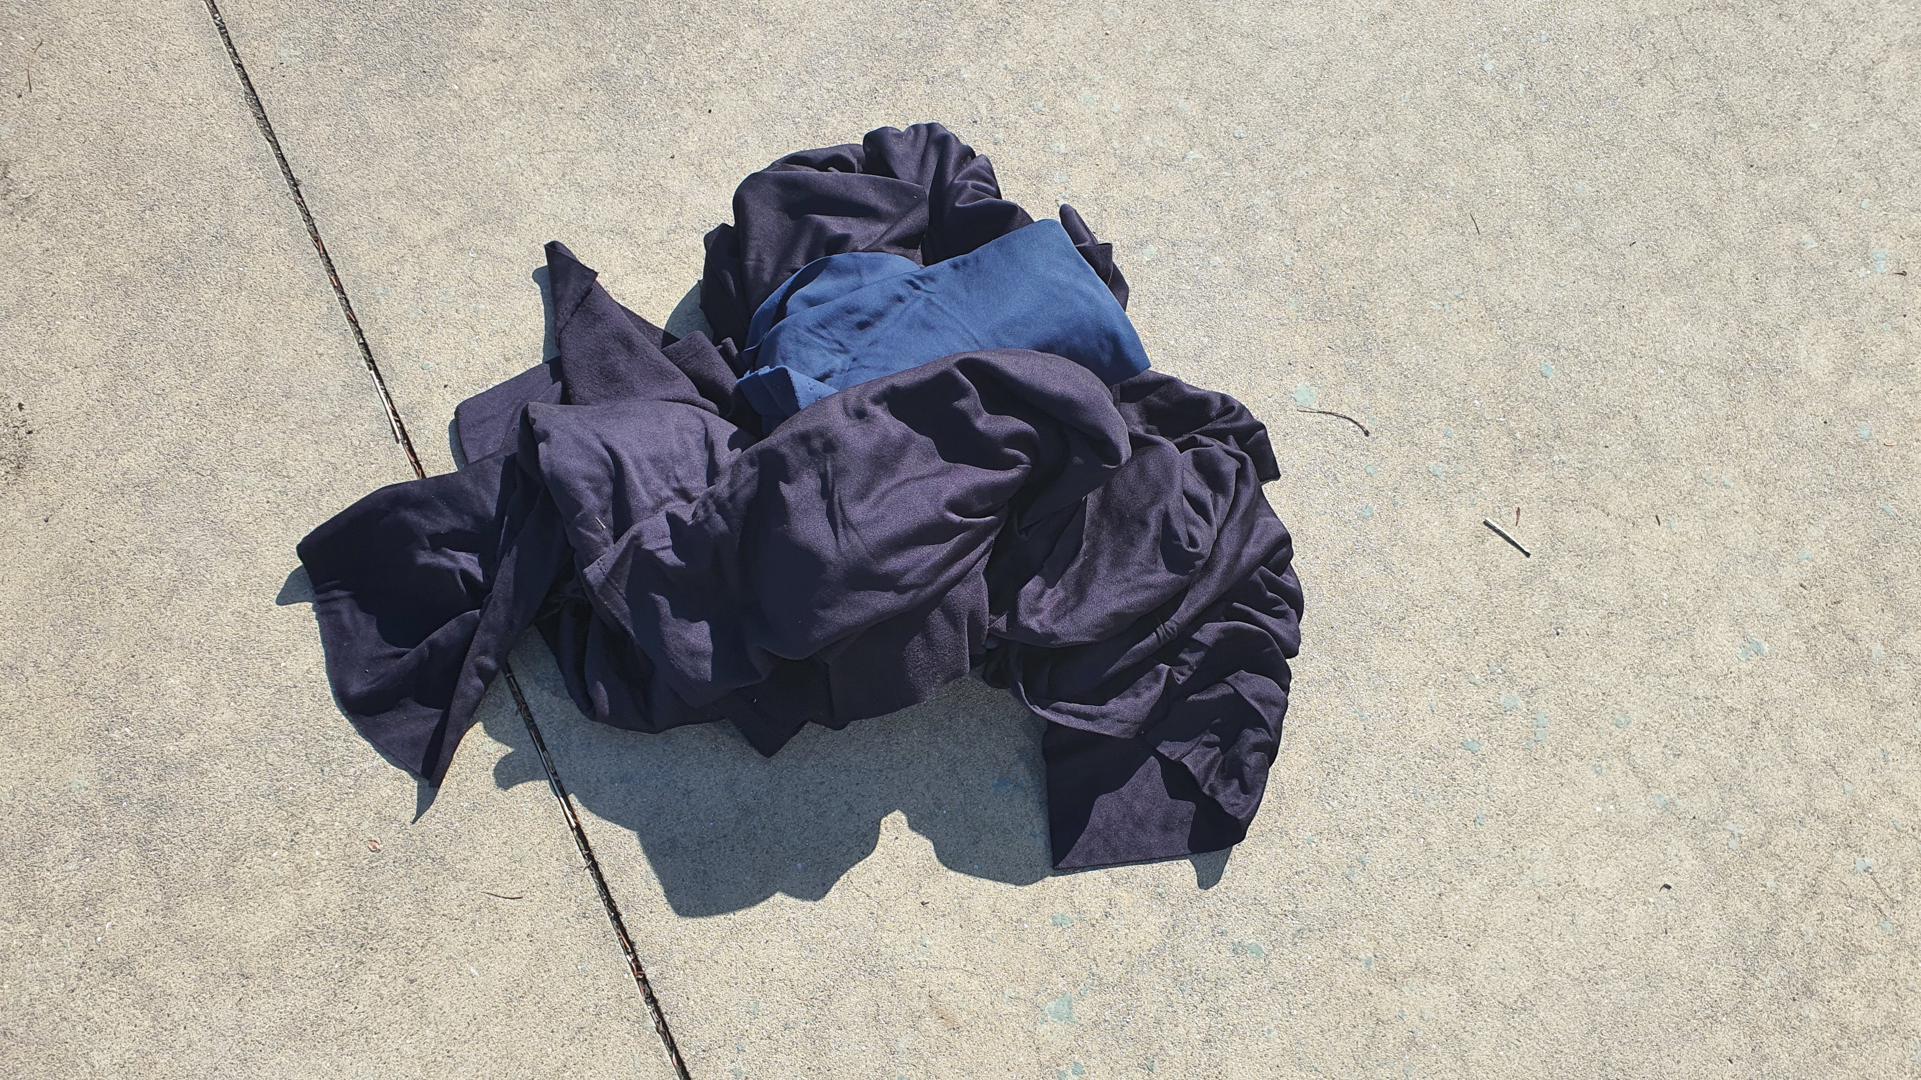
Clothing and fabric waste. Camping waste like sleeping bags and tents are separately classified. Contains many L1 mean images.
Plastic and vinyl waste. The most difficult class for AI — #1 low density (density 0.36). Extremely high shape diversity.
Paper and cardboard waste. Wallpaper's diverse patterns cause AI recognition confusion. Frequently appears as low-density outliers.
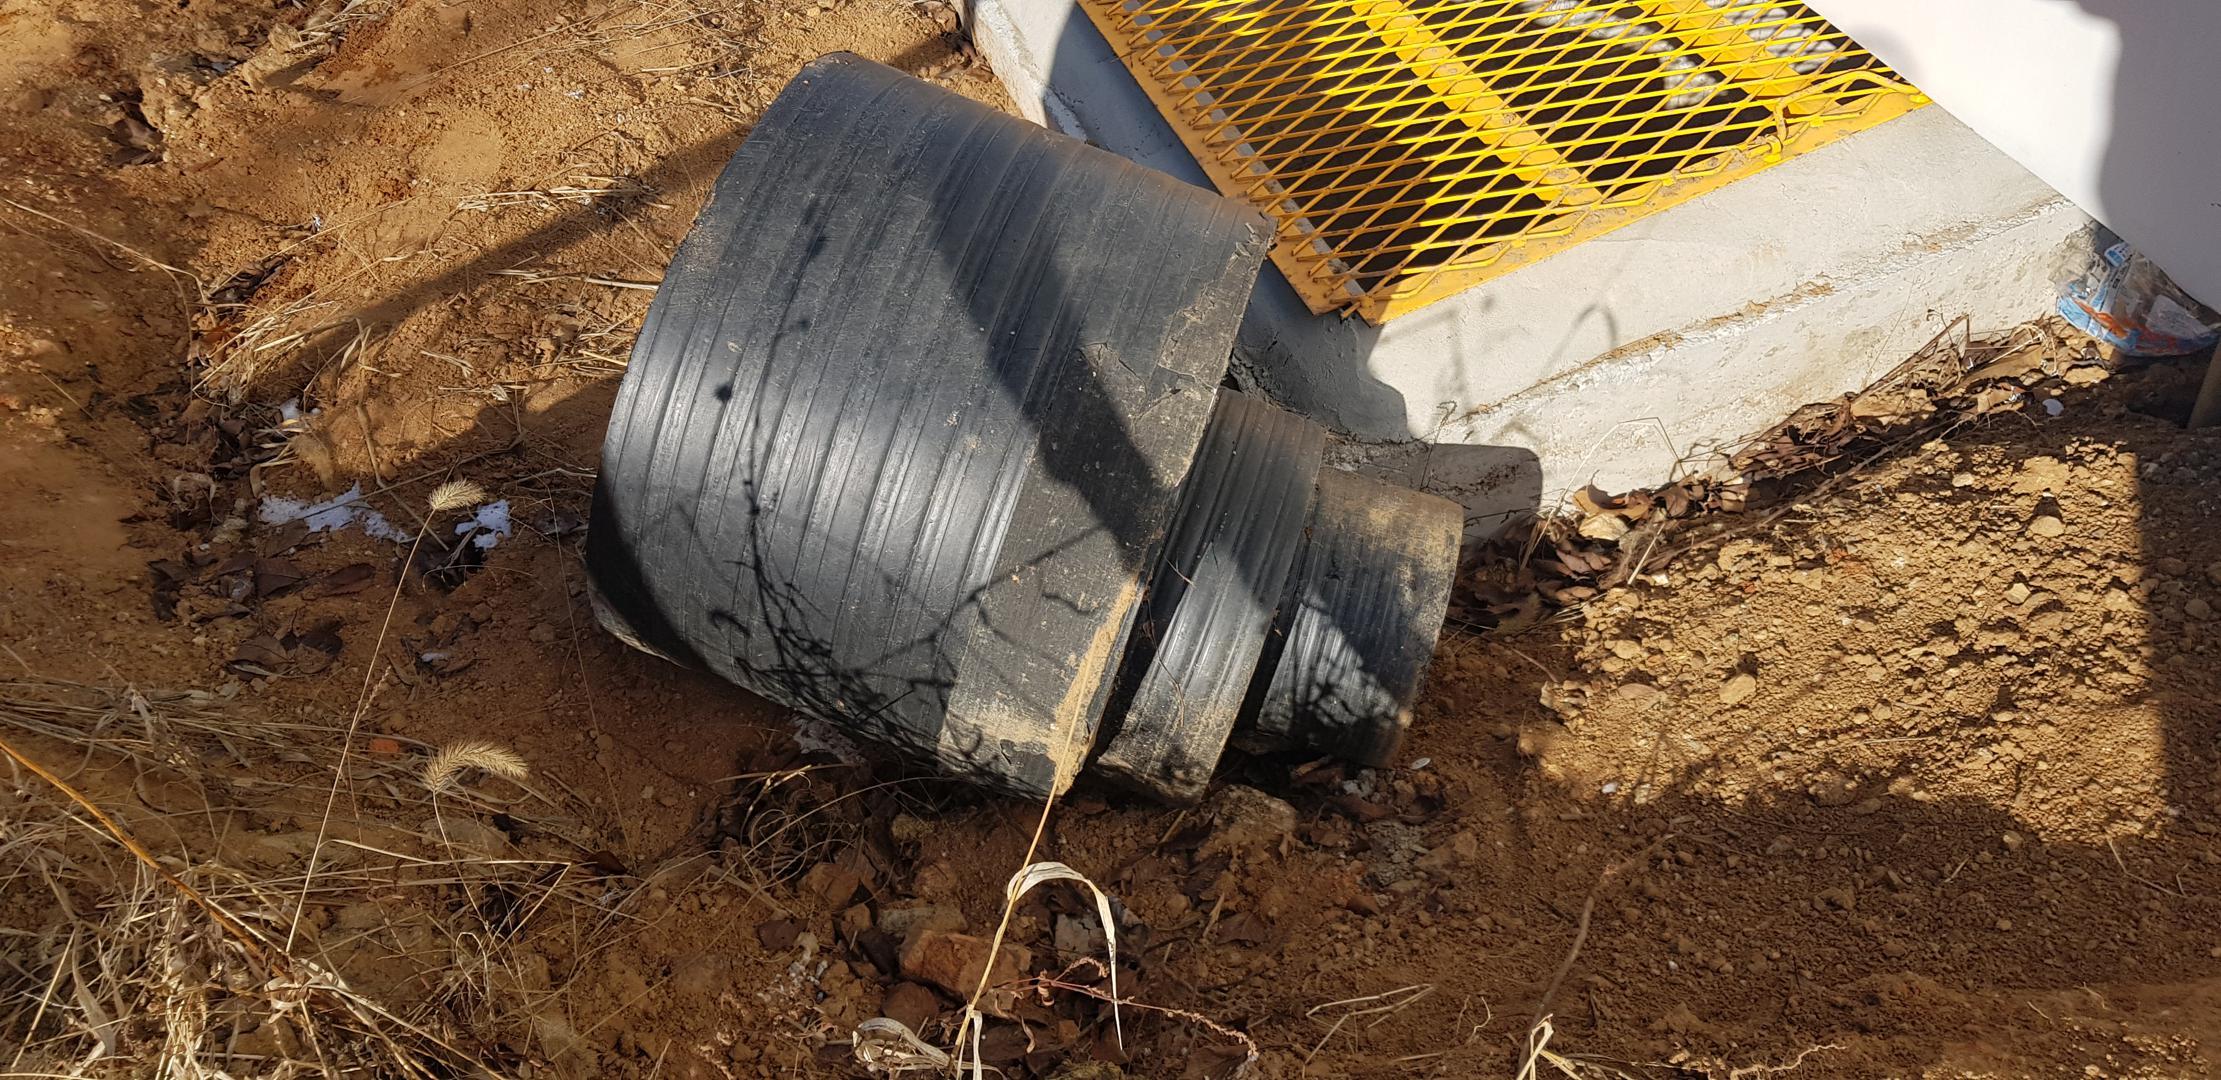
Construction waste. Sewer pipes with their cylindrical structure are the most 'different' waste from window glass — appearing as dissimilar pairs.
Level 1 — Basic Quality Diagnosis
✅ Strengths
- 🎨 RGB Channel Consistency: All images in unified RGB format
- 📐 High Resolution: Min 1,920×1,080px to Max 3,024×4,032px
- 🏷️ Label Integrity: No classification label consistency issues
- ✅ Minimal Missing Data: Only 2 images missing out of 1M (0.0002%)
⚠️ Key Issues
- 📊 Class Balance: Poor — Min 20 images vs Max 79,560 images
- 🔄 Visual Diversity: Poor — Too many similar images
- 📏 Resolution Inconsistency: Large gap between min and max resolution
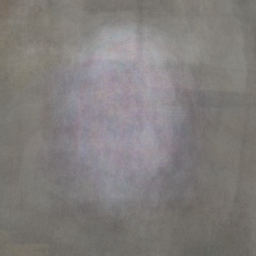
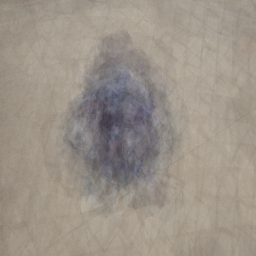
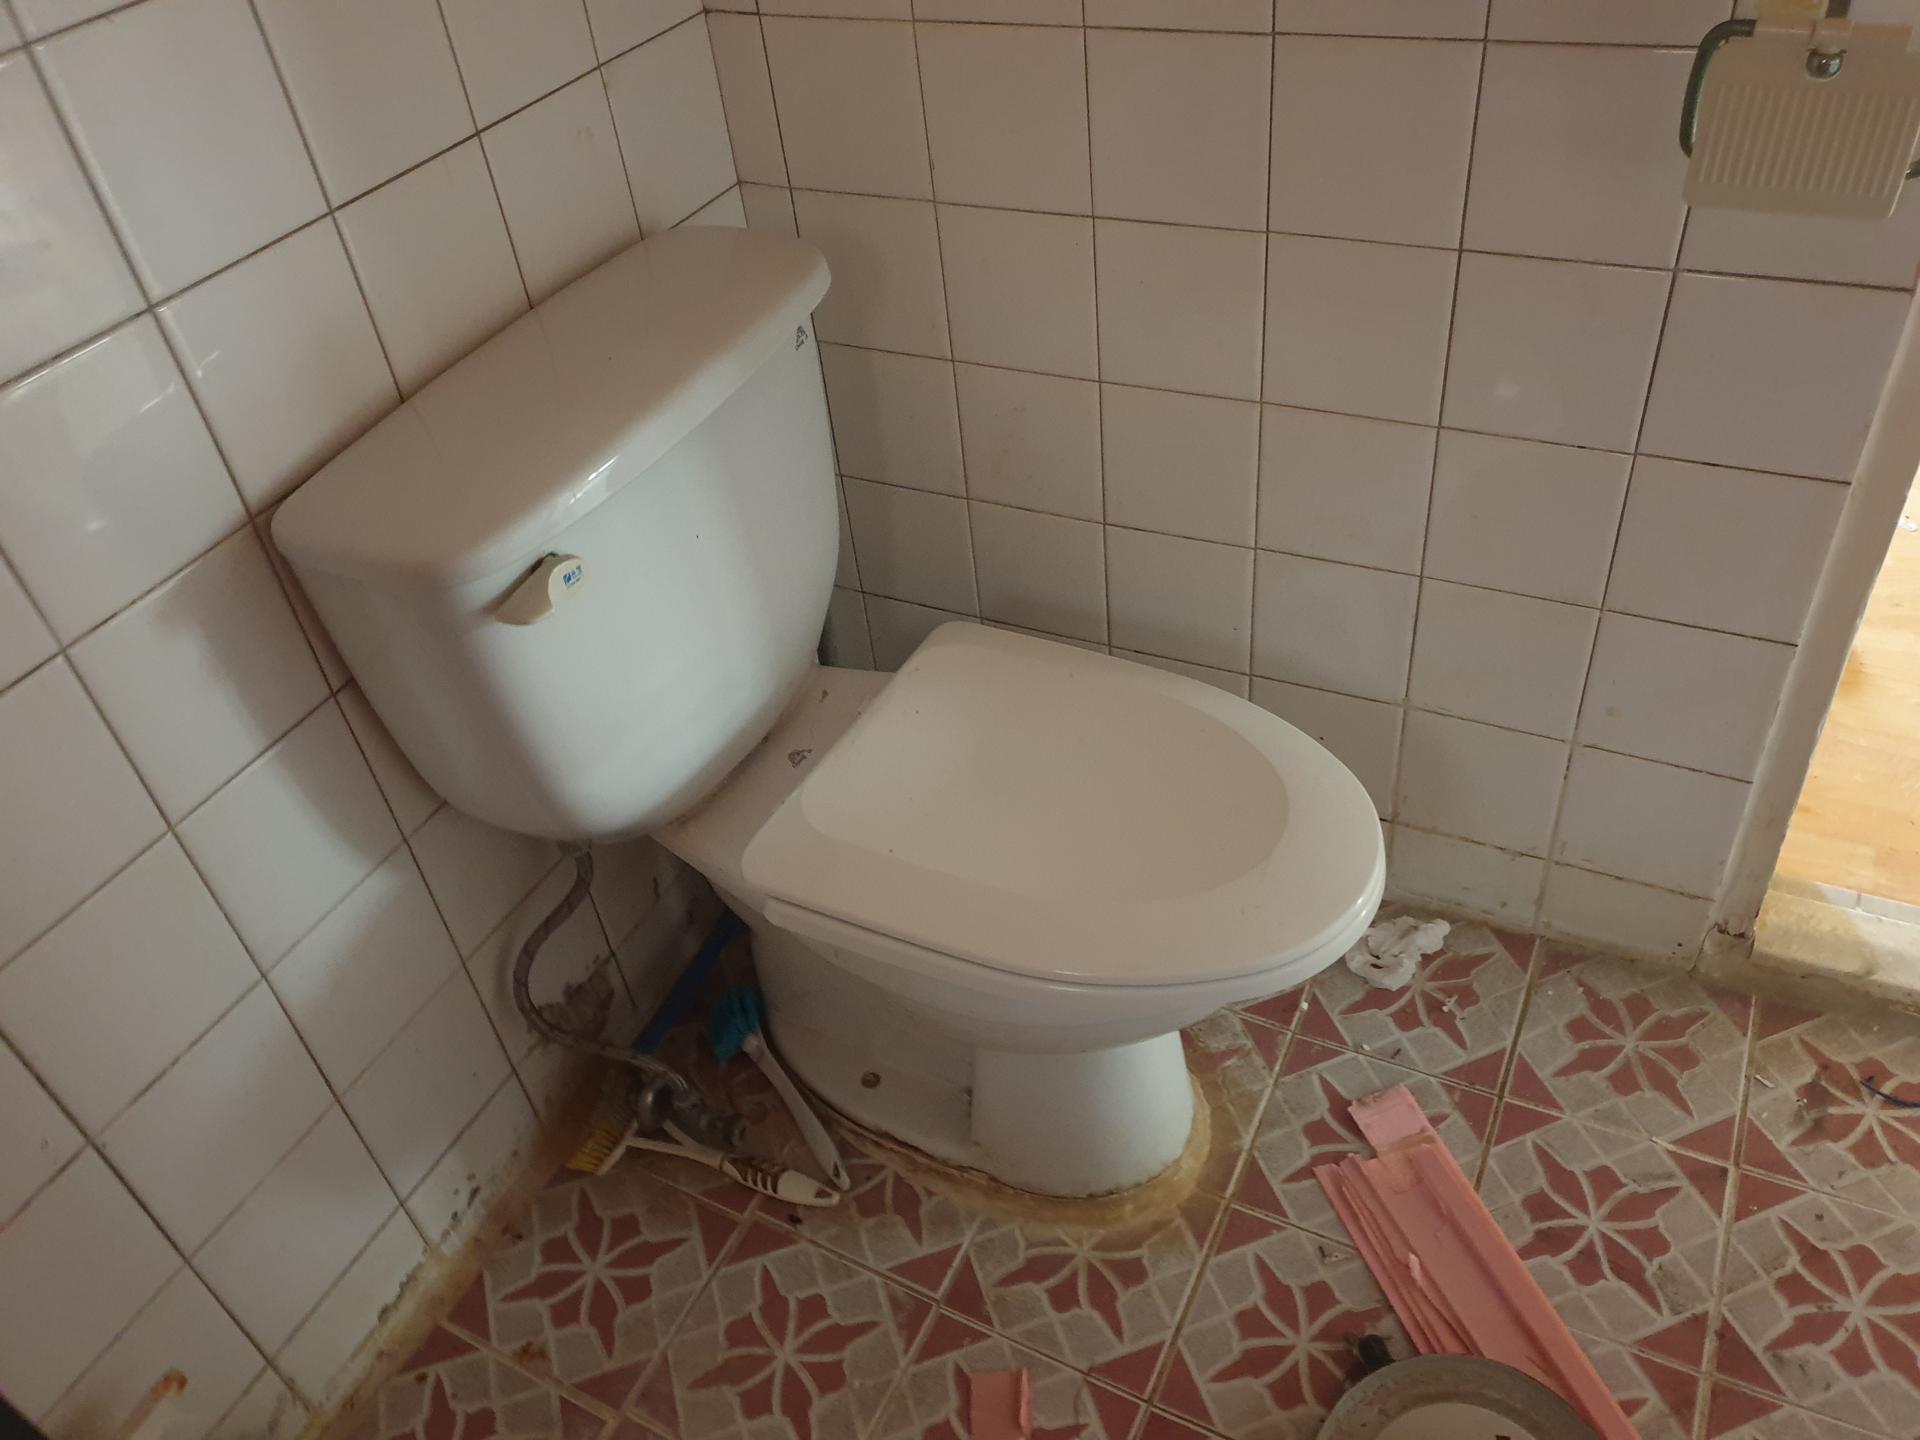
Class Mean Images — The "Face" of Each Waste Through AI's Eyes
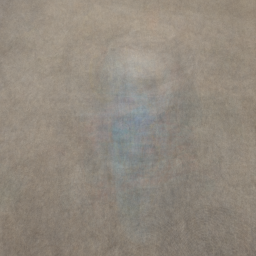
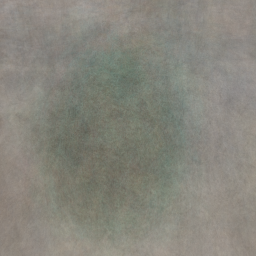
These are pixel-averaged results of each class's images. The blurrier the result, the higher the image diversity within that class; the sharper it looks, the more similar images are being repeated.
 Actual
 Mean
Mean
 Actual
 Mean
Mean
 Actual
 Mean
Mean
 Actual
 Mean
Mean
 Actual
 Mean
Mean
 Actual
 Mean
Mean
▲ Each card — Left: representative sample (actual image) / Right: mean image (pixel average of all images)
Class Imbalance Deep Dive — The Shock of 3,978x
The most critical issue with this dataset is class imbalance. While the average is 11,257 images per class, the standard deviation of 20,343 is 1.8 times larger than the mean, indicating extreme skewness.
⚠️ Class Imbalance Status
Min class (20 images) vs Max class (79,560 images) → 3,978x difference
Imbalance Visualization
🤔 Is this imbalance collection bias or reality?
The dominance of synthetic resin–vinyl (79,560 images) may genuinely reflect that vinyl waste is the most common in real industrial settings. If so, the imbalance faithfully mirrors reality, and forcibly balancing classes could produce a model disconnected from real-world distributions.
However, having a minimum class of only 20 images is less a reflection of reality than a collection gap. The ideal approach is to reference real-world distributions while ensuring every class has enough samples (at least several hundred) for the model to learn effectively.
Level 2 — DataLens Analysis (Wolfram ImageIdentify Net V2)
Analysis using a 1,280-dimensional general-purpose neural network. We examine how 72 waste classes are distributed in the feature space. Despite L1's severe imbalance, L2 geometry and distribution received a Good rating.
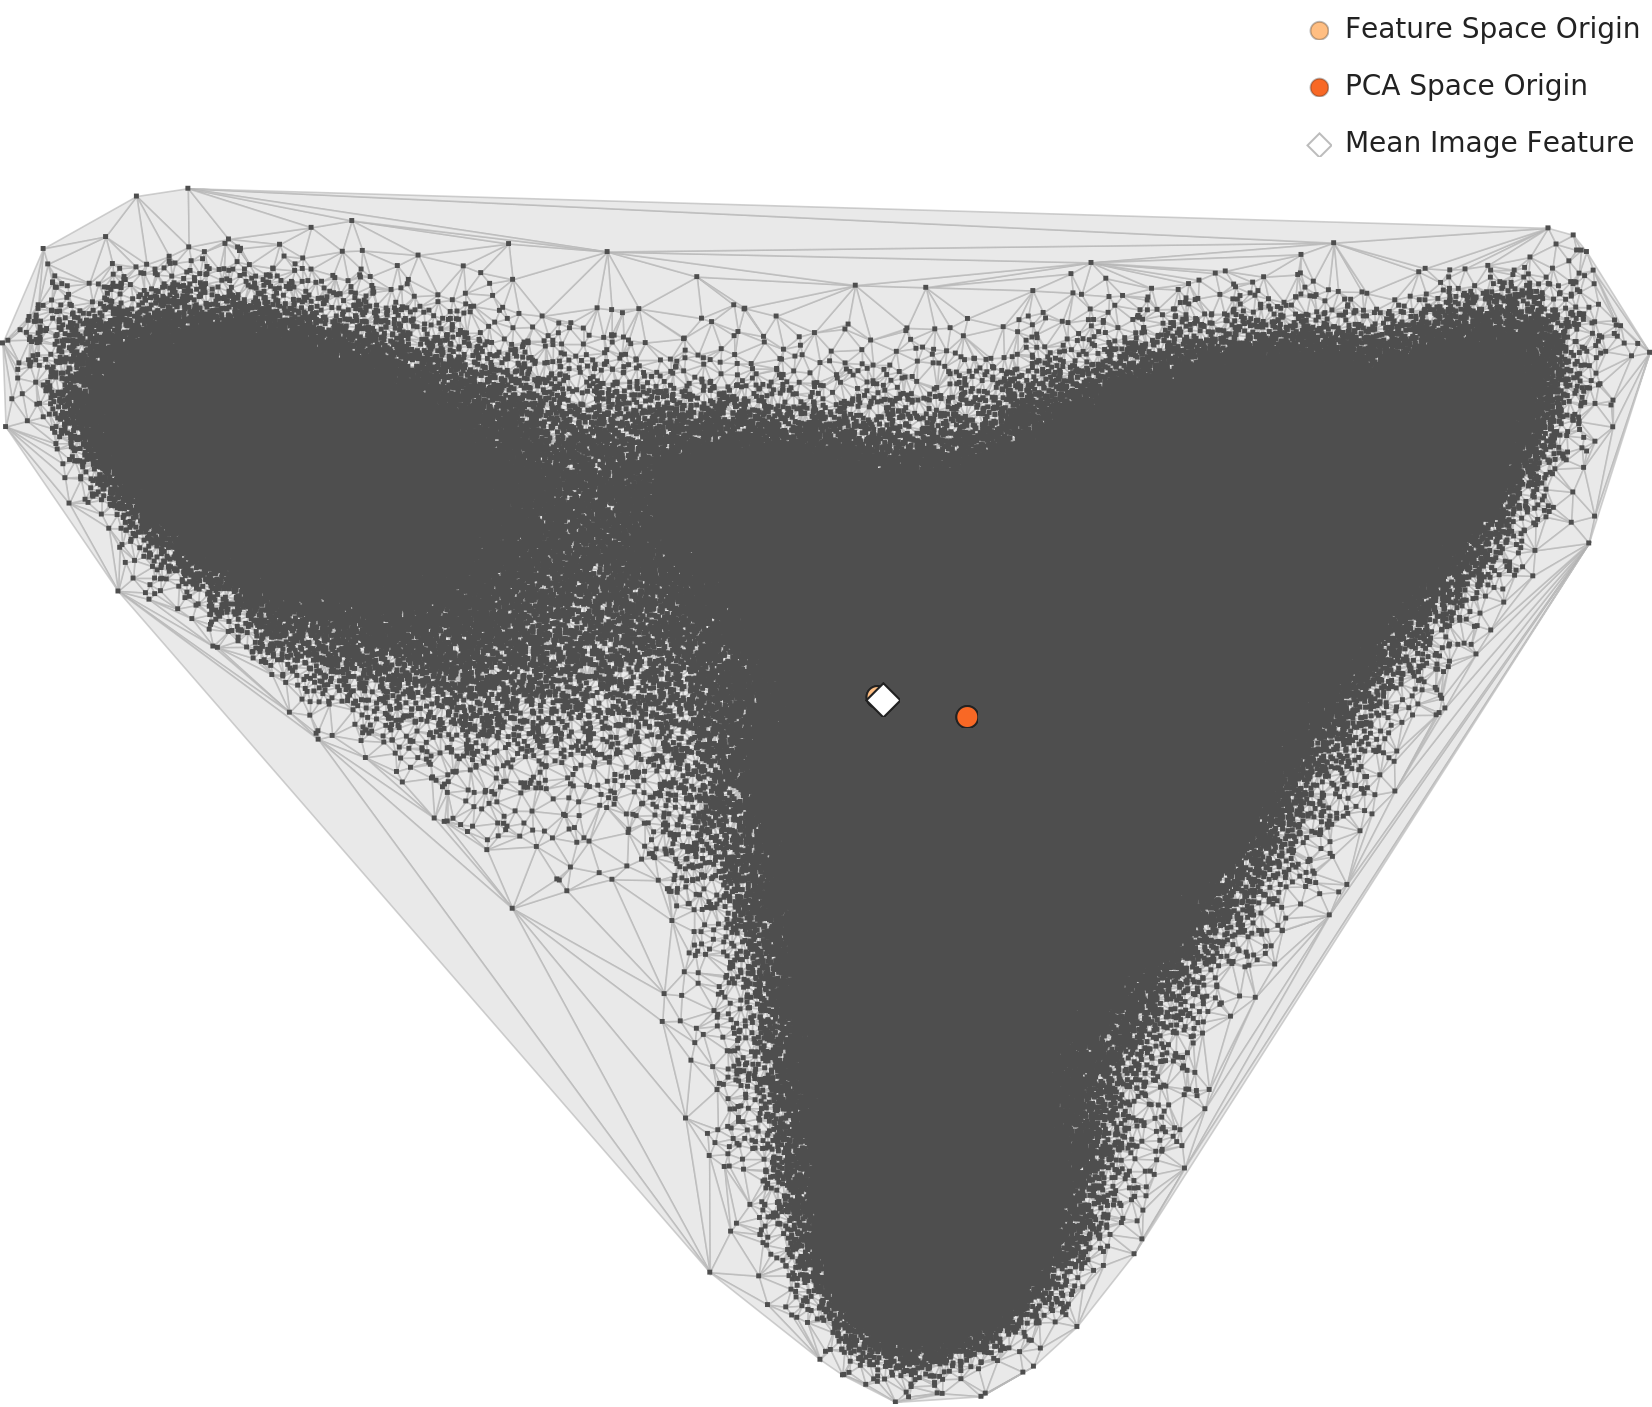
▲ Level 2 PCA Distribution — 72 classes naturally grouped into 5 clusters
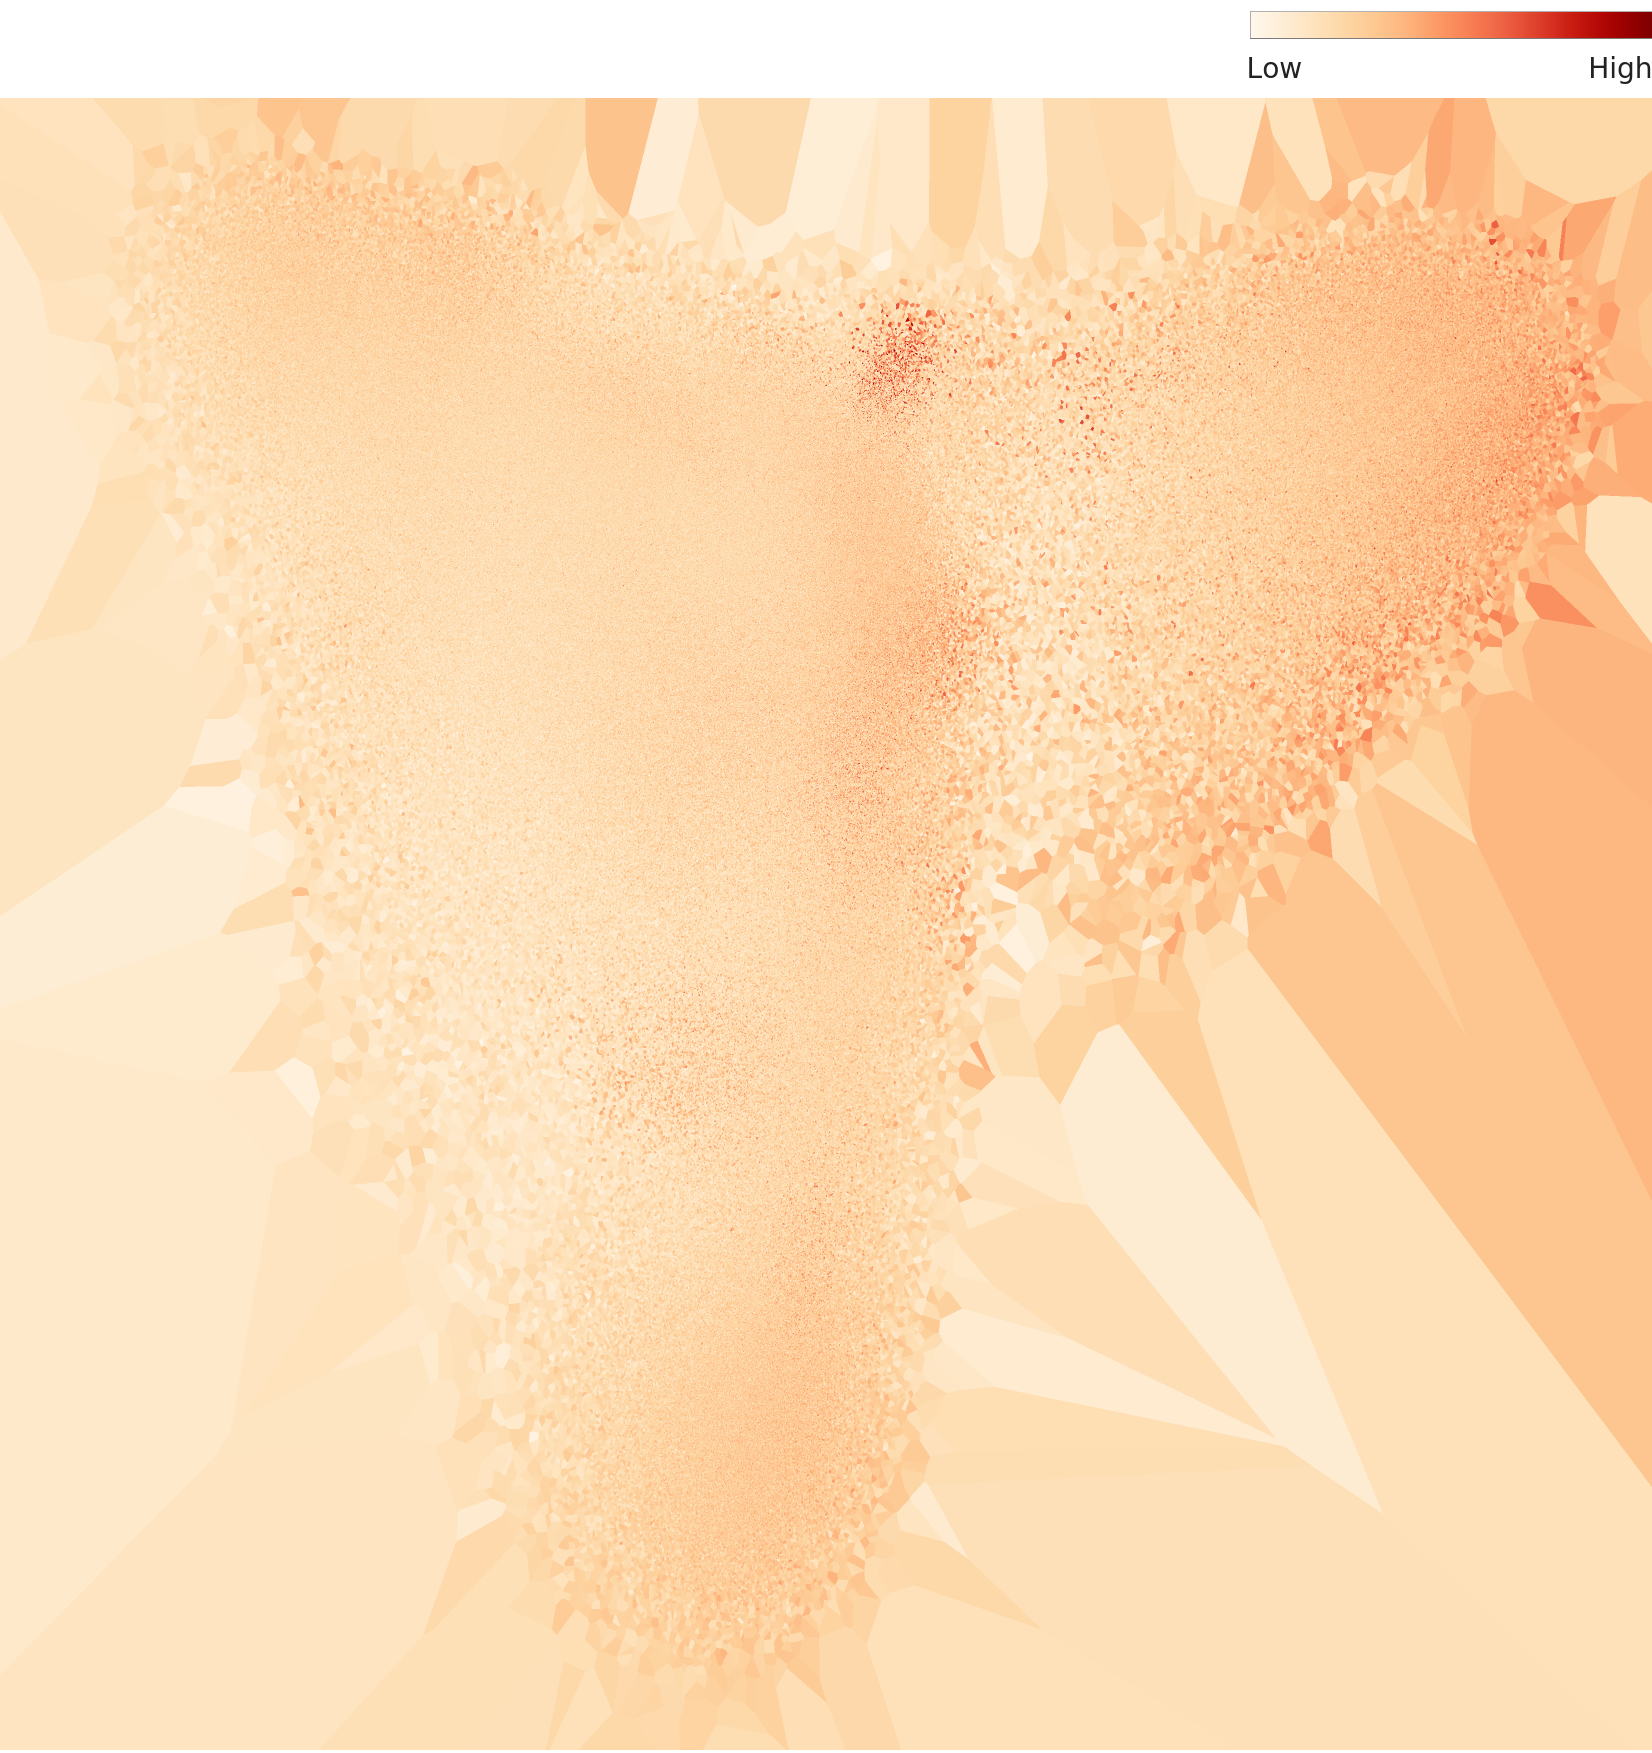
▲ Level 2 Overall Density Topography — 5 major clusters, bell-shaped uniform distribution
Per-Class Density Plots (L2)
 Density
Actual
Density
Actual
 Density
Actual
Density
Actual
 Density
Actual
Density
Actual
 Density
Actual
Density
Actual
 Density
Actual
Density
Actual
 Density
Actual
Density
Actual
▲ Each card — Left: L2 density distribution chart / Right: representative sample (actual image)
Level 3 — Domain-Specialized Analysis (136 Dimensions)
A domain-specialized lens optimized to 136 dimensions is applied. L2's 5 clusters are compressed into 3 in L3, providing clearer waste group distinctions. Both L3 geometry and distribution are Good — one of the few positive findings of this dataset.
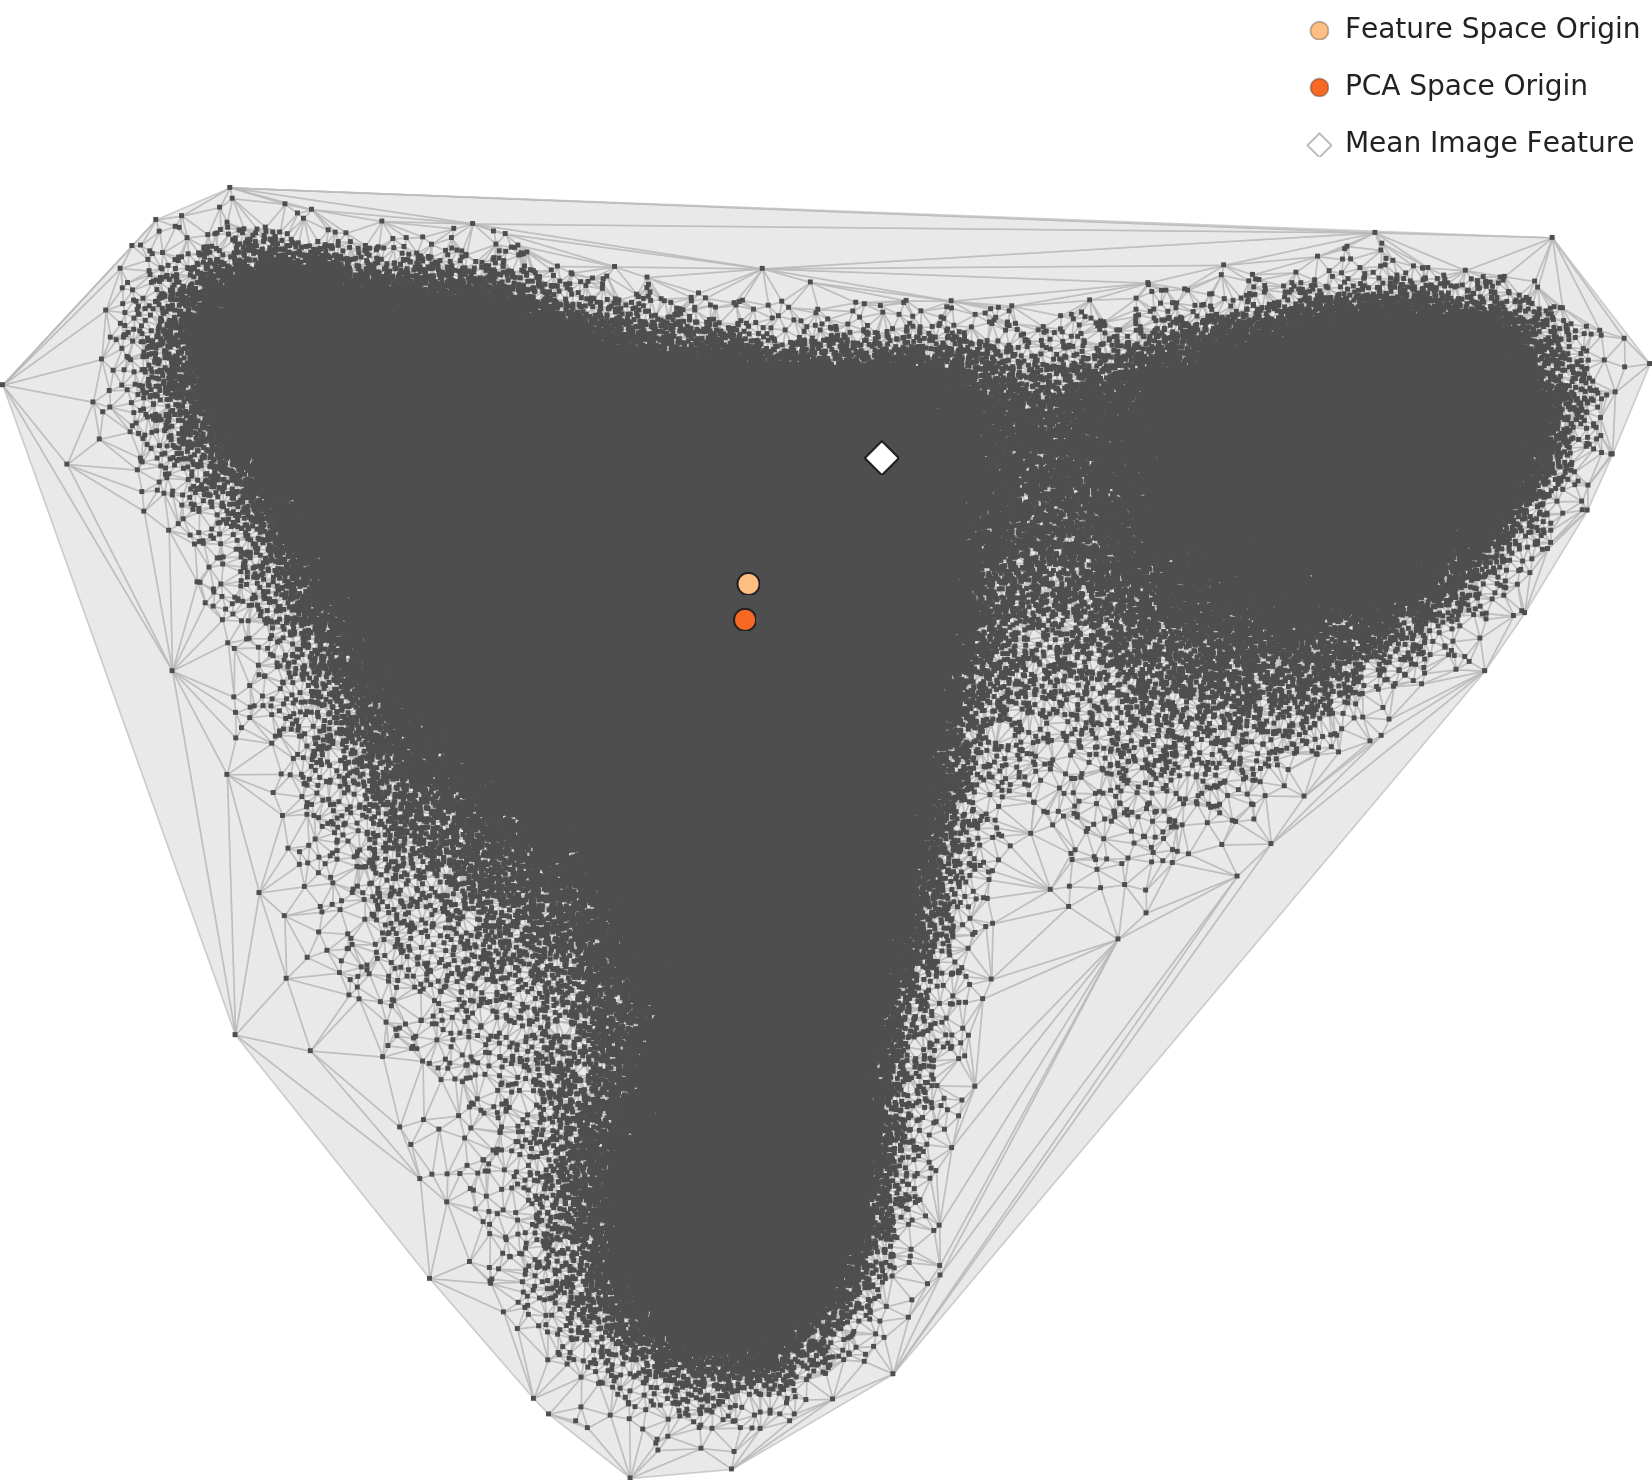
▲ Level 3 PCA Distribution — 3-cluster structure in domain-optimized 136 dimensions
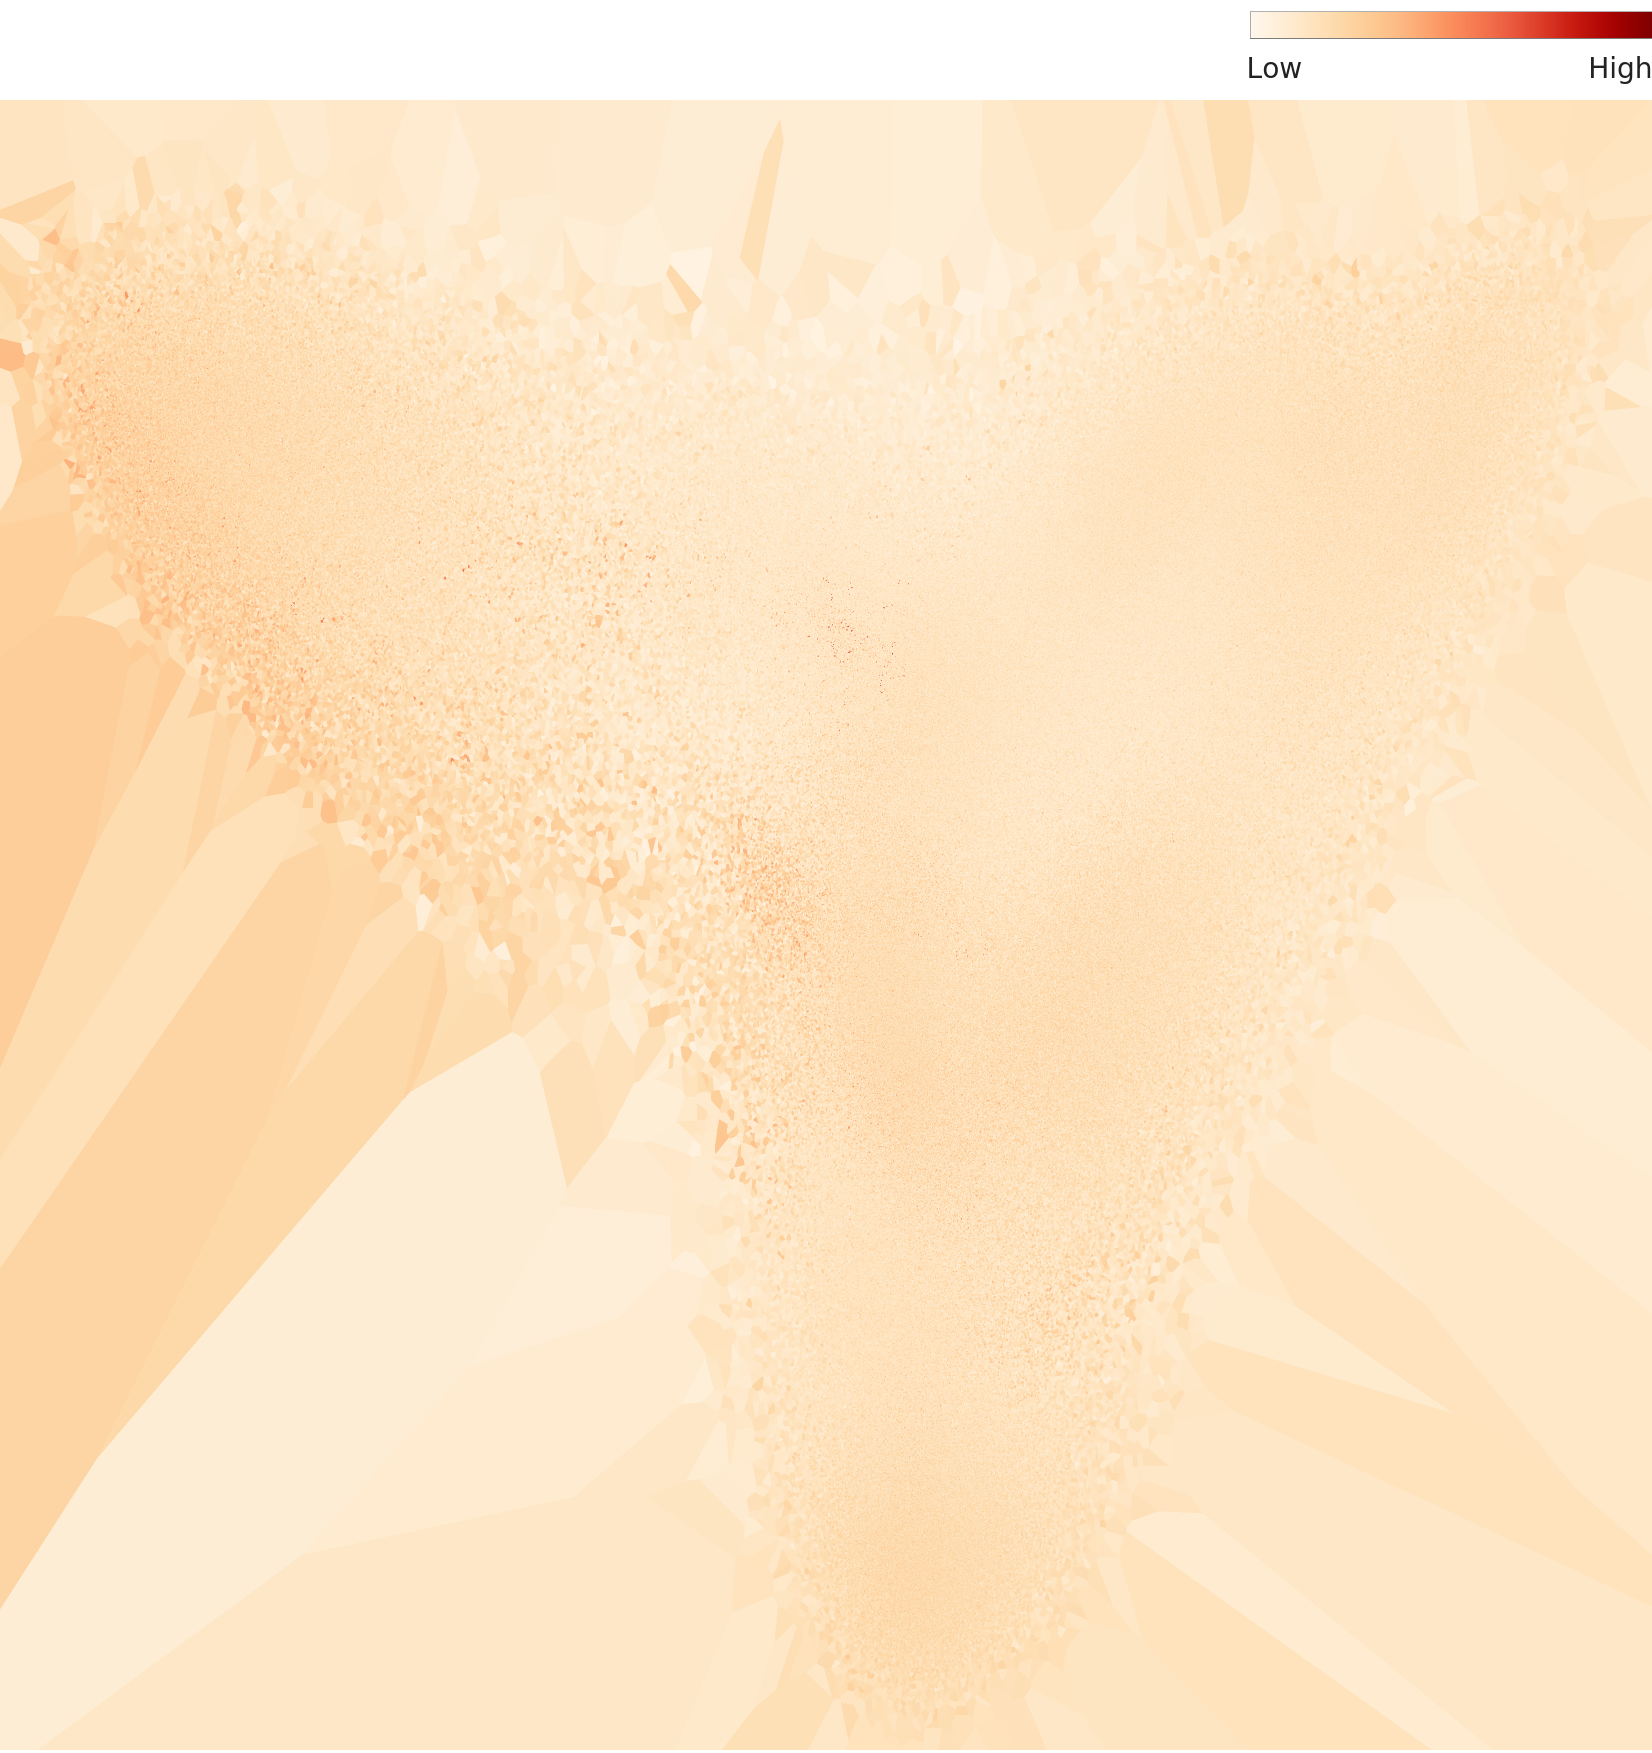
▲ Level 3 Density Topography — High-density concentration confirmed in certain classes (Glass & Ceramic-Ceramic)
3 Waste Groups Discovered by L3
Rigid Waste Group
Metal Waste, Glass & Ceramic, Waste Concrete. Common traits: hard, glossy or opaque textures. Ceramic is the core high-density cluster of this group.
Flexible Waste Group
Textile Waste, Vinyl/Film, soft Synthetic Resin. Flexible and crumplable forms. Highest shape variation, concentrating outliers.
Mixed / Boundary Group
Paper Waste and composite waste. Located at the boundary of Groups 1 and 2, with mixed material characteristics.
Per-Class Density Plots (L3)
 Density
Actual
Density
Actual
 Density
Actual
Density
Actual
 Density
Actual
Density
Actual
 Density
Actual
Density
Actual
 Density
Actual
Density
Actual
 Density
Actual
Density
Actual
▲ Each card — Left: L3 density distribution chart / Right: representative sample (actual image)
Outlier Analysis — Why Is Ceramic Typical and Plastic Abnormal?
📏 What is "density"? Here, density does not refer to physical mass but to data concentration in feature space. High-density classes have similar images that AI can easily classify — but excessively high density suggests duplicate images. Low-density classes have such diverse images that AI struggles to find consistent patterns — these are the "outliers."
🎯 High Density — The Most "Typical" Waste for AI (Glass & Ceramic-Ceramic)
Ceramic (도자기류) fragments rank overwhelmingly #1 across the entire dataset with a density of 2.13. With their consistent form (broken fragments) and distinctive glossy texture, ceramic is the waste AI can classify with the highest confidence.

⚠️ Low Density — The Most Confusing Outliers for AI
Synthetic Resin-Plastic (합성수지-플라스틱) and Metal-Paint Can (금속류-페인트통) dominate the low-density rankings. These are waste types with extremely diverse shapes or easily confused visually with other classes.
🔄 The Two Most Different Waste Types — Glass & Ceramic vs Window Glass / Waste Concrete
The farthest pair in L3: Glass & Ceramic-Others and Glass & Ceramic-Window Glass. Despite belonging to the same "Glass & Ceramic" major category, their detailed forms are extremely different.
Irregular glass fragments, transparent/translucent
Large flat glass panels, regular shape
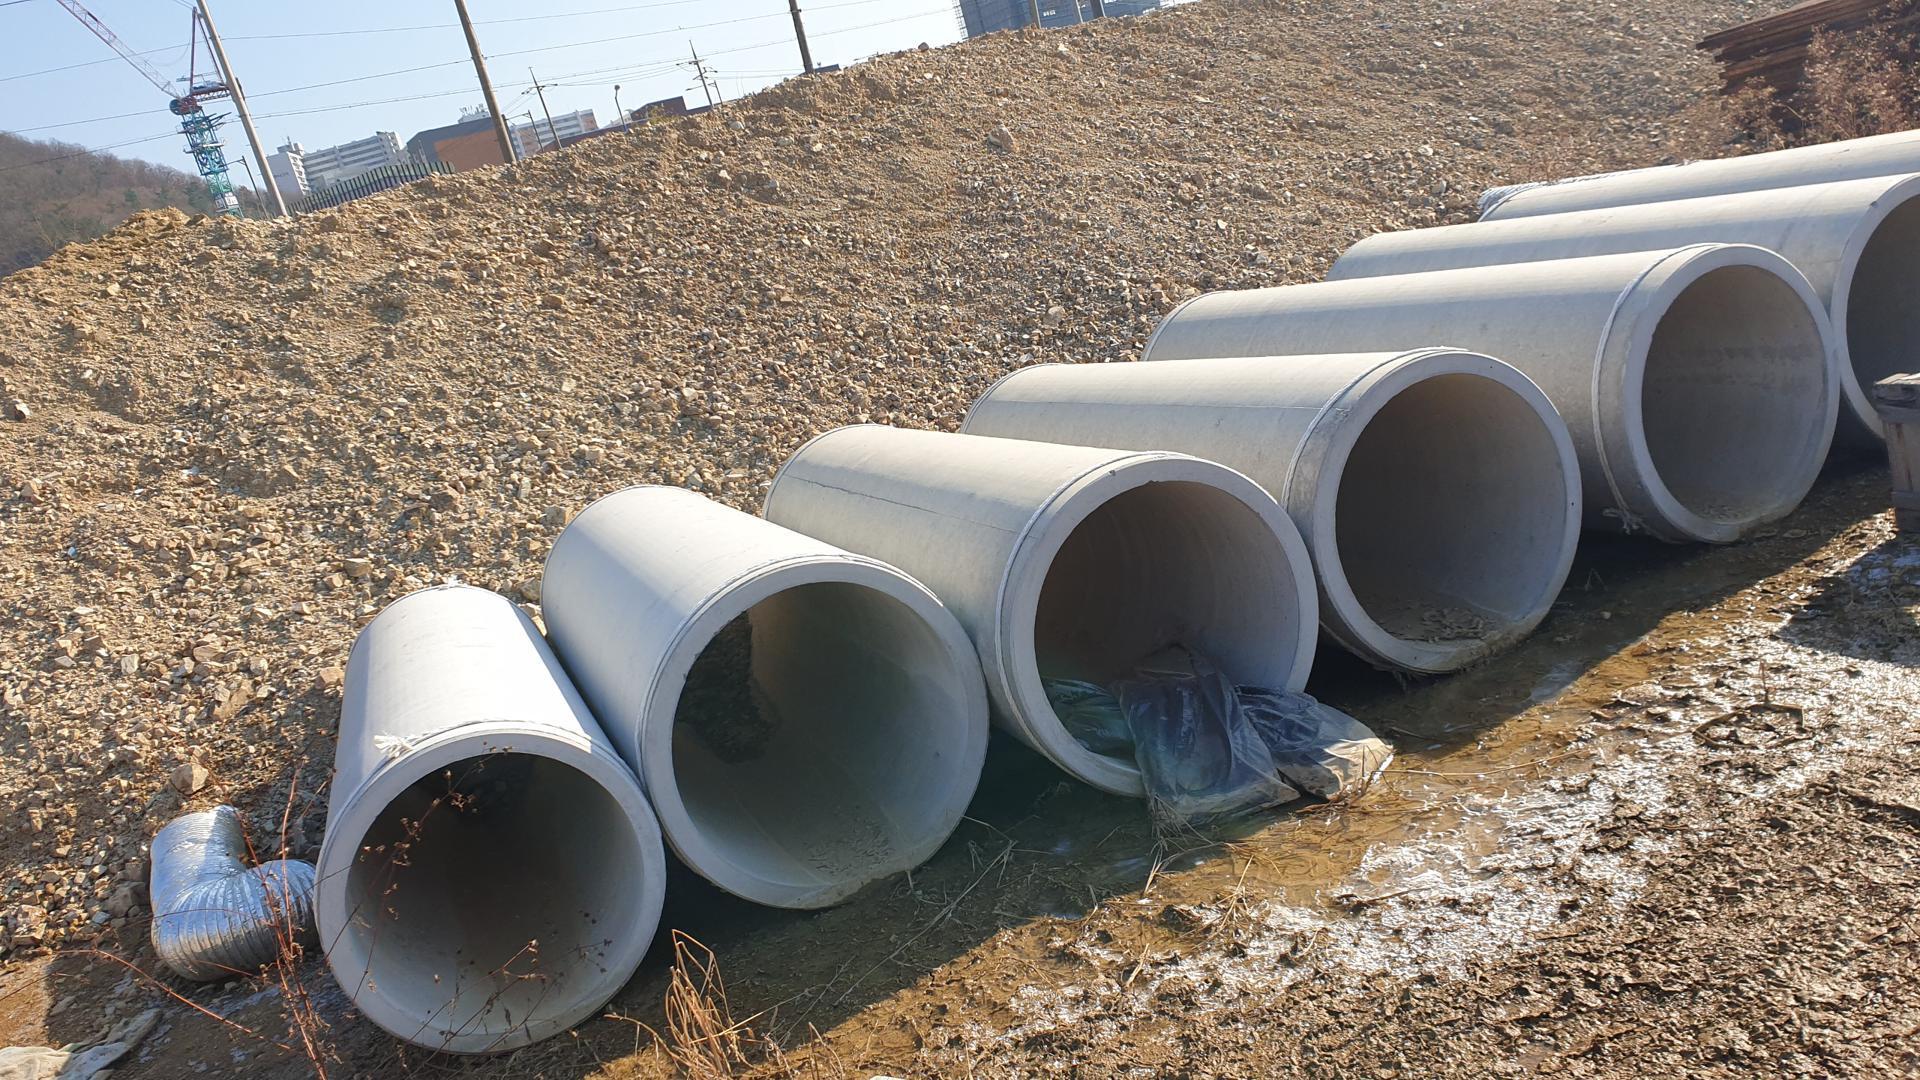
Cylindrical structure, gray texture
Transparent large glass panel, can be confused with structures
The existence of an extremely different pair within the same "Glass/Ceramics" major category is a positive signal that the classification taxonomy is appropriately granular. However, from an AI model perspective, training on major categories alone will inevitably cause confusion — fine-grained class labels are essential. These extreme pairs also flag boundary classes that require special attention during data augmentation — improper augmentation can actually degrade model performance.
Improvement Recommendations — From 51 to 70+
① Data Diet
Remove similar images shot consecutively at the same location on the same day. As seen in the ceramic high-density cluster, images with density above 2.0 are likely duplicates.
Expected Effect: L1 Statistics 'Poor' → 'Fair'
② Data Bulk-up
Add images from the minimum class (20 images) through mid-range classes. Goal: Bring the minimum class up to at least 50% of the average (approx. 5,000 images). Both data augmentation and additional photography can be used.
Expected Effect: L1 Class Balance 'Poor' → 'Fair~Good'
🎯 Practical Priority Suggestions
- Remove duplicate images (Diet) — Quick quality improvement
- Focus on reinforcing classes with 20–100 images (Bulk-up)
- Expand diversity of low-density outlier classes (Plastic, Metal-Paint Can)
- Standardize resolution — Unify camera equipment and shooting distance guidelines
Conclusion — The Potential and Challenges of 1 Million Images
The Industrial Waste Image dataset is impressive in scale. Its comprehensive coverage of 1 million images across 72 classes demonstrates the Korean government's commitment to AI data investment. However, the DataClinic score of 51 reveals a sobering reality — scale does not guarantee quality.
The 3,978x class imbalance and excess of similar images risk creating a biased AI if used directly for model training. But the good L2/L3 distribution structure means the data structure itself is sound — improvement through Diet and Bulk-up is entirely achievable.
Waste classification AI is a core technology for carbon neutrality and the circular economy. If this dataset is refined one step further, it can become a powerful foundation for automated waste classification and recycling AI at Korean industrial sites.
Industrial Waste Image Key Summary
Original DataClinic Report: dataclinic.ai/en/report/131 · AI Hub Original Data: AIHub #137 · Commercial use allowed
🔗 Related Datasets — Complementary Waste & Environmental Data
Household Waste Images (AI Hub)
Household and commercial waste images. Comparing with industrial waste reveals differences in classification schemes and image characteristics.
Search on AI Hub →TrashNet (Stanford)
2,527 images across 6 recyclable categories. Small in scale but well-balanced — a stark contrast to this dataset's imbalance issues.
GitHub →TACO (Trash Annotations in Context)
Real-environment litter images with segmentation annotations. Ideal for training object detection models.
tacodataset.org →WasteNet (Kaggle)
Recyclable vs. non-recyclable binary classification dataset. Useful for quick baseline models and transfer learning experiments.
Search on Kaggle →