Executive Summary
This story is built on DataClinic Report #127. The subject is AI Hub's K-Fashion image dataset: 967,806 Korean fashion photos labeled across 24 styles, from Street, Modern, Romantic and Feminine to Punk and Hip-hop. We looked at all of it through DataClinic's three-stage lens.
The official scorecard looks excellent. The style-classification benchmark published by AI Hub reports Recall@3 of 91.11%. By the numbers, this is "data that works." But once DataClinic unfolds the distribution, three things accuracy was hiding come into view: an extreme imbalance in which a single Street class makes up 46.5% of everything, batches of nearly identical photos from a single shoot (near-duplicates), and a blurriness in the style boundaries that even humans struggle to agree on.
The sharpest piece of evidence was the #1 and #2 "most typical Street" images surfaced by the class-discriminative lens (L3). Open them up and you find a clearly Romantic look: a floral chiffon blouse and skinny jeans against a white studio backdrop. Meanwhile, an oversized graphic sweatshirt shot by a city window was pushed out as "atypical." The "typical Street" the AI had learned wasn't the clothing. It was the shooting format. This story follows that paradox through the actual images.
The Dataset — 970,000 Korean Fashion Photos
K-Fashion is a Korean fashion dataset built in 2020 by OpinionLive, together with Ewha Womans University, the Korea Fashion Industry Research Institute, AI.M and Wearly, and released on AI Hub. The full set runs to roughly 1.2 million images, annotated not just with a style label but with polygons, bounding boxes and attributes for each fashion item. With 66,321 views and 4,059 downloads, it is a heavily used asset in Korean fashion-AI research.
This diagnosis used the 967,806 training images. Below is a collage that captures the dataset's overall mood at a glance. In words: most of them are lookbook-style photos of a full standing body shot in a bright indoor setting. That consistent shooting format becomes an important foreshadowing for the analysis to come.
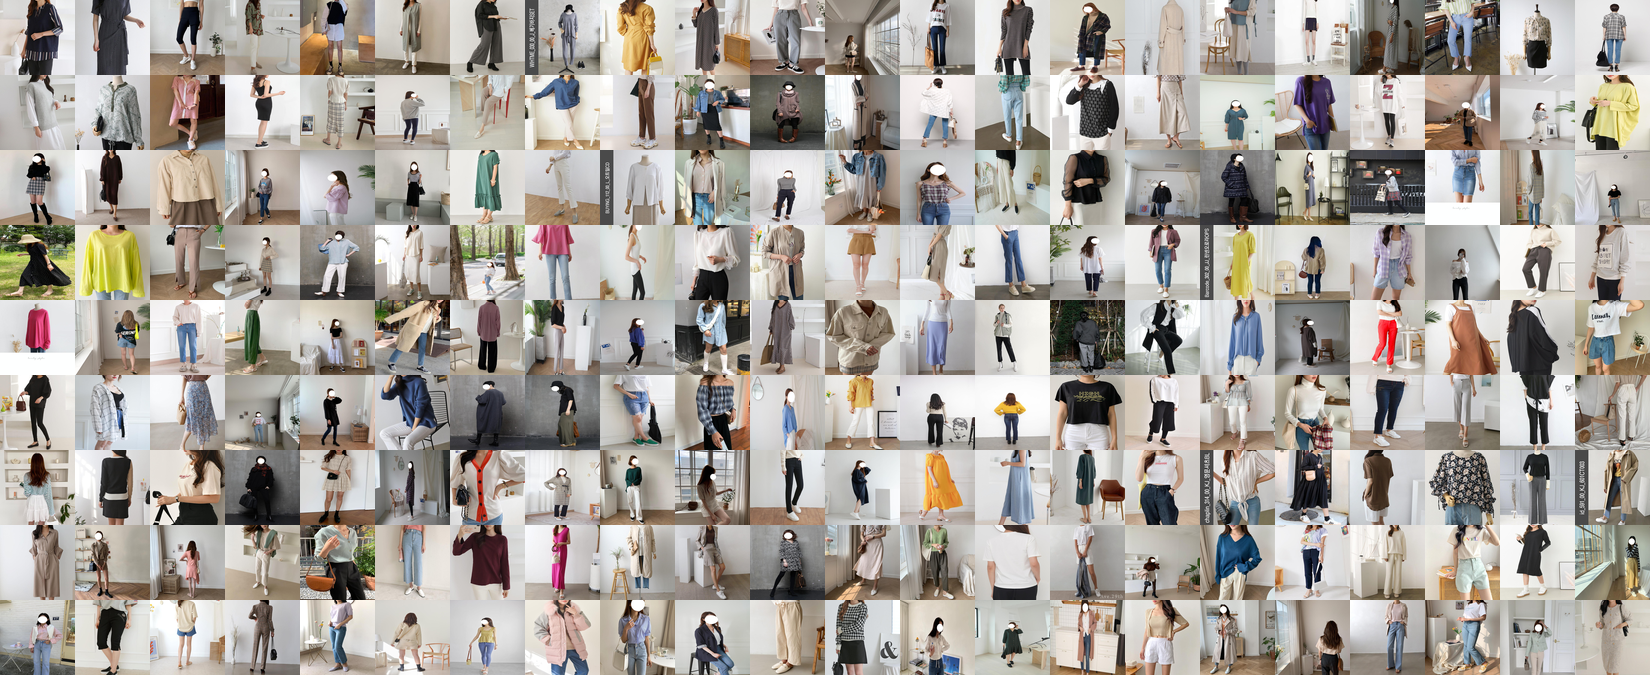
▲ The K-Fashion collage: 24 styles, 967,806 images. Most are bright-indoor, full-body lookbook frames — a fairly homogeneous shooting format.
On the surface it's an abundant dataset. The problem is that the photos aren't spread evenly across the 24 styles. Street alone holds 449,494 images (46.5%), nearly half the total, and more than five times the runner-up, Feminine (88,325). At the other end sit tiny classes of roughly a thousand images or fewer: Punk at 382, Hip-hop at 1,240, Western at 1,712. The average is 40,325 images per class, but the standard deviation is 91,811, larger than the mean. In other words, the distribution doesn't cluster around the average; it splits to the extremes in a long tail.
▲ Image counts for a few of the 24 classes (bar length is relative to Street's 449,494). Street has roughly 1,177× as many images as Punk.
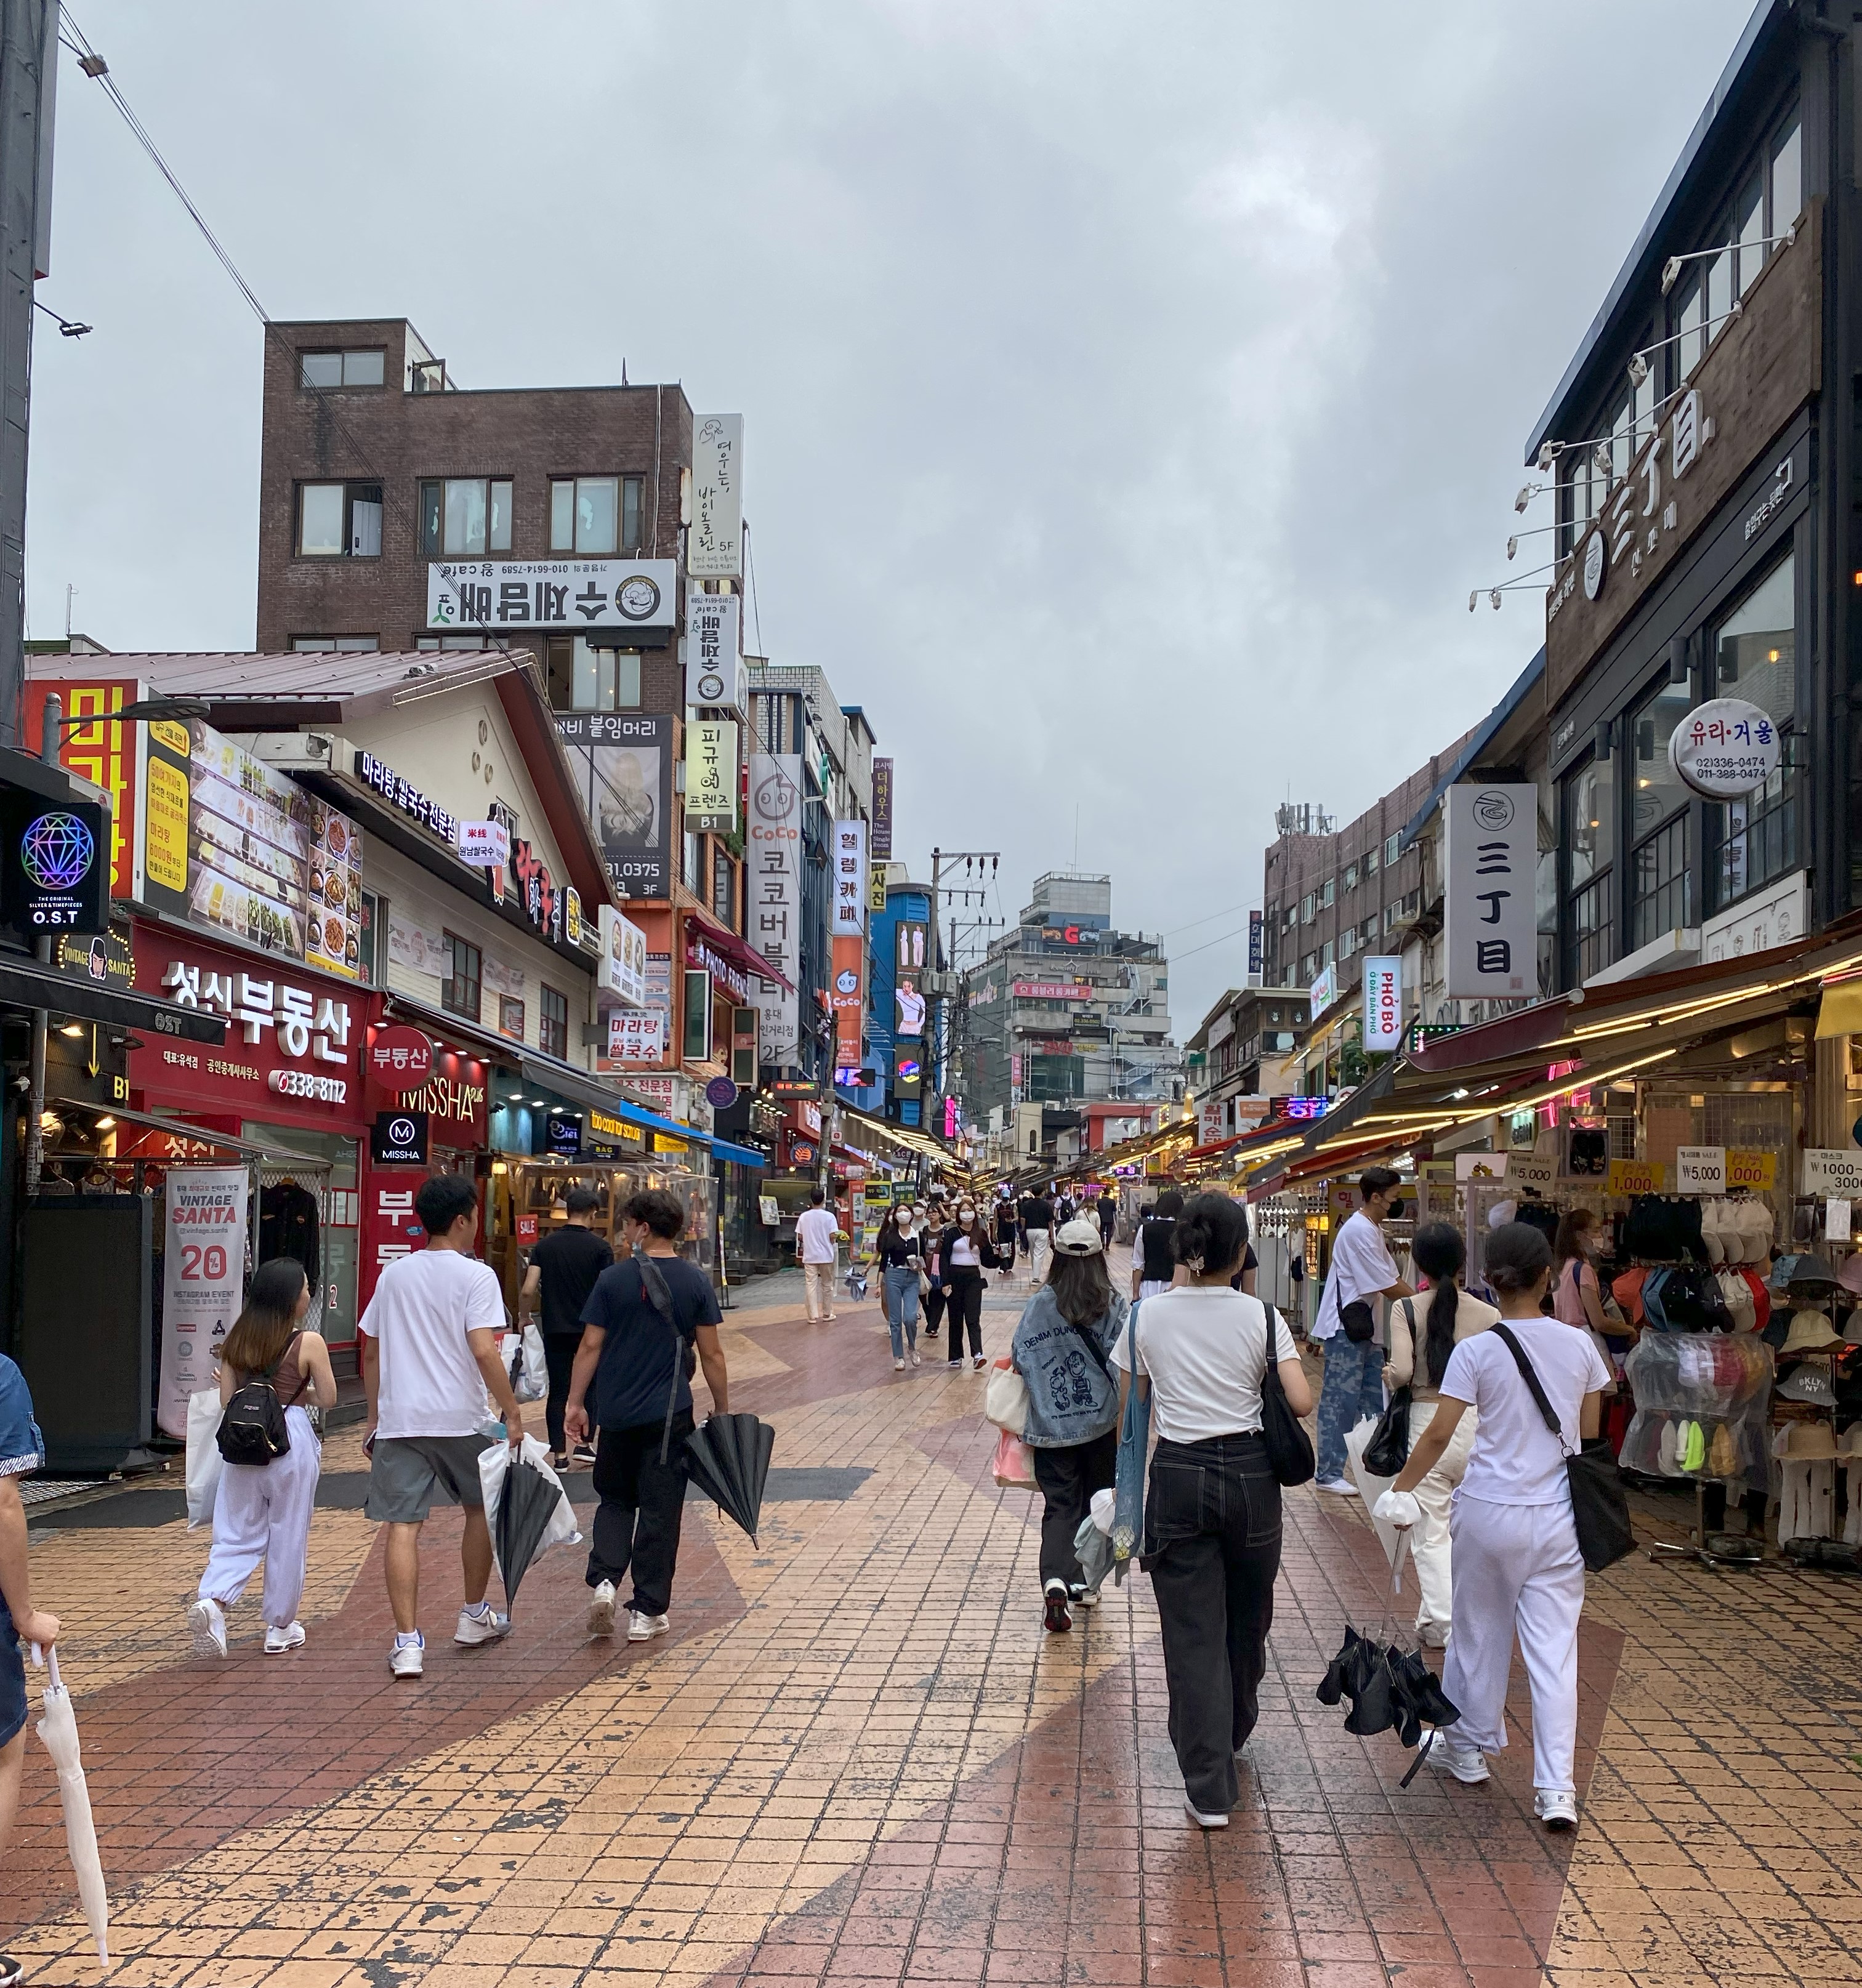
The "Street" a style-classification AI should learn isn't a studio white wall. It lives in urban spaces like this. Hongdae, Seoul's most fashion-forward neighbourhood, gives the real context.
L1 — Hygiene Passes, Diversity Raises a Question
Level 1 is a pixel-level fitness check. The short version: the hygiene items are fine. Every image is uniformly RGB, no missing values turn up, and label integrity shows nothing unusual. One thing does stand out: the spread in resolution. The smallest image is 280×385px and the largest is 4160×3872px, a wide size gap within a single dataset. That's a point where you'll want a clear resize policy before training.
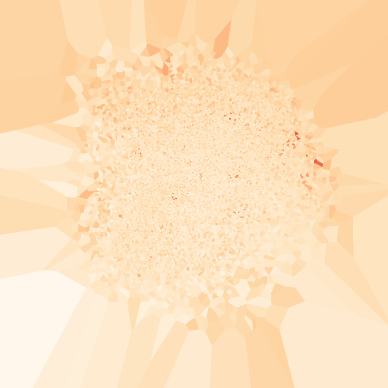
The interesting part is the "mean image." Below is the pixel-wise average of all 967,806 photos. What survives is a hazy human silhouette with almost no defined shape. The blurrier the mean, the more the underlying photos differ from one another — so we can read it as a signal of high visual diversity across the dataset.
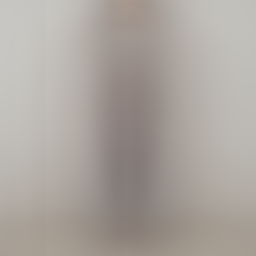
▲ The overall mean image. A blurry full-body silhouette means the photos vary a lot. One thing they do share, though, is the "full standing body" framing.
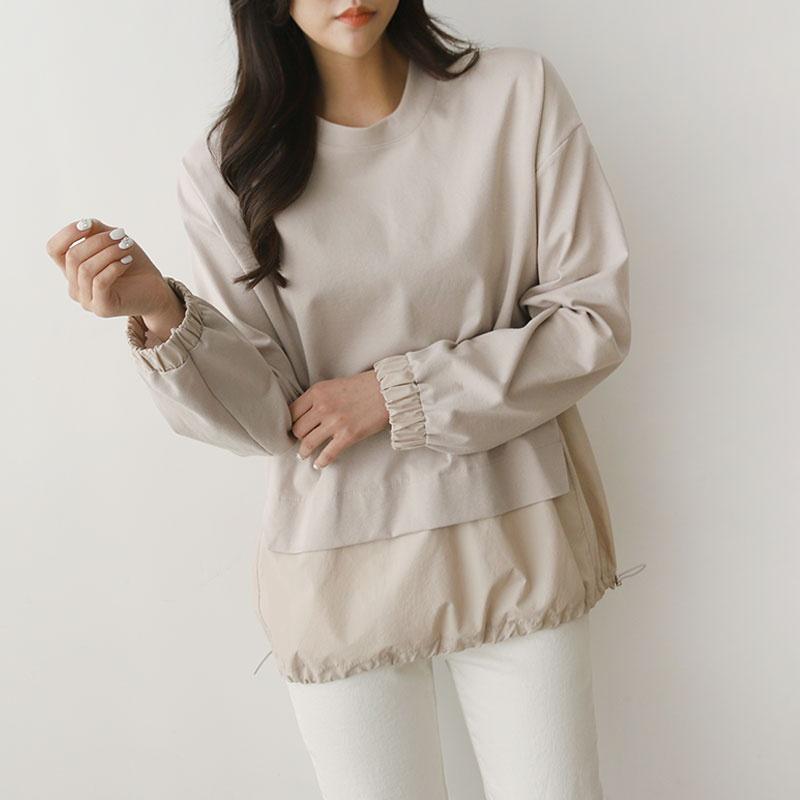
We can build a mean image per class, too. For the six classes DataClinic provides (Other, Modern, Sexy, Kitsch, Punk, Hippie), we placed each class's actual representative sample (left) next to its class mean image (right). The sharper the mean image, the more consistent that class's framing and pose.
 Actual
 Mean
Mean
 Actual
 Mean
Mean
 Actual
 Mean
Mean
 Actual
 Mean
Mean
 Actual
 Mean
Mean
 Actual
 Mean
Mean
▲ Each card's left side is the class's representative sample (Actual); the right is the class mean image. Notice that all six mean images resemble the same "full standing body" silhouette. The styles differ, but the shooting format is the same.
L2 — 24 Styles Seen Through a General-Purpose Lens
Level 2 looks at every image once through a general-purpose neural network called Wolfram ImageIdentify Net V2 (observation dimension 1,280). Because it's a general recognition model, not one specialized for fashion, it shows "how this dataset scatters when viewed through generic visual features." The key metric here is density. A high-density image is a "typical" one, surrounded by many similar images; a low-density image is an "outlier," with few look-alikes nearby.
First, the overall density distribution. Most images cluster tightly around 0.1, with a thin tail trailing right toward 0.3. It's a single mass, with a small set of typical images claiming the higher densities.
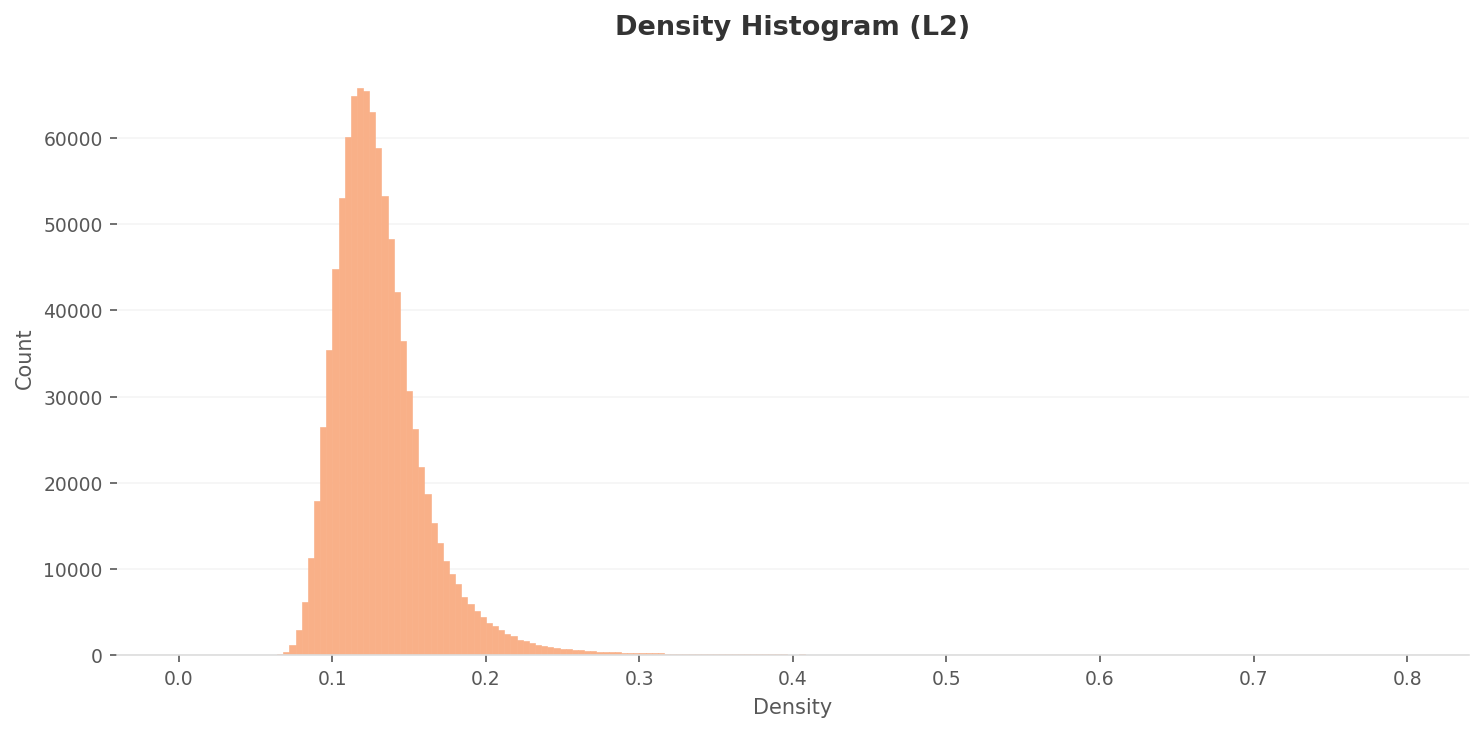
▲ L2 density histogram. It peaks around 0.12 and tapers gently toward 0.3. The vast majority sit in a narrow band.
Split by class, differences appear. In the box chart below, the leftmost class's box is lower and shorter than the others. That class is "Other," a catch-all for photos that don't fit a defined style. With few look-alikes among them, its density comes out lowest. The remaining classes have similar medians of 0.12–0.13, but their upper whiskers stretch all the way to 0.6–0.7, meaning each class contains a separate cluster of very typical photos.
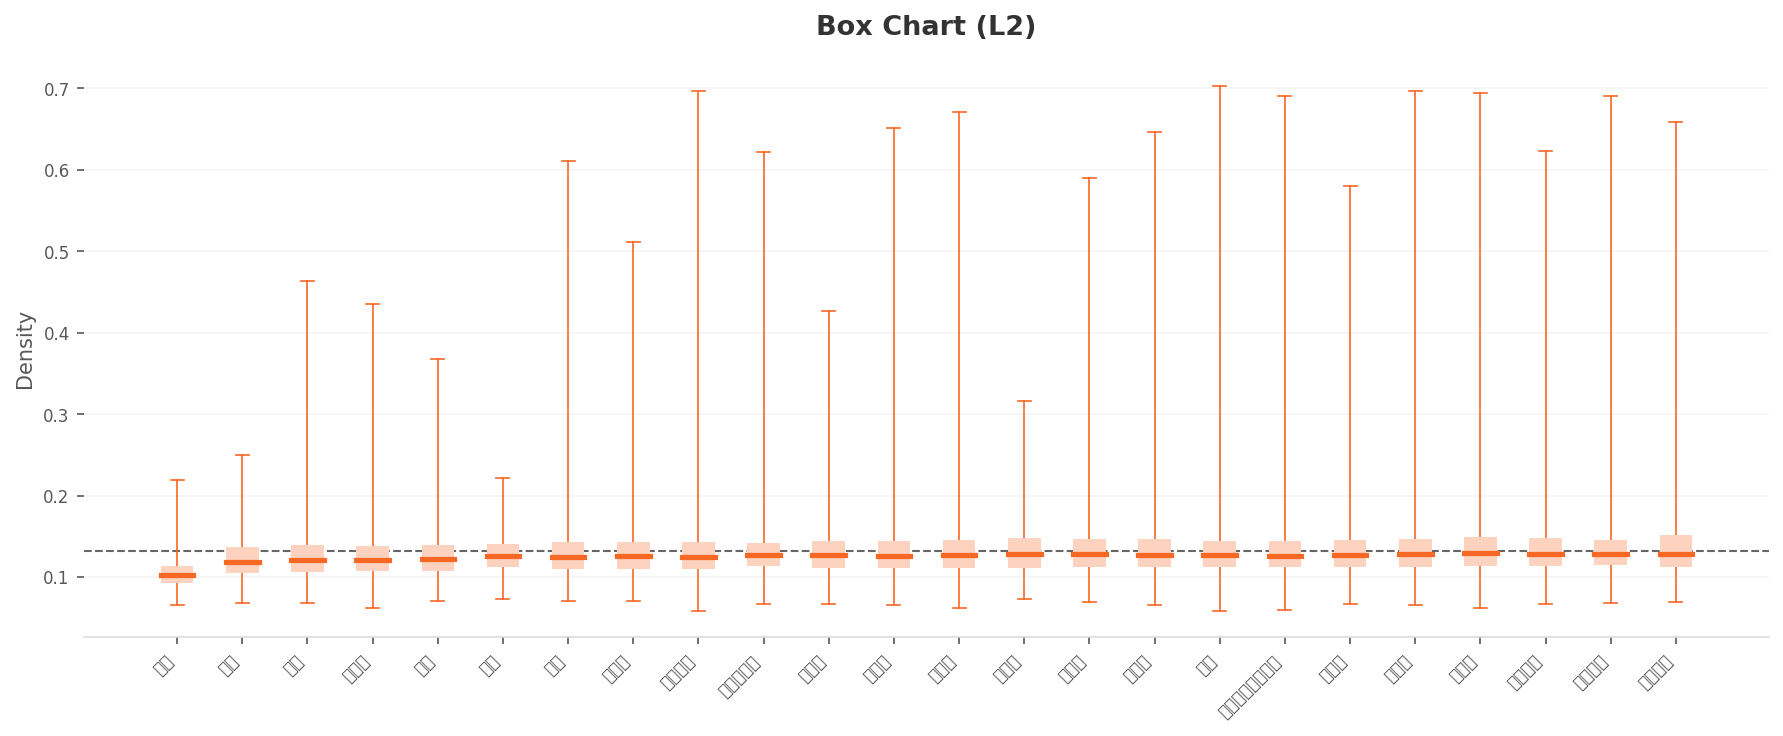
▲ L2 per-class density box chart. The leftmost "Other" shows the weakest cohesion, while the other classes have upper whiskers reaching 0.7 — revealing pockets of highly typical photos.
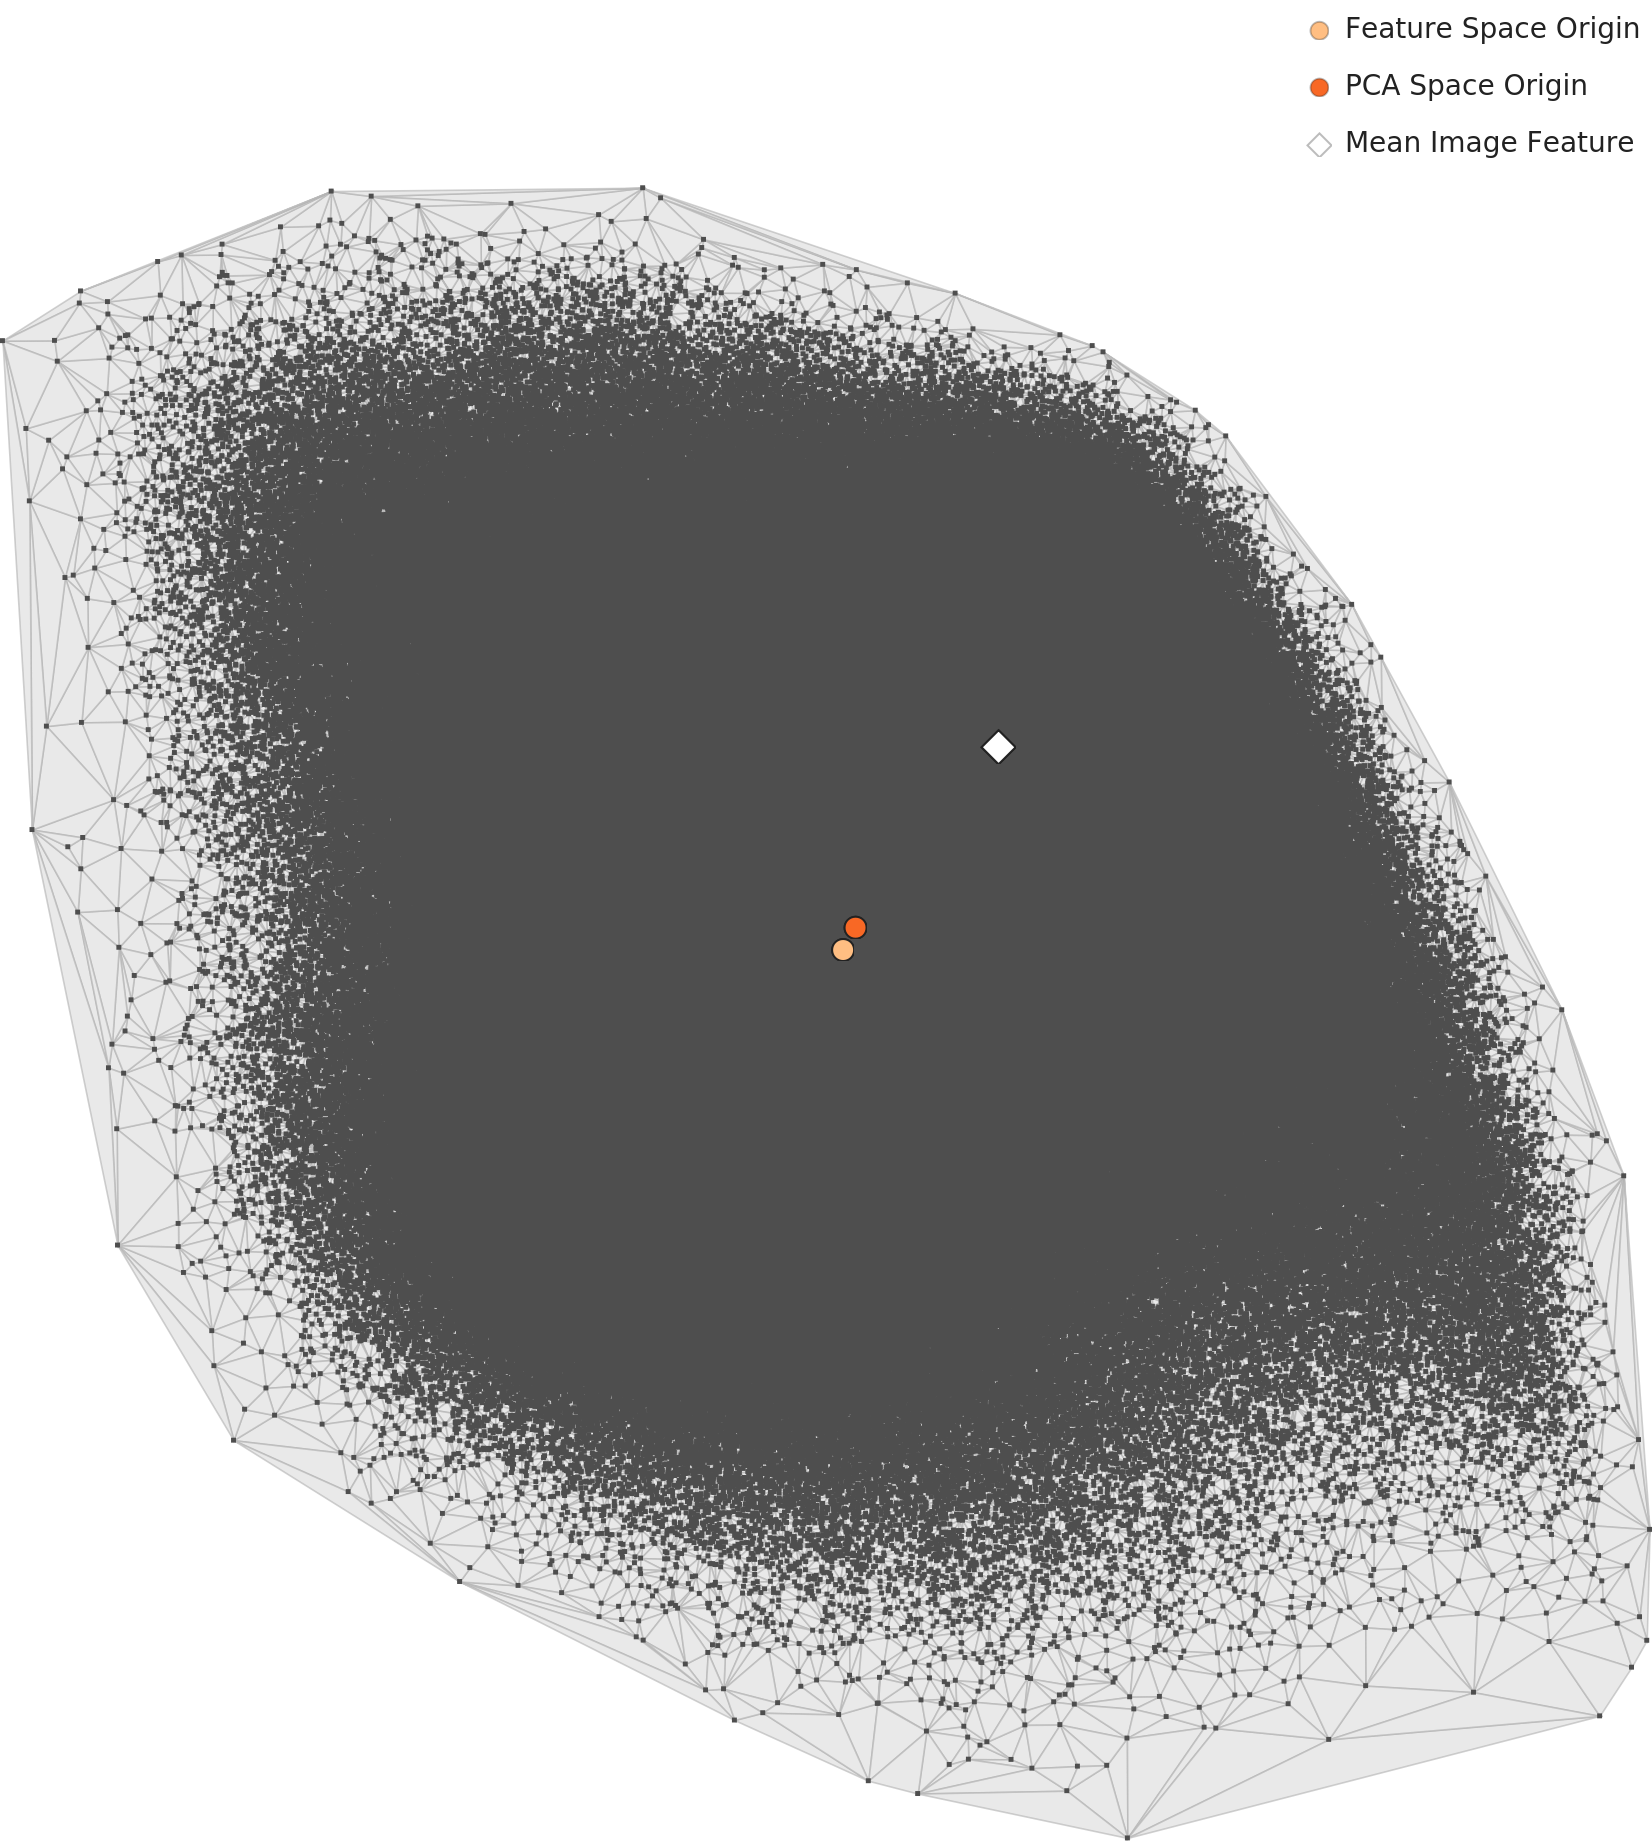
The PCA map below lays that distribution flat. The 960,000 points spread out into something close to an asymmetric triangle. The gray diamond (the overall mean feature) sits off to one side rather than in the center, which we can read as the result of Street's overwhelming volume pulling the distribution's center of mass toward itself.
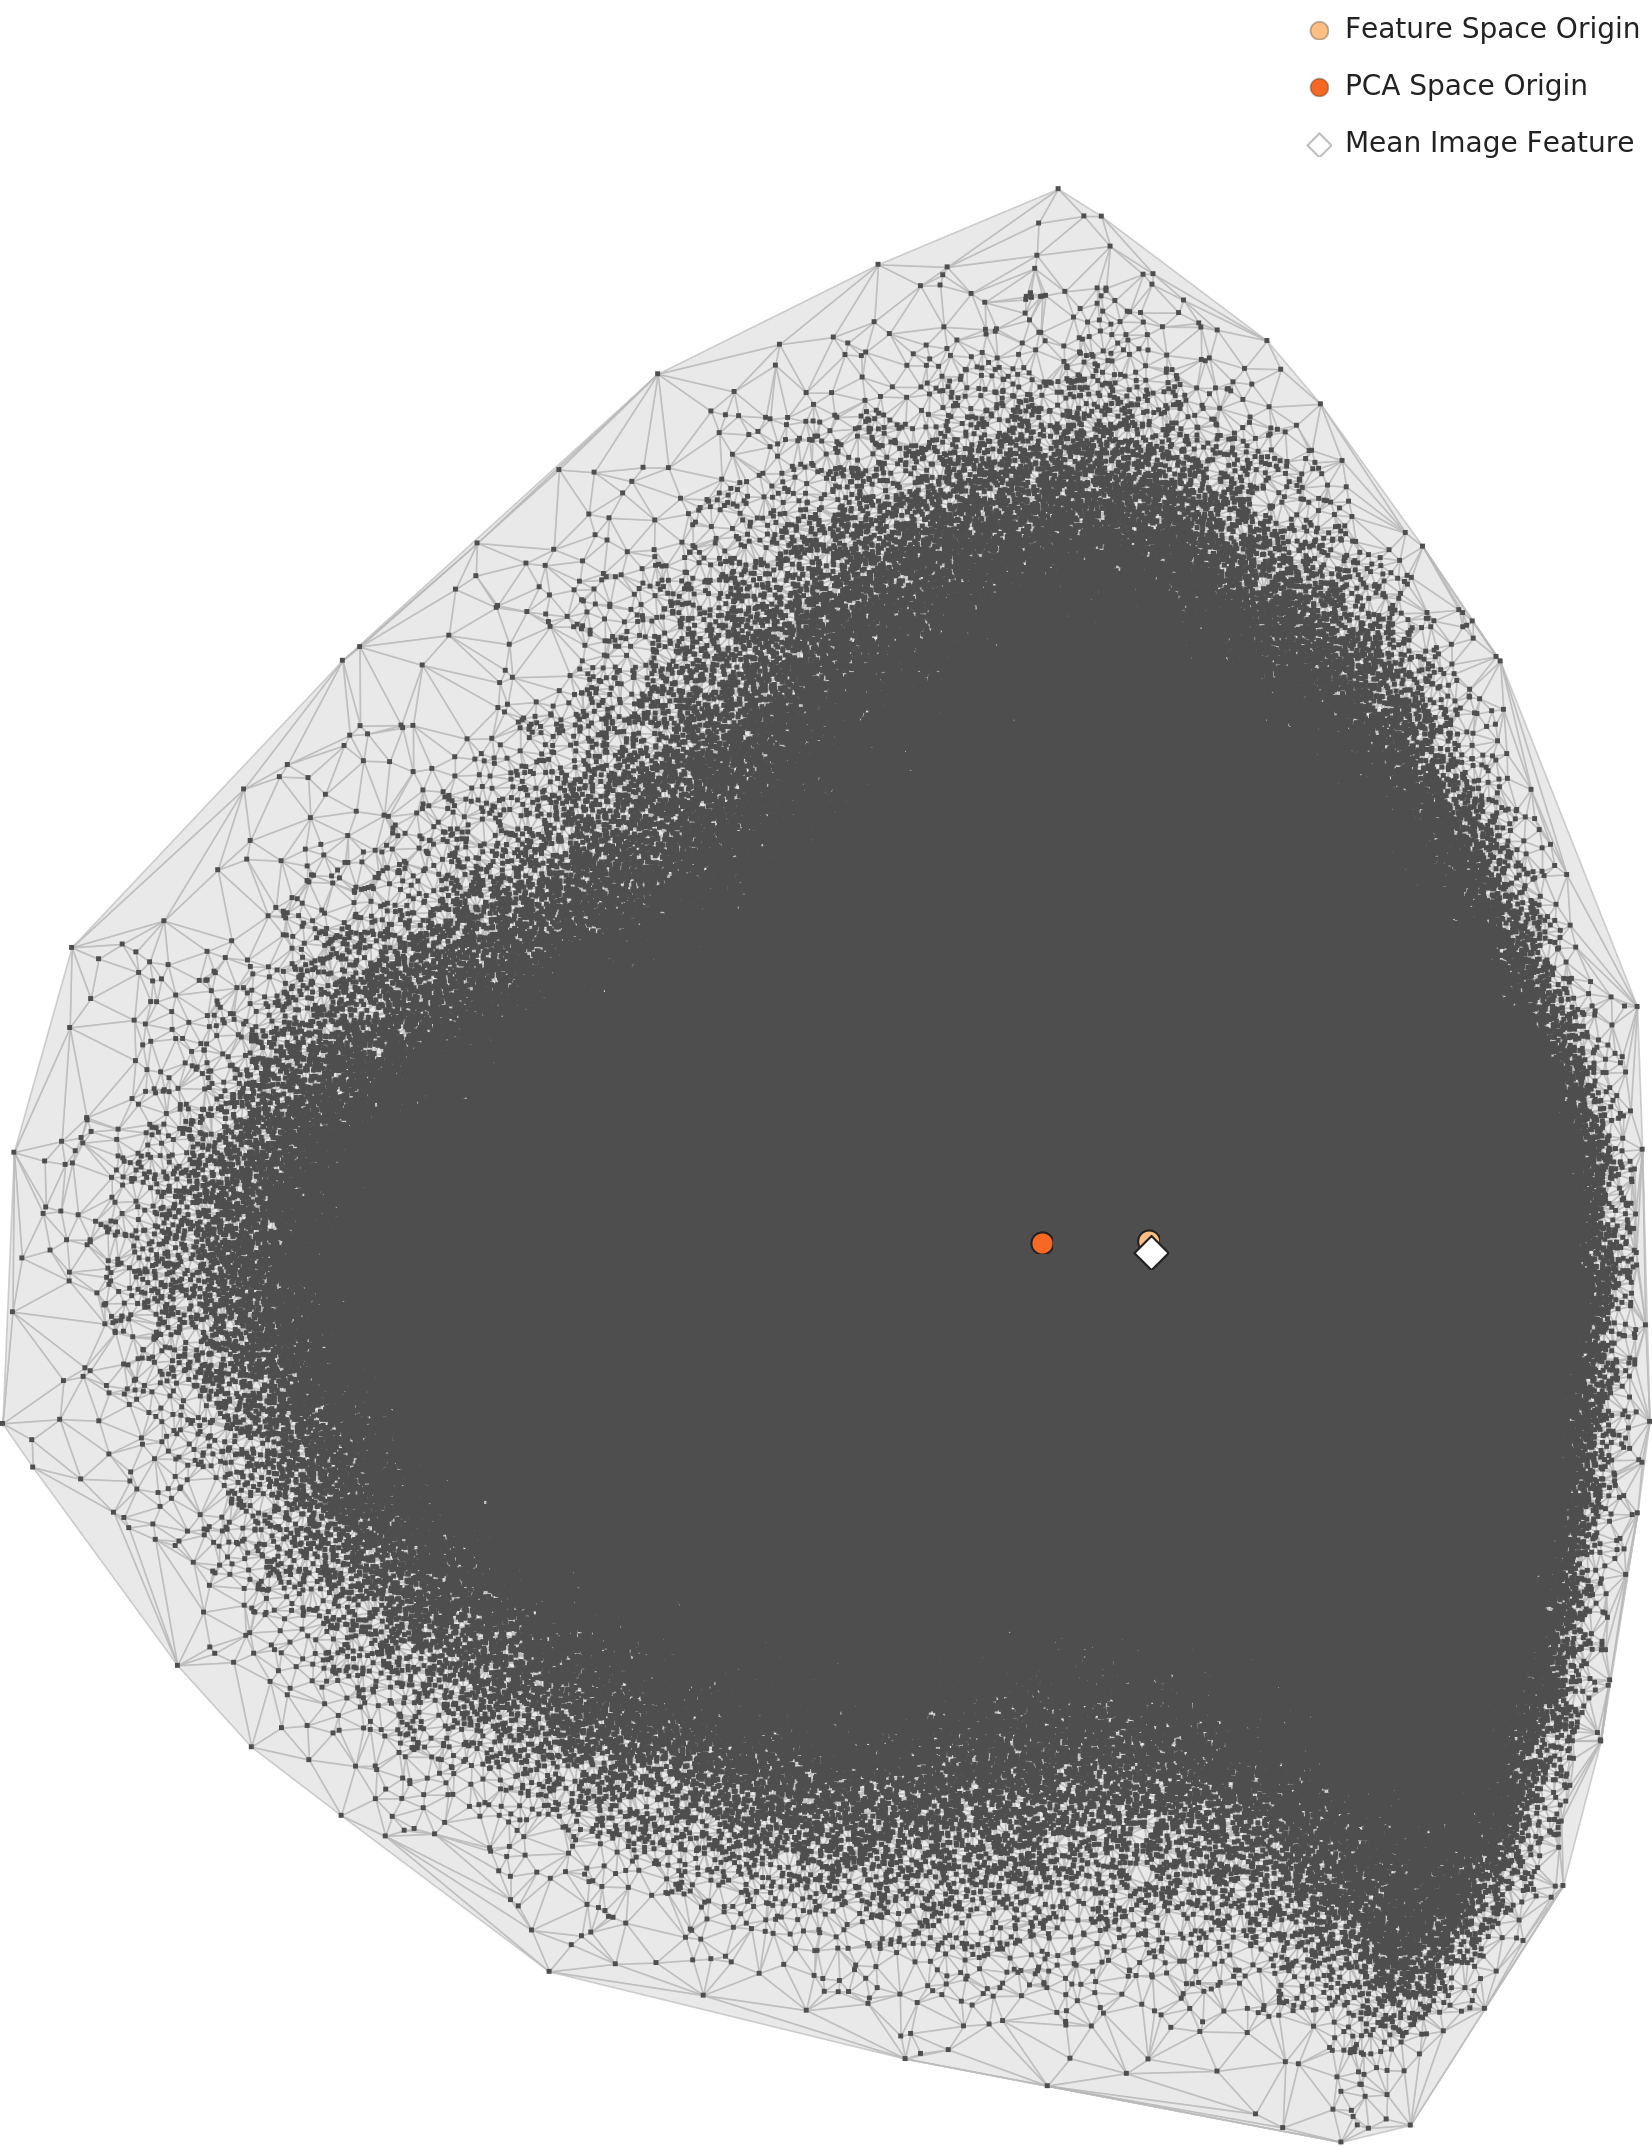
▲ L2 PCA scatter. An asymmetric triangular outline. The mean feature (diamond) sits off to one side of the origin (orange dot), suggesting the distribution leans toward the majority class.
The same data as a density heatmap is relatively pale inside, with one dark hotspot rising at the top edge. That's a signal that K-Fashion doesn't gather around a single center but forms a separate cluster of typical images out at the edge.
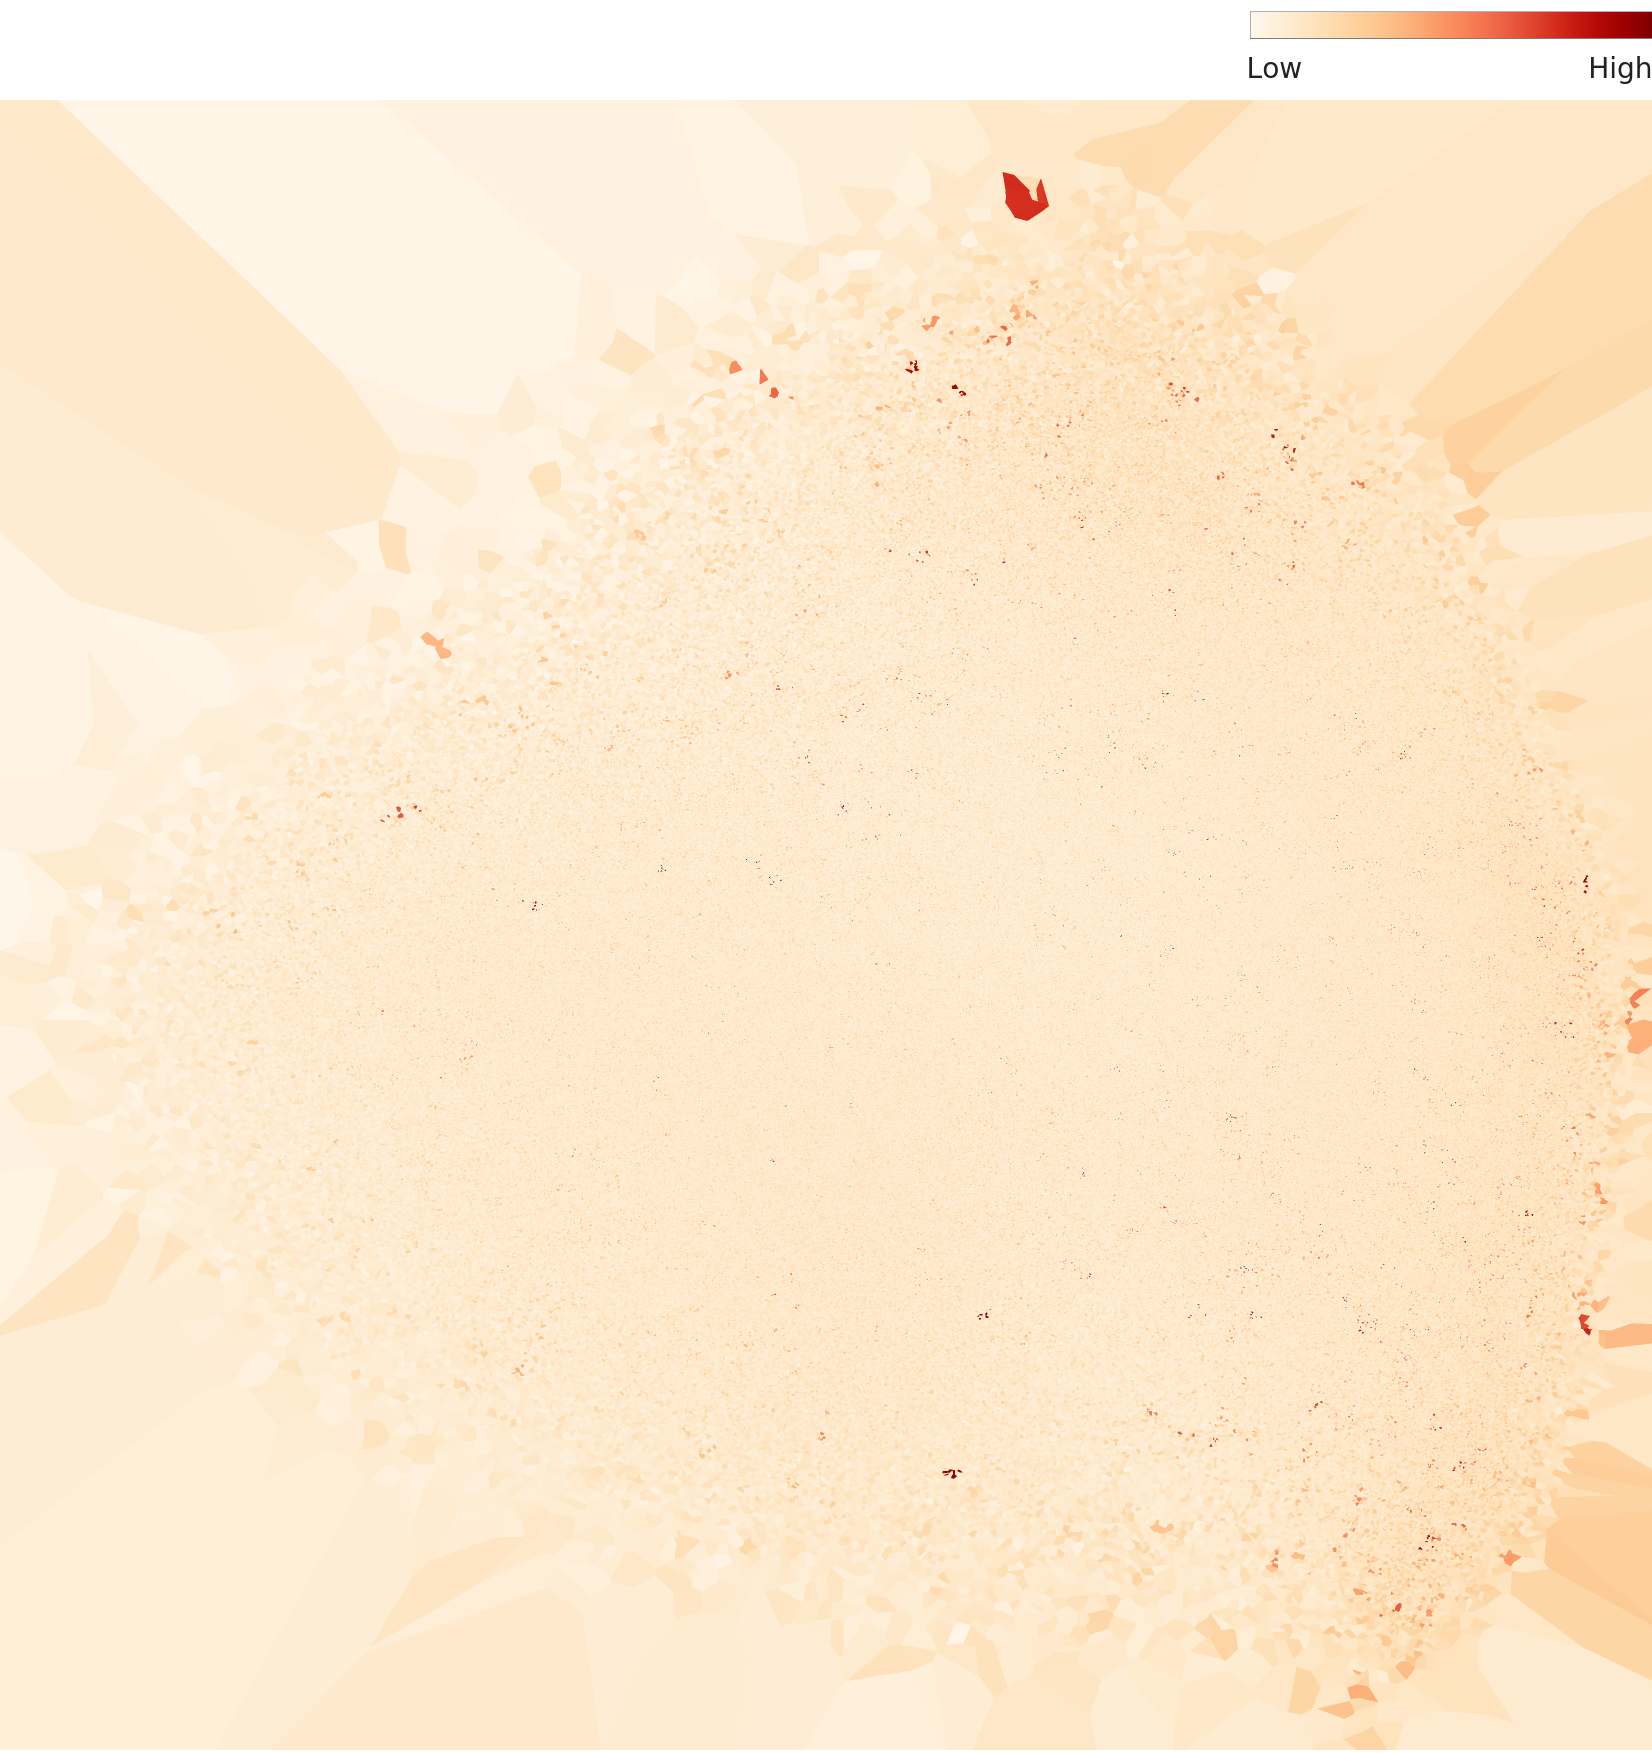
▲ L2 density heatmap. A high-density hotspot rises at the top edge. The typical images concentrate on one side of the distribution.
Per-class density curves with representative images make it more concrete. Modern records the highest density (top-density sample around 0.70), its lookbook-style photos packed tightly together; Hippie and Kitsch also form fairly distinct peaks. Other, by contrast, has a low, wide peak and weak cohesion.
 Density
Actual
Density
Actual
 Density
Actual
Density
Actual
 Density
Actual
Density
Actual
 Density
Actual
Density
Actual
▲ L2 per-class density curves (left) and representative images (right). Modern is the most cohesive, Other the most scattered. The density figures are each class's top-density sample.
L3 — Looking Again Through the Class-Discriminative Lens
Level 3 keeps the same ImageIdentify Net V2 as its base but applies a lens optimized down to 150 dimensions to preserve class-discriminative power. It's the stage that sharpens the between-class differences the general lens missed. One caution, though: L3's density values are computed in a different dimensional space than L2's, so you can't compare the two stages' numbers directly. The only thing you can compare is the "shape" of the distribution.
The L3 density histogram peaks around 0.55, and its right tail reaches far further than L2's (beyond 1.5). That means a wider dynamic range — a handful of hyper-typical images claim extremely high densities.
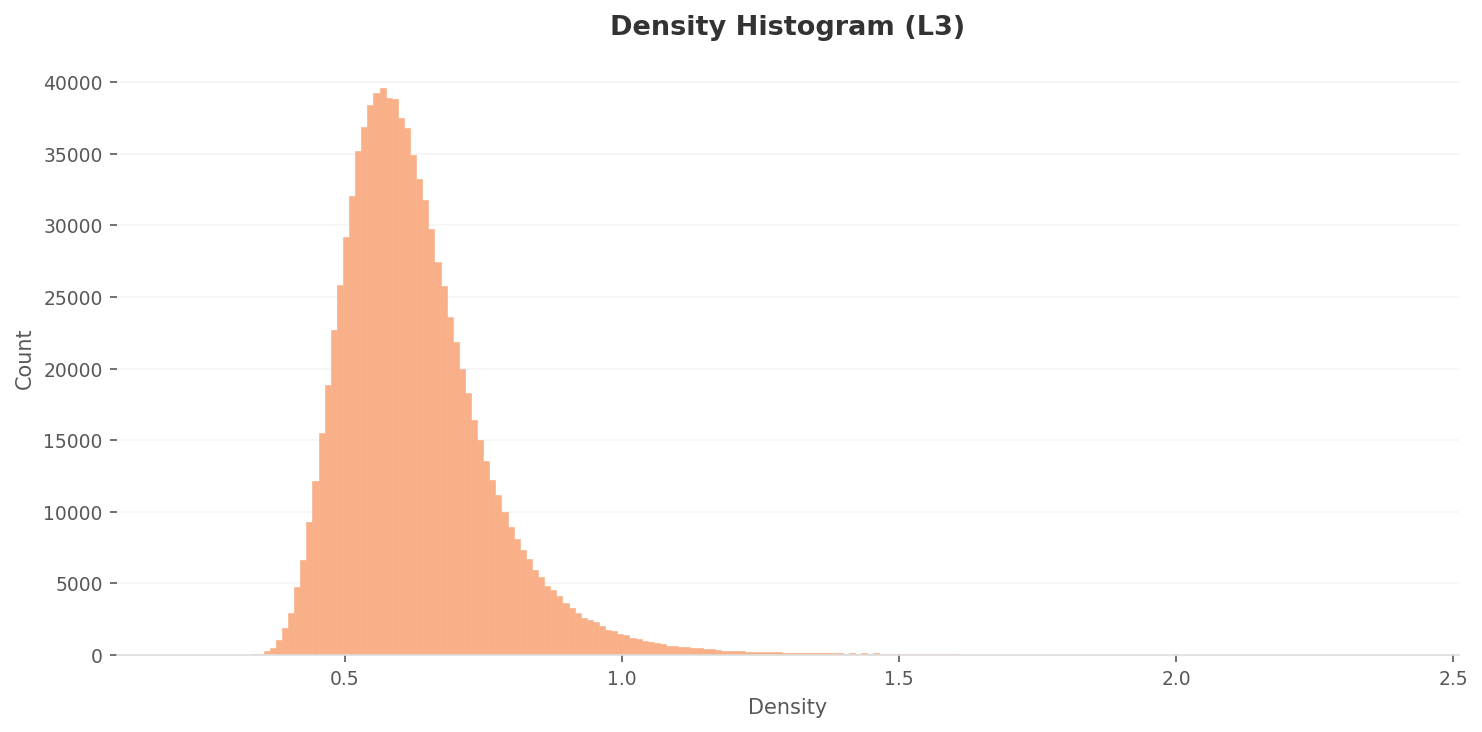
▲ L3 density histogram. Peak around 0.55, with a right tail longer than L2's (a few hyper-typical images reach very high density). Absolute values can't be compared with L2.
In the box chart too, class medians become more uniform than L2's, at 0.50–0.65. Here again the leftmost Other is the lowest. Several classes' upper whiskers cross 2.0, showing that each class holds extremely typical photos of its own.
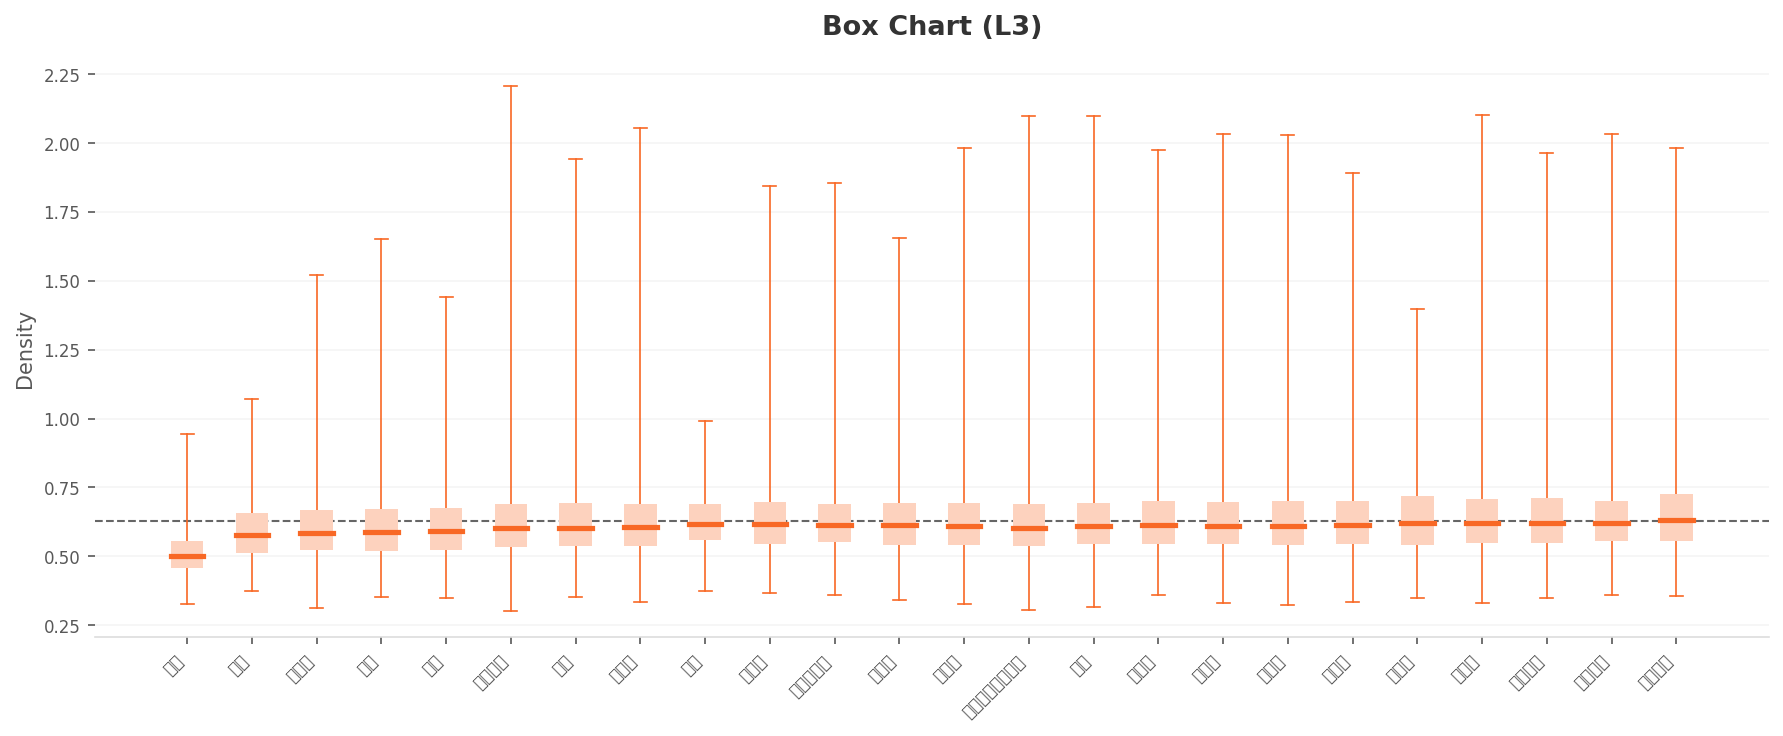
▲ L3 per-class density box chart. Medians are fairly even at 0.5–0.65, and Other remains the lowest. Many classes have upper whiskers above 2.0.
The most striking change is the shape of the PCA map. L2's asymmetric triangle tidies into a near-symmetric ellipse in L3. We can read this as the 150-dimensional optimization correcting, to some degree, the directional skew that Street's volume had created. Place the two maps side by side and the difference is clear.
L2 — Asymmetric triangle
Mean feature skewed to one side. Pulled toward the majority class.
L3 — Symmetric ellipse
Directional skew eased into a more balanced outline.
▲ L2 (left) vs L3 (right) PCA comparison. The class-discriminative lens partly corrects the distribution's directional bias.
The L3 density heatmap differs again from L2's. It's a donut shape — empty in the middle, with two dark hotspots rising at the edges (especially left and right). That's visual evidence that K-Fashion exists not as one center but as several archetypal clusters.
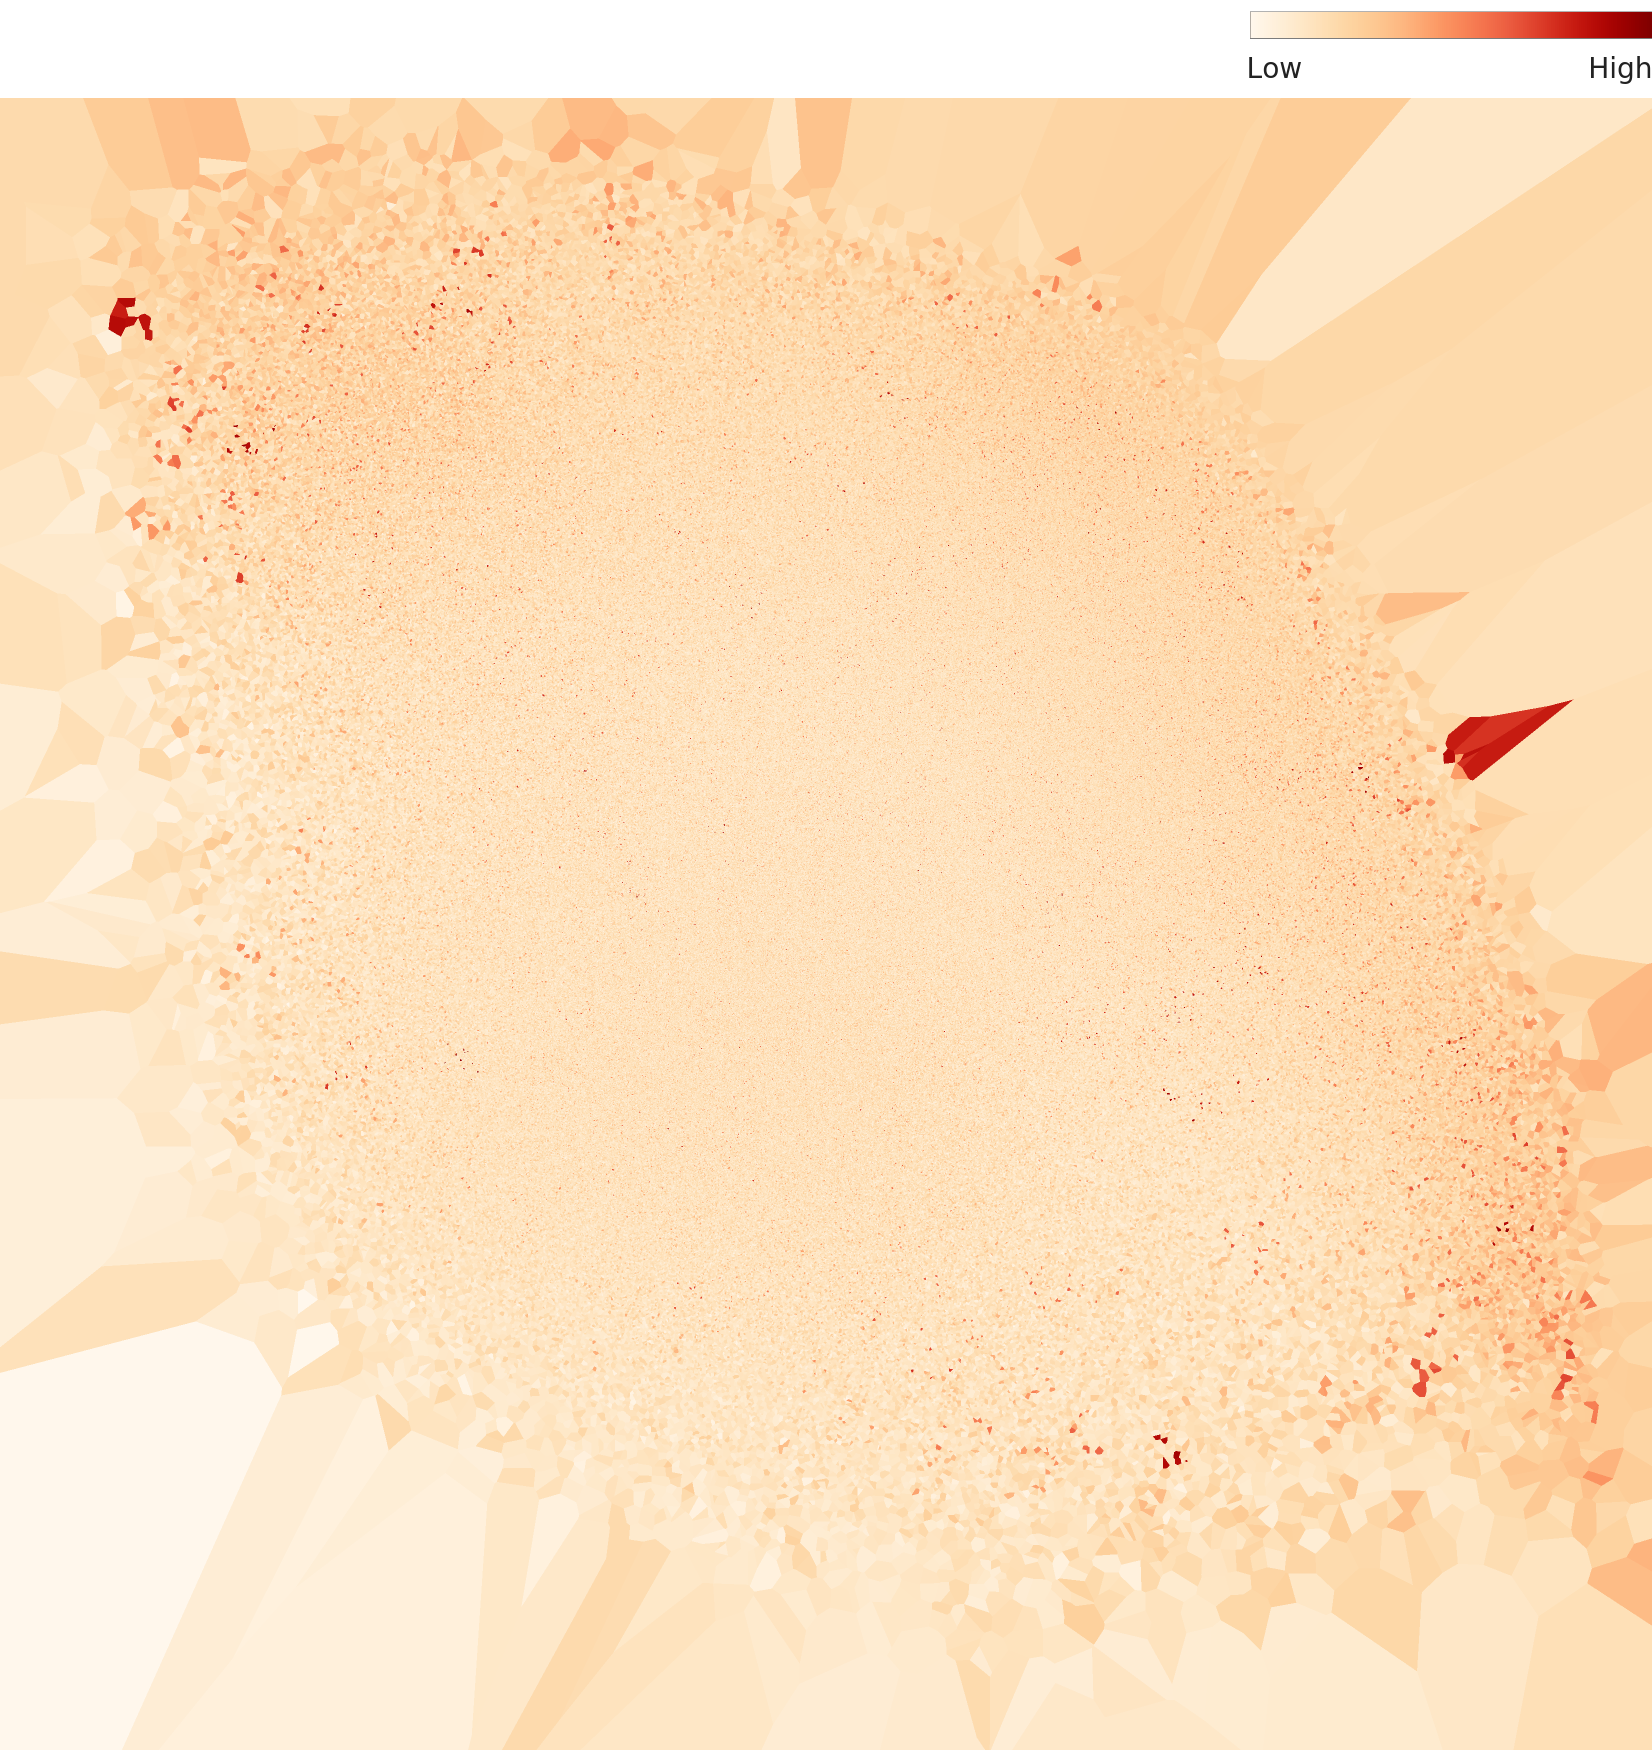
▲ L3 density heatmap. A donut structure with two hotspots at the left and right edges. A signal that the data splits into multiple clusters rather than a single center.
L3 brings into focus minority classes that weren't prominent in L2. Sporty (14,701 images) forms the hottest distribution, and Hip-hop (1,240) starts to separate into its own cluster. Sexy's top-density sample climbs to about 1.44, showing strong typicality. The point: even a class with few images can form a clear peak under the class-discriminative lens, as long as its visual consistency is high.
 Density
 Actual
 Density
 Actual
 Density
Actual
Density
Actual
 Density
Actual
Density
Actual
▲ L3 per-class density curves (left) and representative images (right). Even with few images, high visual consistency (Sporty, Sexy) yields a clear peak.
What "the Most Street" Really Is
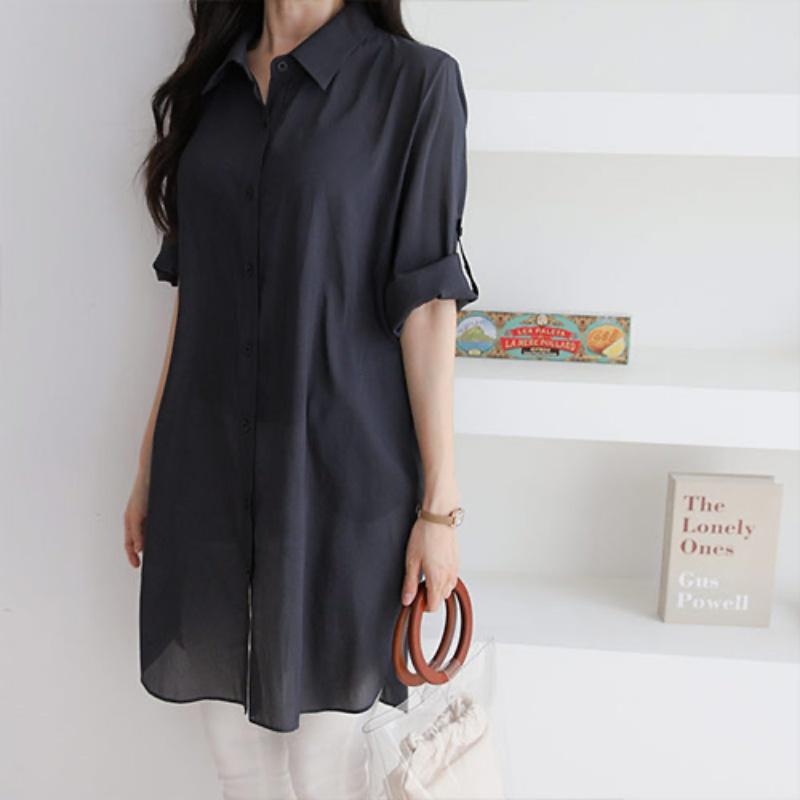
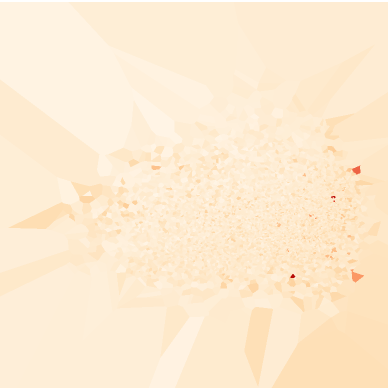
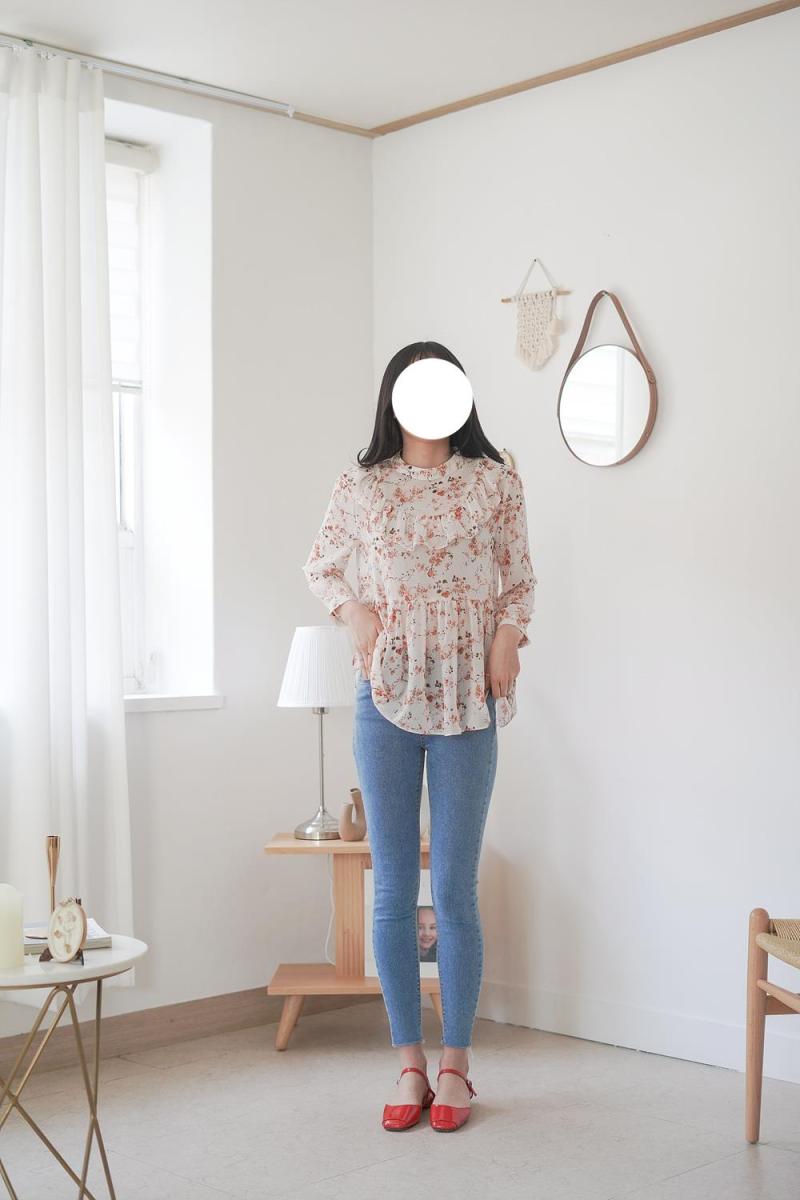
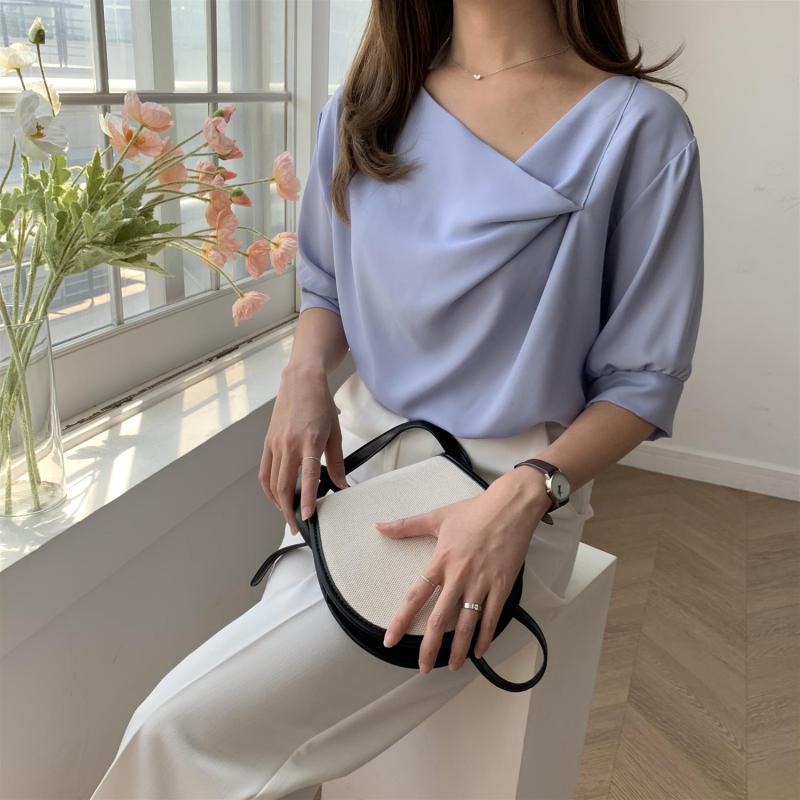
This is the heart of the diagnosis. In the L3 class-discriminative space, the #1 and #2 "most typical" (highest-density) images out of all 960,000 both belong to the Street class, at densities 2.21 and 2.15. And it isn't only the top two: 9 of the top 10 highest-density images are Street, their densities packed into a narrow band from 2.09 to 2.21. It seems natural for a class with overwhelming volume to occupy the most-typical slots. But open those top images and the story changes.
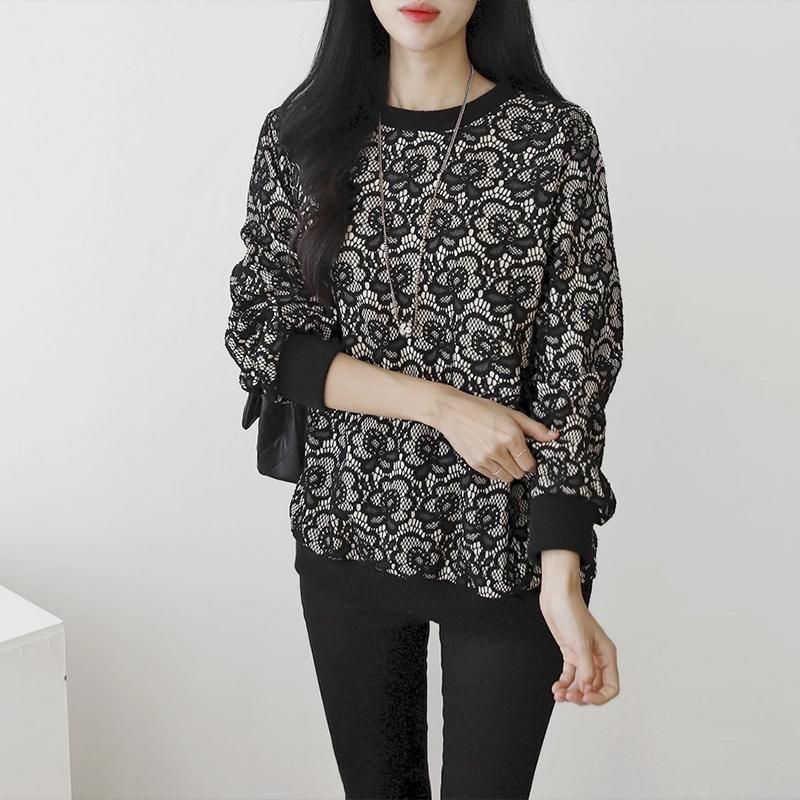
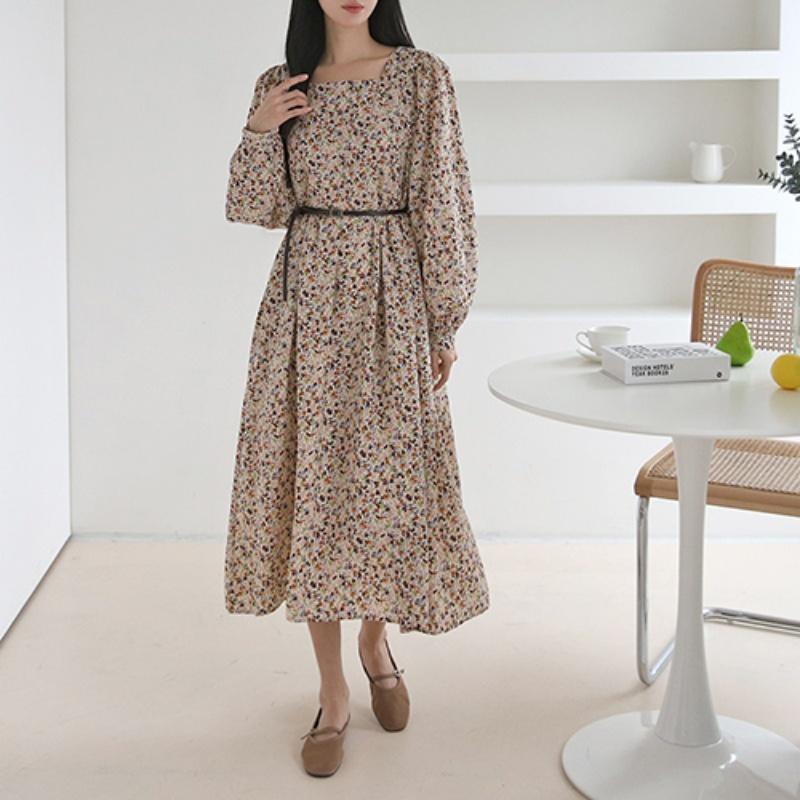
The #1 image is a full-body shot against a white studio backdrop: a floral chiffon blouse, blue skinny jeans, red flats. Visually, anyone would call it Romantic or Feminine. And #1 and #2 are consecutive frames from the same shoot, with only a slight change in composition. Two nearly identical photos split first and second place for "most typical Street."

Top density #1 (density 2.21)
Label: Street. White studio, floral blouse + skinny jeans + red flats.
Top density #2 (density 2.15)
Label: Street. A consecutive frame from the same session as #1 (only a slight change in composition).
▲ The #1 and #2 "most typical Street" picked by L3. Two near-duplicates from the same shoot took the top spots.
This happens because of batch shooting. A lookbook shoot has one model wear one outfit and fire off dozens of frames on the same set. The result is a pile of nearly identical photos (near-duplicates) within a single class. The more similar photos there are, the higher the density around them, and the higher the density, the more the model learns that pattern as "typical." When 490,000 images meet batch shooting, what the model learns isn't a style. It's a shooting format: "studio + full standing body + bright top + denim."
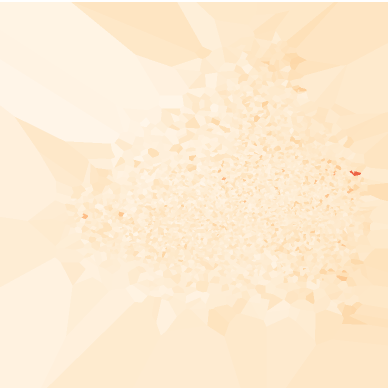
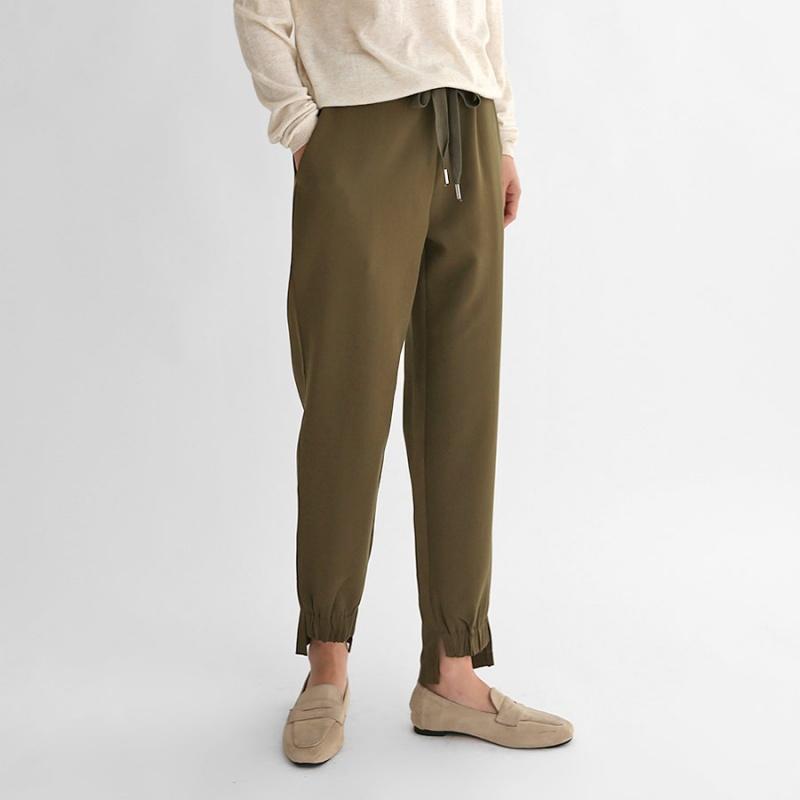
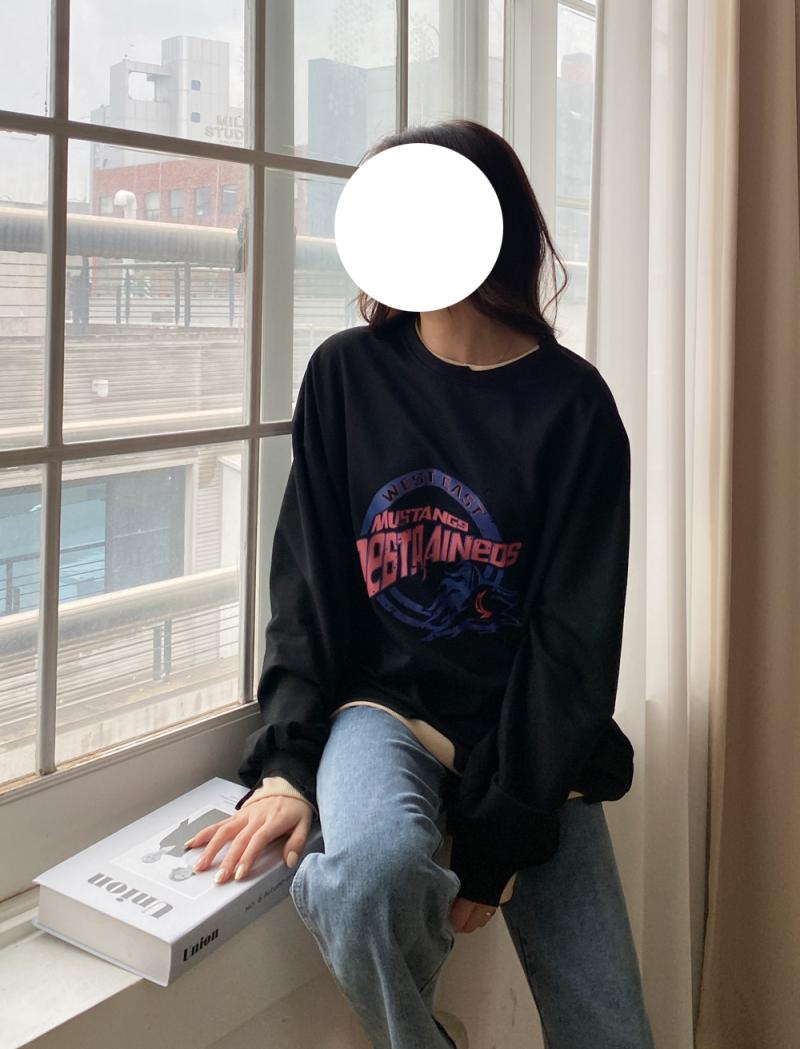
Look at the opposite end and the message sharpens. The lowest-density image in the same Street class (density 0.30) is a shot of a black oversized graphic sweatshirt, perched on a city windowsill. Real buildings and a factory complex are visible through the window. Anyone would call it genuine street feeling. Yet this photo is classified as "atypical" and pushed to the margins of the distribution.
To put it plainly: the "typical Street" the AI learned was not a clothing style but a shooting format. The street feeling we usually picture, with its graphics, oversized fits and urban backdrops, was treated as atypical instead. Even when the label reads "Street" exactly, the typicality that density points to is aimed somewhere else entirely.
Real-World Impact — If You Train Fashion AI on This Data
A data-quality diagnosis doesn't end with numbers. The real question is what an AI trained on this data would do in an actual service. Below is a scenario for how two images sharing the same "Street" label might diverge in a search-or-recommendation AI.
⚠️ Scenario: When you search for "street look"
A fashion search/recommendation model trained on this data could, when a user searches "street look," surface the floral-blouse studio frame, its high-density training anchor, near the top. Conversely, the genuinely street-mood graphic sweatshirt may be pushed down the recommendations or classified as a different style because its confidence is low. (Actual service behavior depends on model and search design, so we describe this as a possibility.)
The causal chain is simple. Batch shooting mass-produces near-duplicates; those photos dominate the cluster, so the studio format overpowers the style. As a result, the "typical Street" is distorted and genuine street feeling is undervalued. One more thing to add: when near-duplicates from the same session land in both the training and evaluation sets, you get the risk of train–test leakage — performance measured higher than it really is. There may be a structural reason like this hiding behind that high official accuracy.
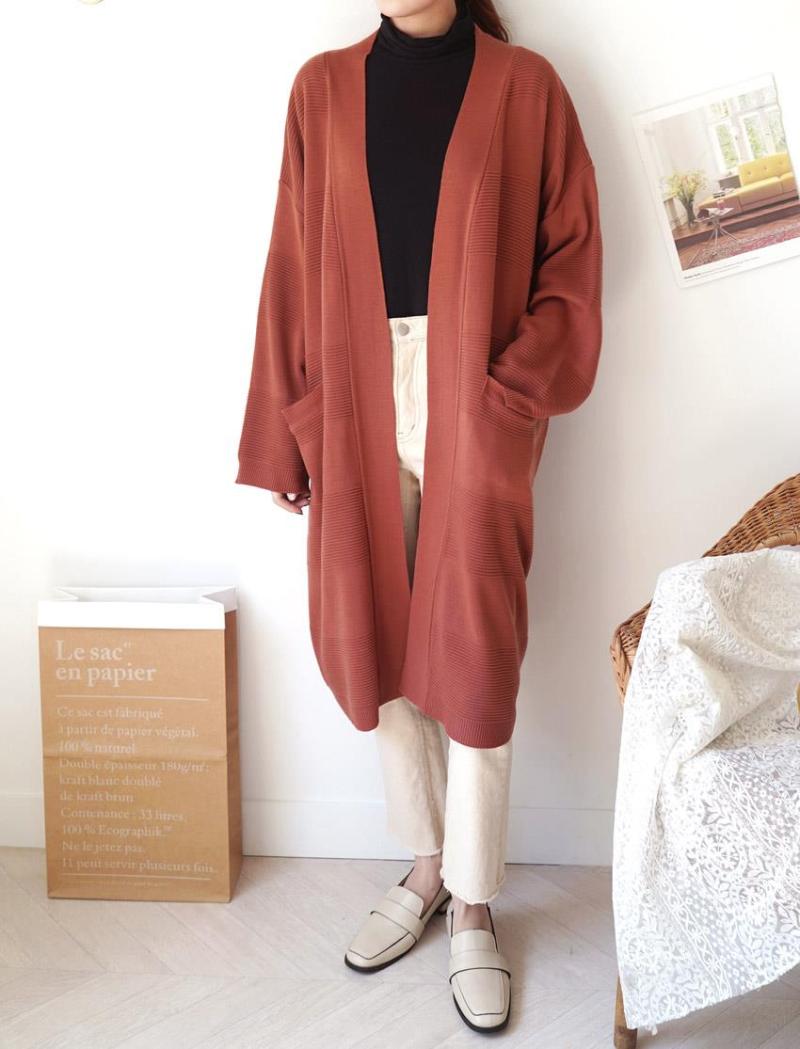
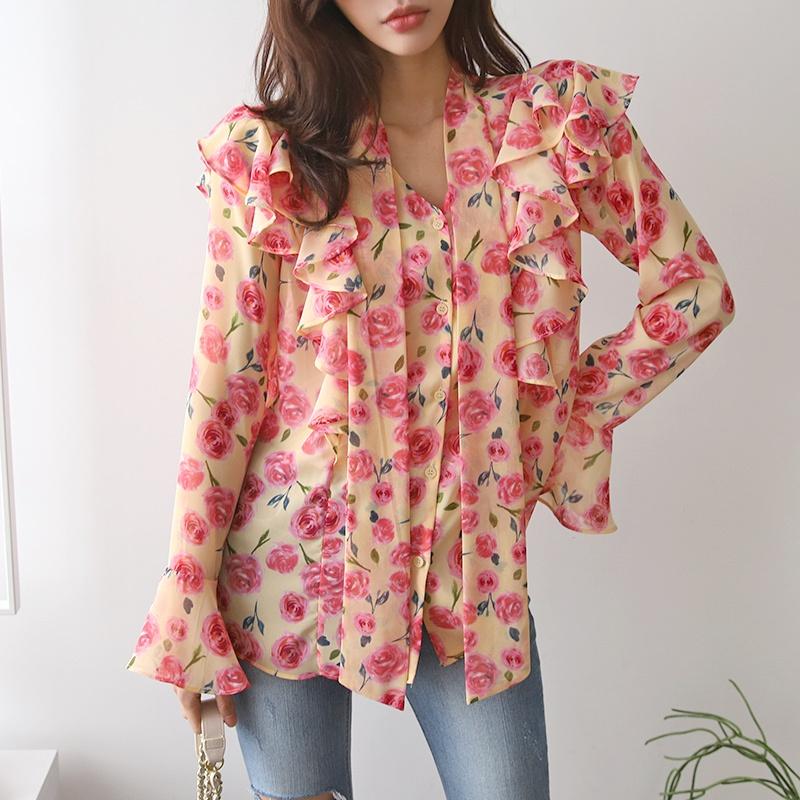
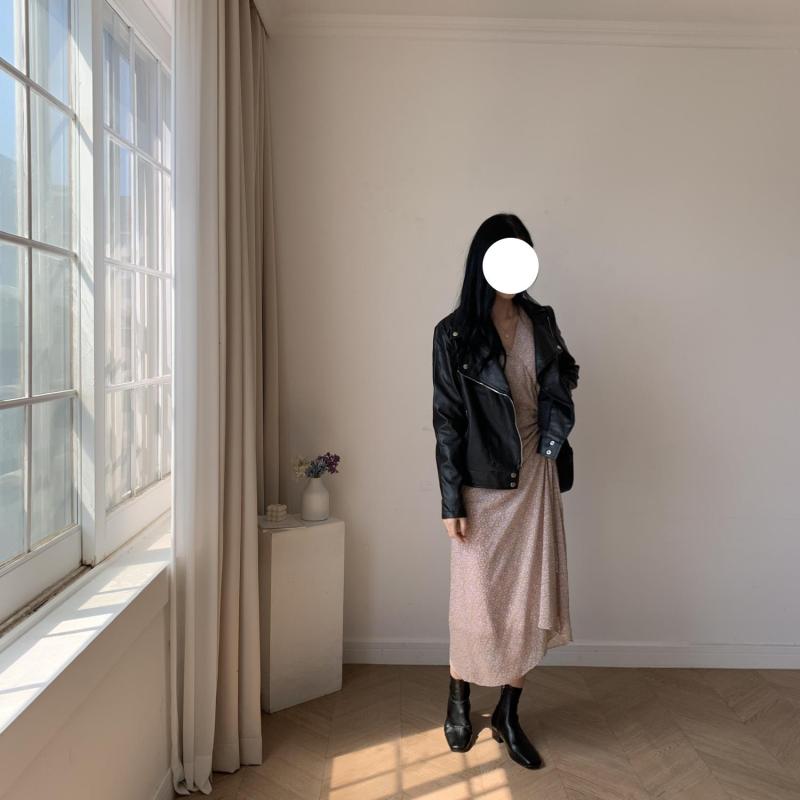
There's one more piece of evidence that the label boundaries are wobbling. The Sophisticated image below was flagged as a low-density outlier in both L2 and L3. Look at it and you see a lavender draped V-neck blouse, visually closer to Feminine or Romantic. When an image clashes with its "Sophisticated" label no matter which lens you use, it's a signal that the boundaries between these styles are ambiguous even to people.
Sophisticated — cross-lens outlier
Low density in both L2 and L3. A lavender draped blouse, visually closer to Feminine/Romantic.
▲ When the same image is flagged as an outlier by both lenses, we read it not as simple noise but as a sign that the label boundary itself is wobbling.
Conclusion — A Correct Label Doesn't Make the Data Right
K-Fashion is a valuable asset — an overwhelming 970,000 images with detailed annotation. It passes the L1 hygiene check cleanly. But DataClinic's distribution lens reveals three structural traits the accuracy number doesn't show. Set out as three comparison frames, they look like this.
| Frame | What it compares | What it reveals |
|---|---|---|
| ① Official 91% ↔ Structure | AI Hub style-classification Recall@3 91.11% vs DataClinic distribution analysis | Accuracy doesn't show the imbalance, batch shooting, or blurred label boundaries. Near-duplicates can even inflate accuracy through leakage. |
| ② Subjective-style domains | Datasets with fuzzy boundaries — WikiArt (art movements), Places365 (places), Korean food, etc. | Labels as subjective as style, genre or taste, the kind people rarely agree on, produce overlapping clusters. K-Fashion falls into the same trap, with imbalance and batch bias added on top. |
| ③ Class imbalance | Street 449,494 images vs Punk 382 images | A gap of about 1,177×. A long tail where the standard deviation (91,811) exceeds the mean (40,325). Minority classes are hard to learn well. |
The message of this diagnosis comes down to one sentence. A correct label doesn't make the data right. Even when every photo is labeled "Street" exactly, if near-duplicates poured out of a single session dominate the cluster, the model learns the photo set, not the clothes. Data quality isn't just about label accuracy. It's about whether the distribution that label points to matches the concept we intended.
Practically, three directions stand out: reducing batch-shoot near-duplicates or weighting by cluster; downsampling bloated classes like Street while reinforcing minority classes like Punk and Hip-hop; and revisiting wobbly label boundaries like Sophisticated ↔ Feminine. Which to do first depends on whether the service you build with this data is search, recommendation, or trend analysis.
You can find the full diagnostic process and figures in DataClinic Report #127, and the original data on the AI Hub K-Fashion page. If you want to explore the data's cluster structure yourself, we recommend unfolding the embedding with Pebbloscope.
Pebblous Data Communication Team
June 20, 2026
References
Diagnostic Report
- 1.DataClinic. (2026). K-Fashion Image DataClinic Diagnostic Report #127. DataClinic (Pebblous Inc.)
Dataset & Technical Documentation
- 2.OpinionLive (with Ewha Womans University, Korea Fashion Industry Research Institute, AI.M, Wearly). (2020). K-Fashion Image Dataset (Dataset No. 51). AI Hub. 66,321 views · 4,059 downloads (as of 2026-06). Style classification Recall@3 91.11%, item detection AP@50 81.48%.
- 3.Wolfram Research. (2023). Wolfram ImageIdentify Net V2. Wolfram Neural Net Repository. Used as the base neural network for DataClinic L2/L3 analysis (observation dimension L2: 1,280, L3: 150).