Executive Summary
This article is based on the analysis from DataClinic Report #124. The Military Border Operations Synthetic Data is a marine border surveillance-specialized synthetic dataset built by Pebblous under a National Information Society Agency (NIA) project. Comprising 149,447 images at 88GB, it includes EO (electro-optical) and IR (infrared thermal) dual-sensor imagery, achieving a DataClinic overall score of 88 (Good). This predates PBLS_Drone (87) and PBLS_Military (68), making it the origin of Pebblous defense synthetic data.
DataClinic Grade Summary
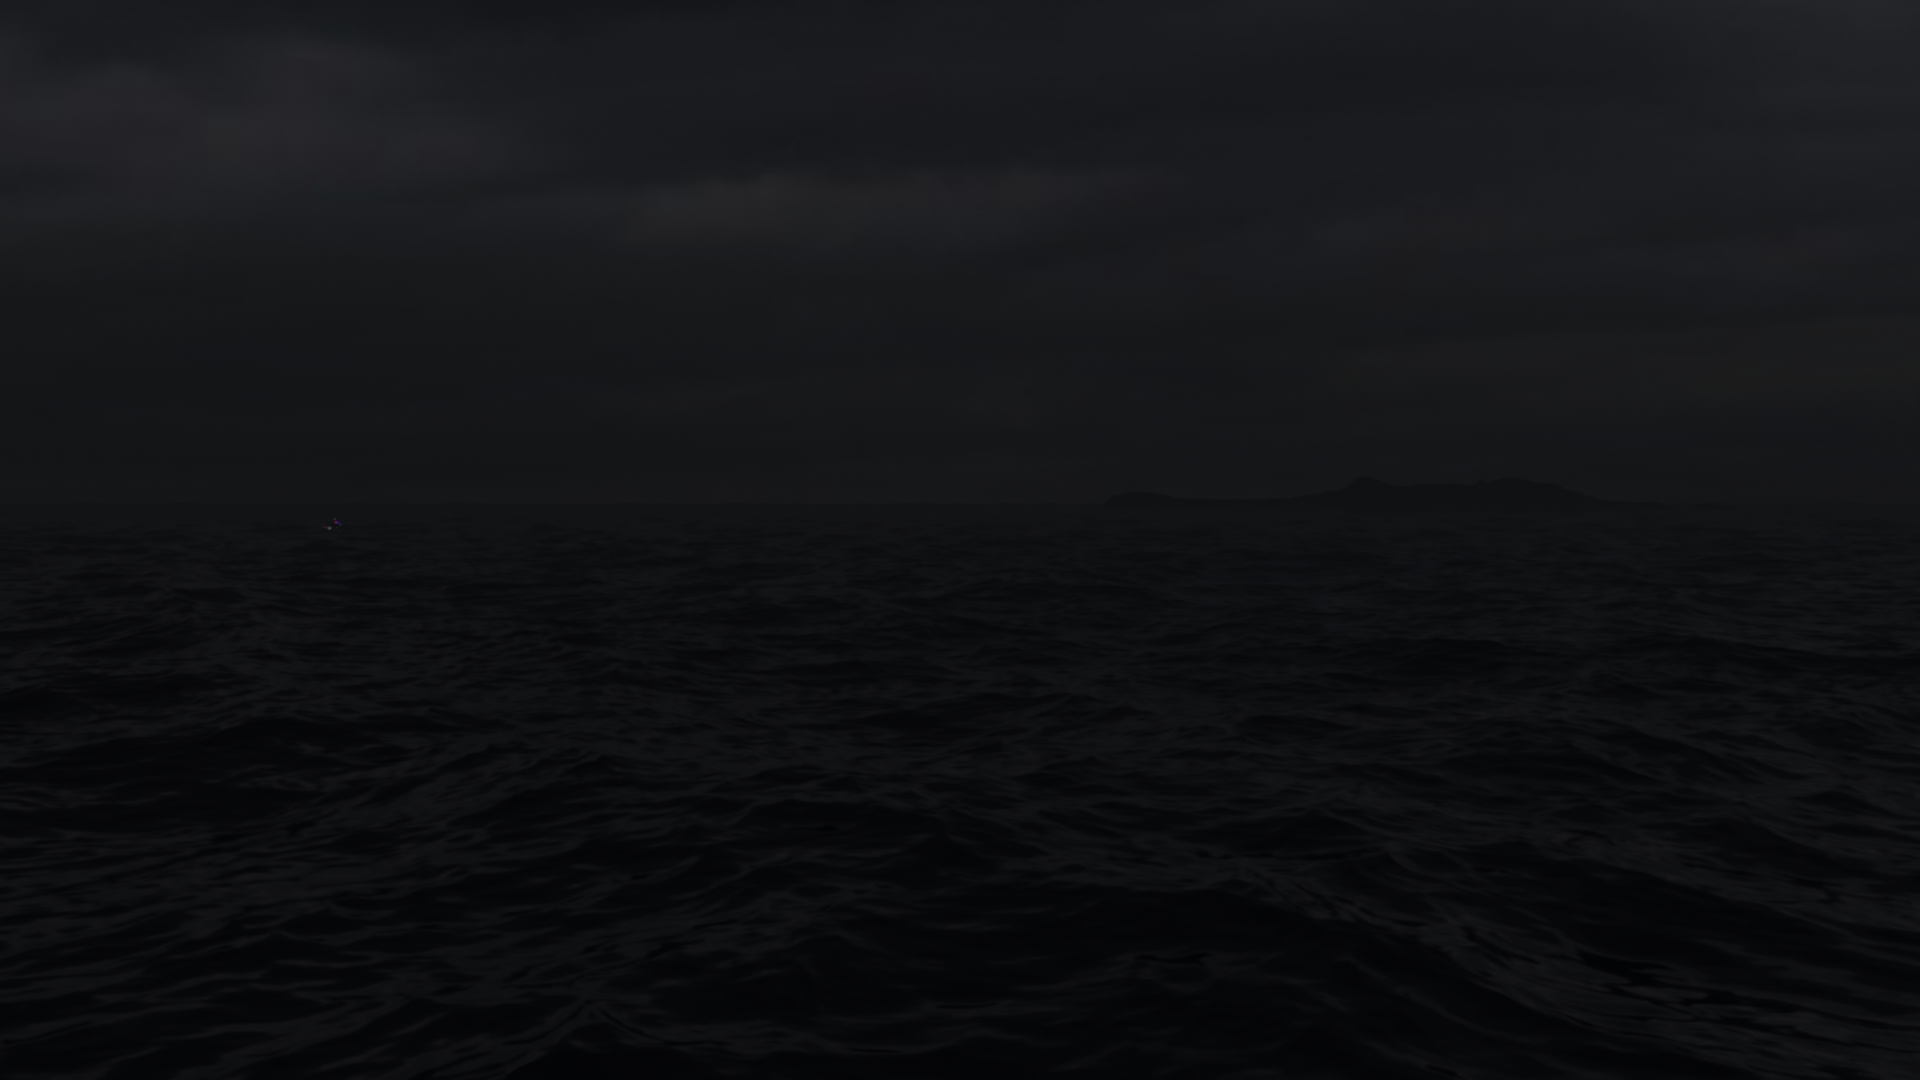
Why Border Surveillance AI? — Threats from the Night Sea
South Korea's coastline stretches approximately 15,000km. It is physically impossible to monitor this entire coastline 24/7 with human personnel alone. Detecting infiltrations that are invisible to the naked eye — especially at night, in fog, heavy rain, or the bitter cold of winter — is a core challenge of modern border operations.
North Korean submarine infiltration, small rubber boat maritime intrusion, and underwater approach are all real threats. AI-based border surveillance systems must learn all these scenarios and respond faster and more accurately than humans. However, actual infiltration scenes cannot be filmed or collected — that is why synthetic data is necessary.
15,000km Coastline
24/7 human monitoring impossible — AI automated alert system essential
Night & Adverse Weather
Real infiltrations exploit night, fog, and storms — EO cameras alone have limits
Role of Synthetic Data
Real infiltration scenes cannot be filmed — CG generates all infiltration scenarios
NIA AI Data Construction Project: The National Information Society Agency (NIA) supports AI training data construction through AI Hub (aihub.or.kr) to advance national AI capabilities. The Military Border Operations Synthetic Data was built by Pebblous under this program, aiming to establish public data infrastructure for defense AI research.
Dataset Introduction — Pebblous' First Defense Synthetic Data
The Military Border Operations Synthetic Data is Pebblous' earliest defense synthetic dataset, with DataClinic diagnosis completed in early 2025. As the predecessor of PBLS_Military (ground equipment) and PBLS_Drone (drone recognition), it marks the starting point where Pebblous began accumulating defense synthetic data expertise.
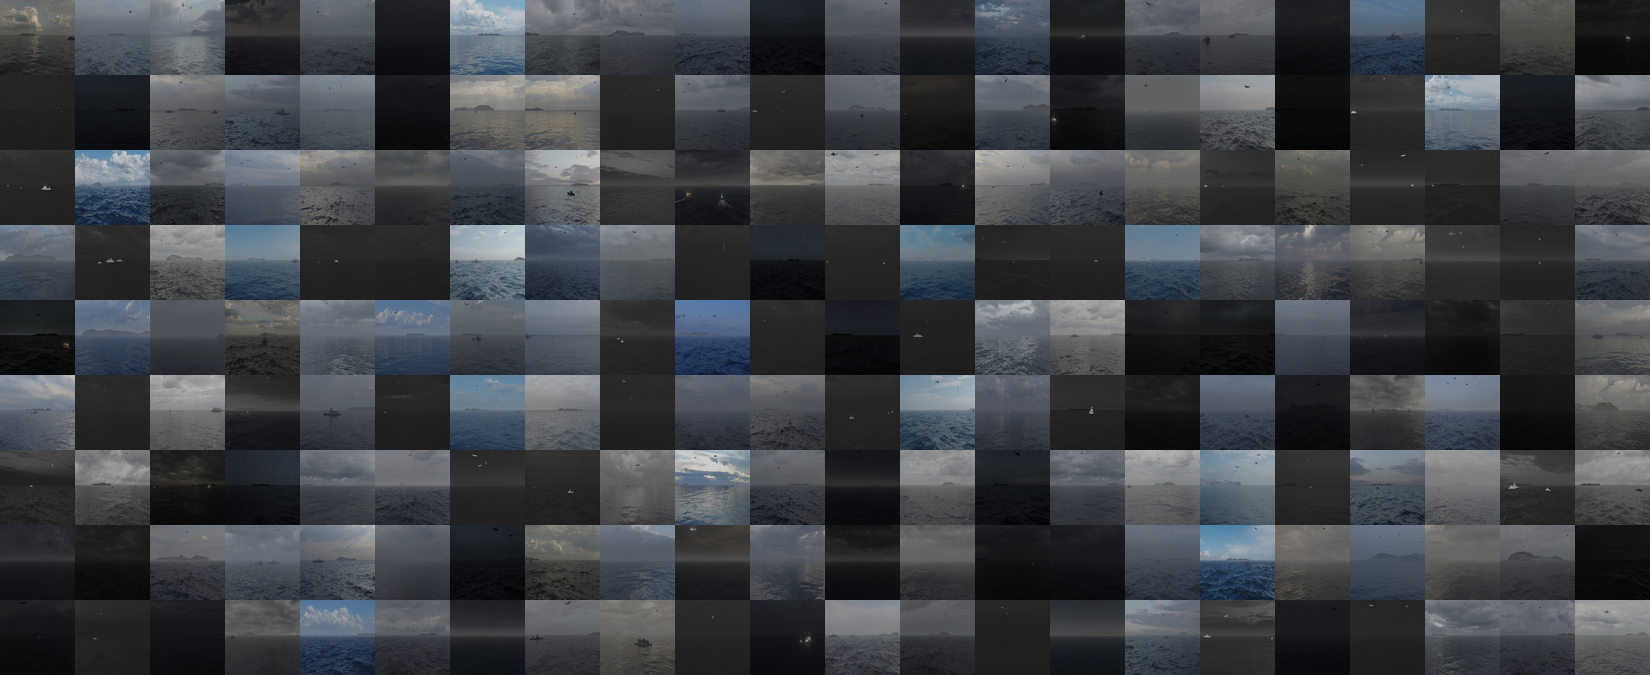
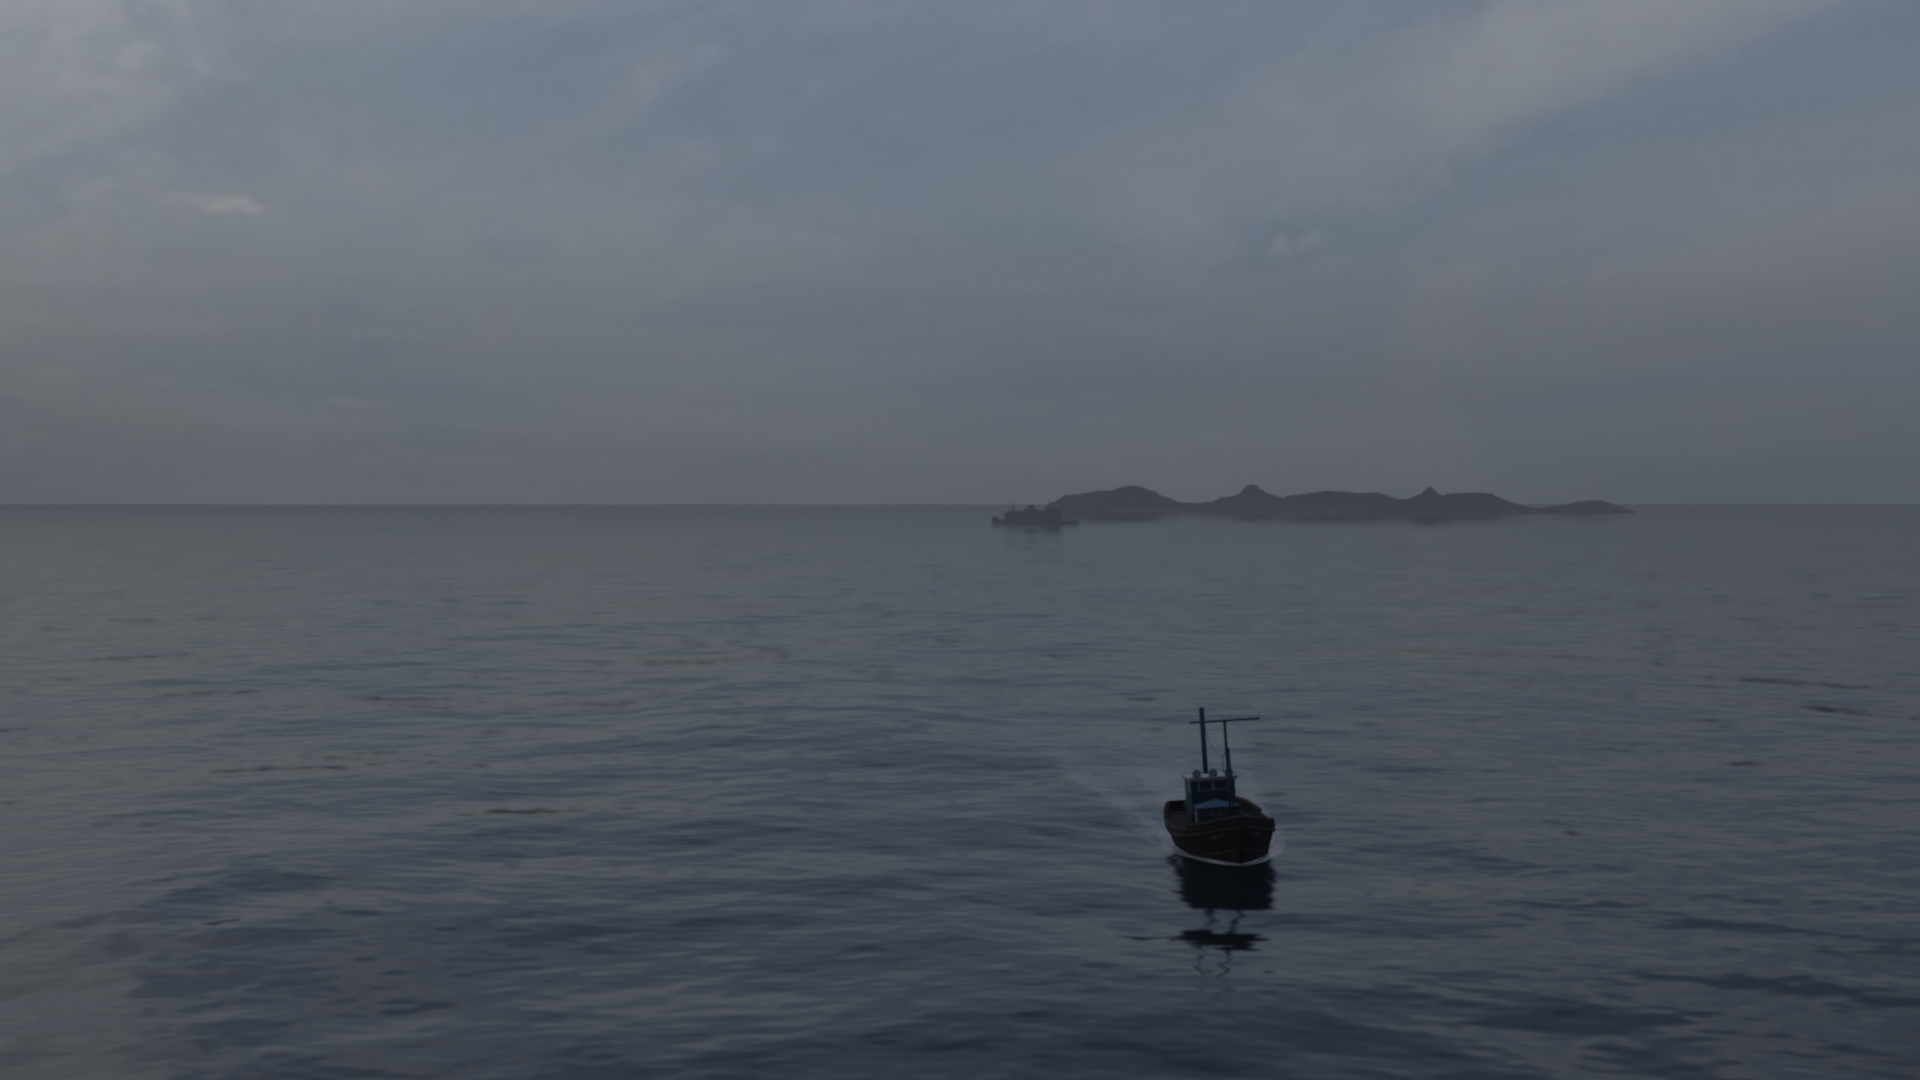
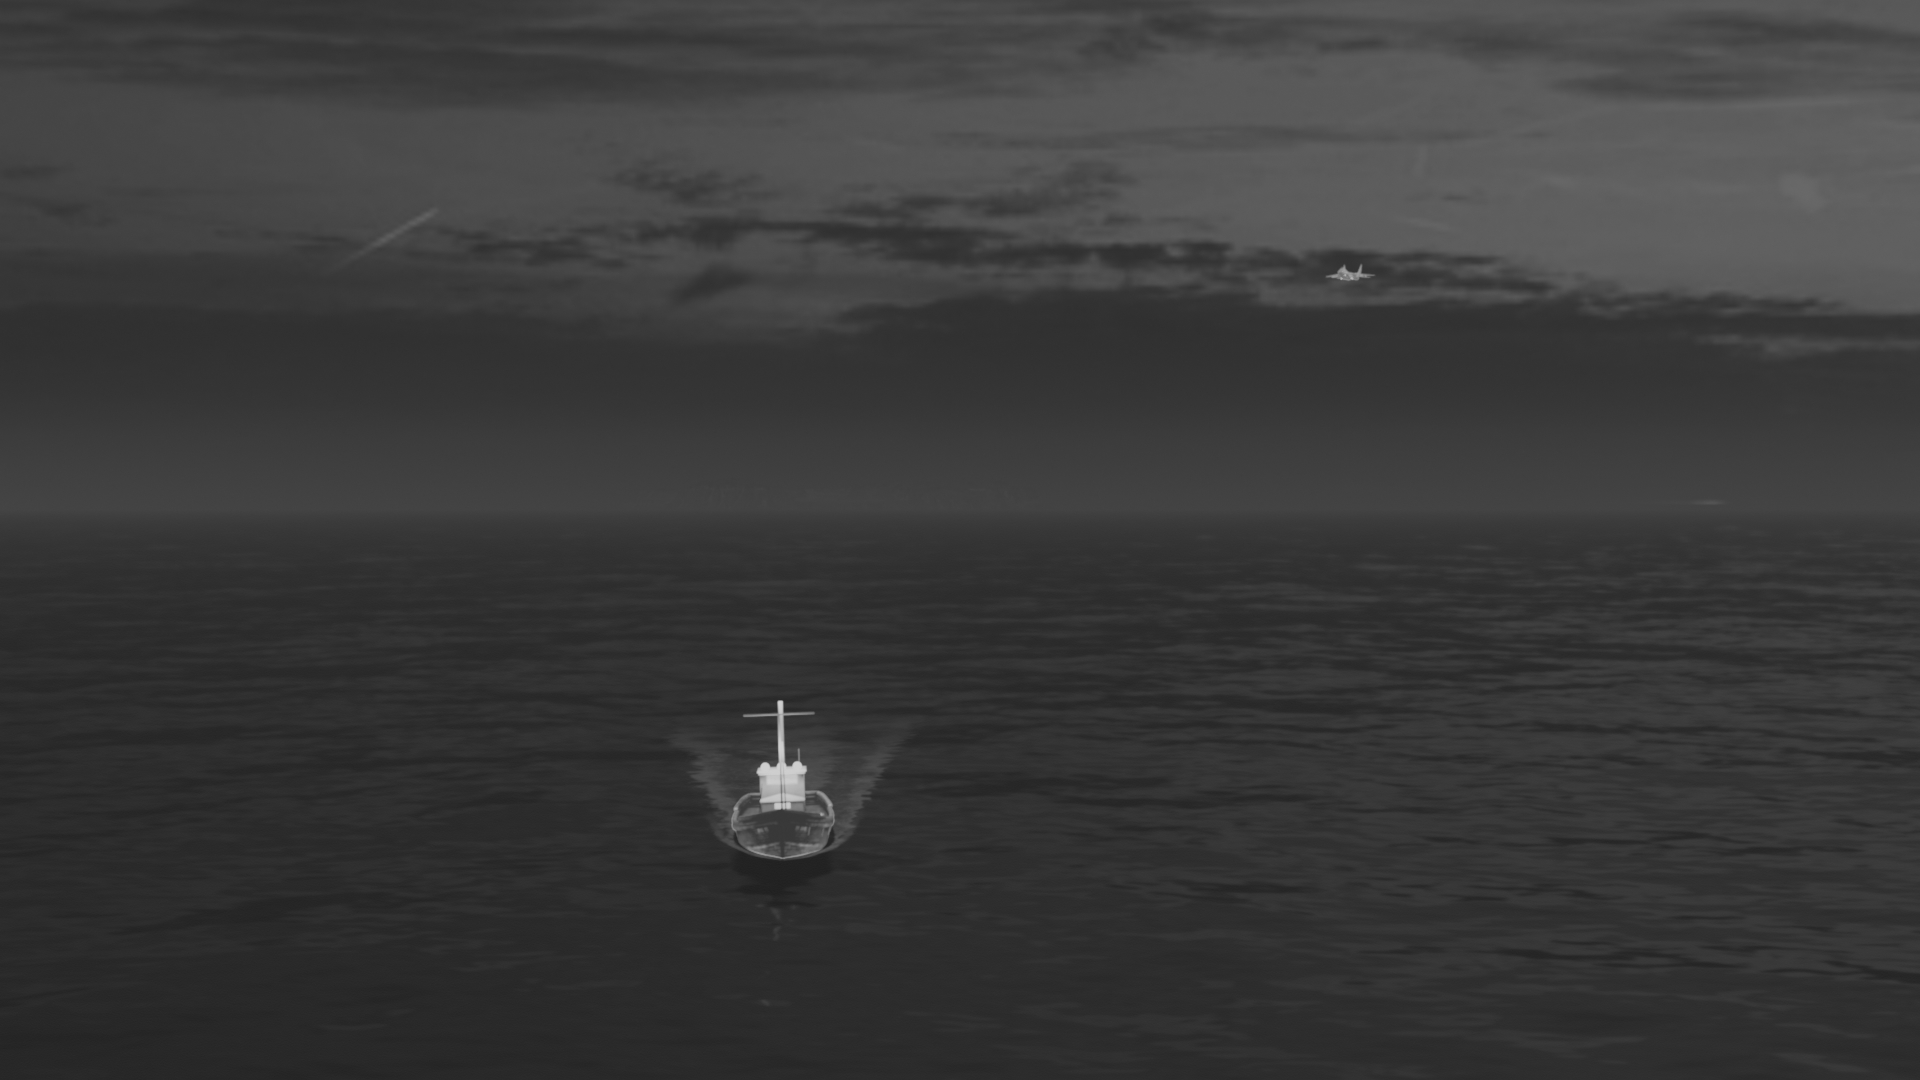
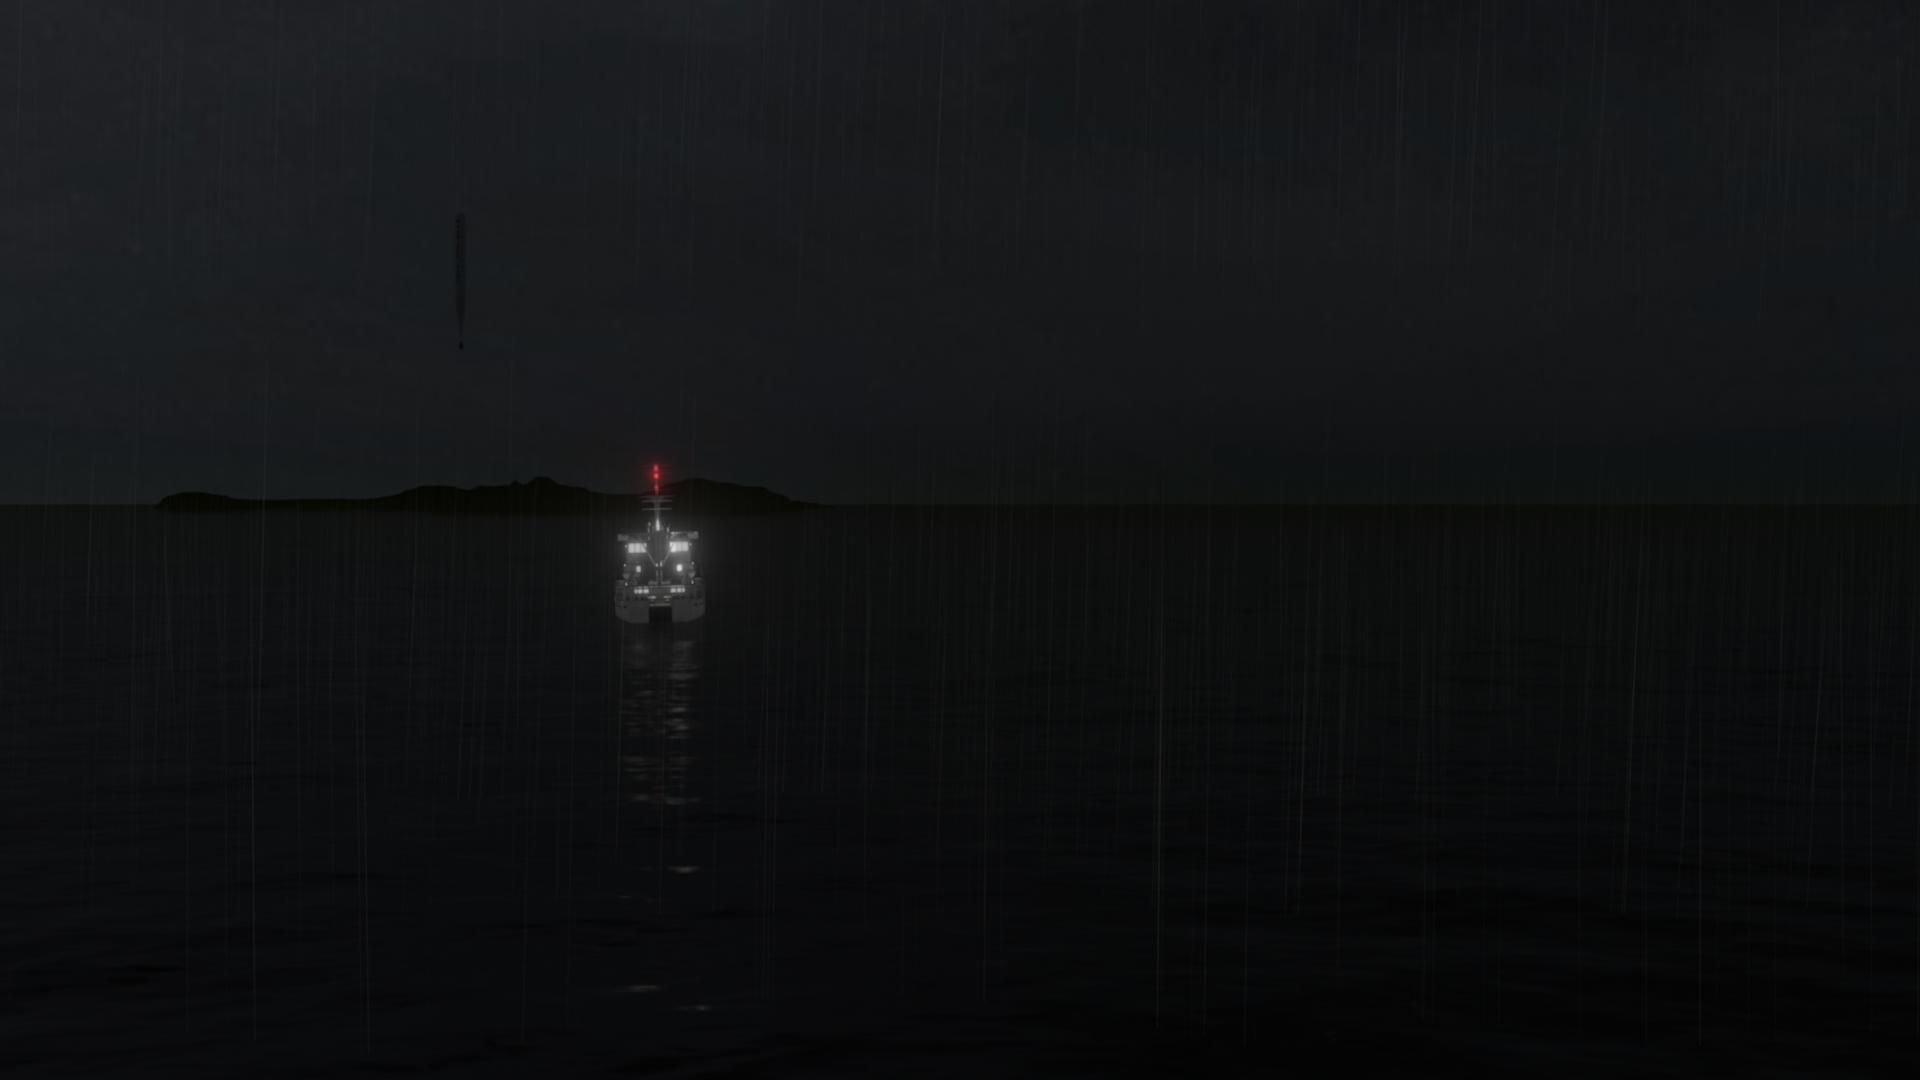
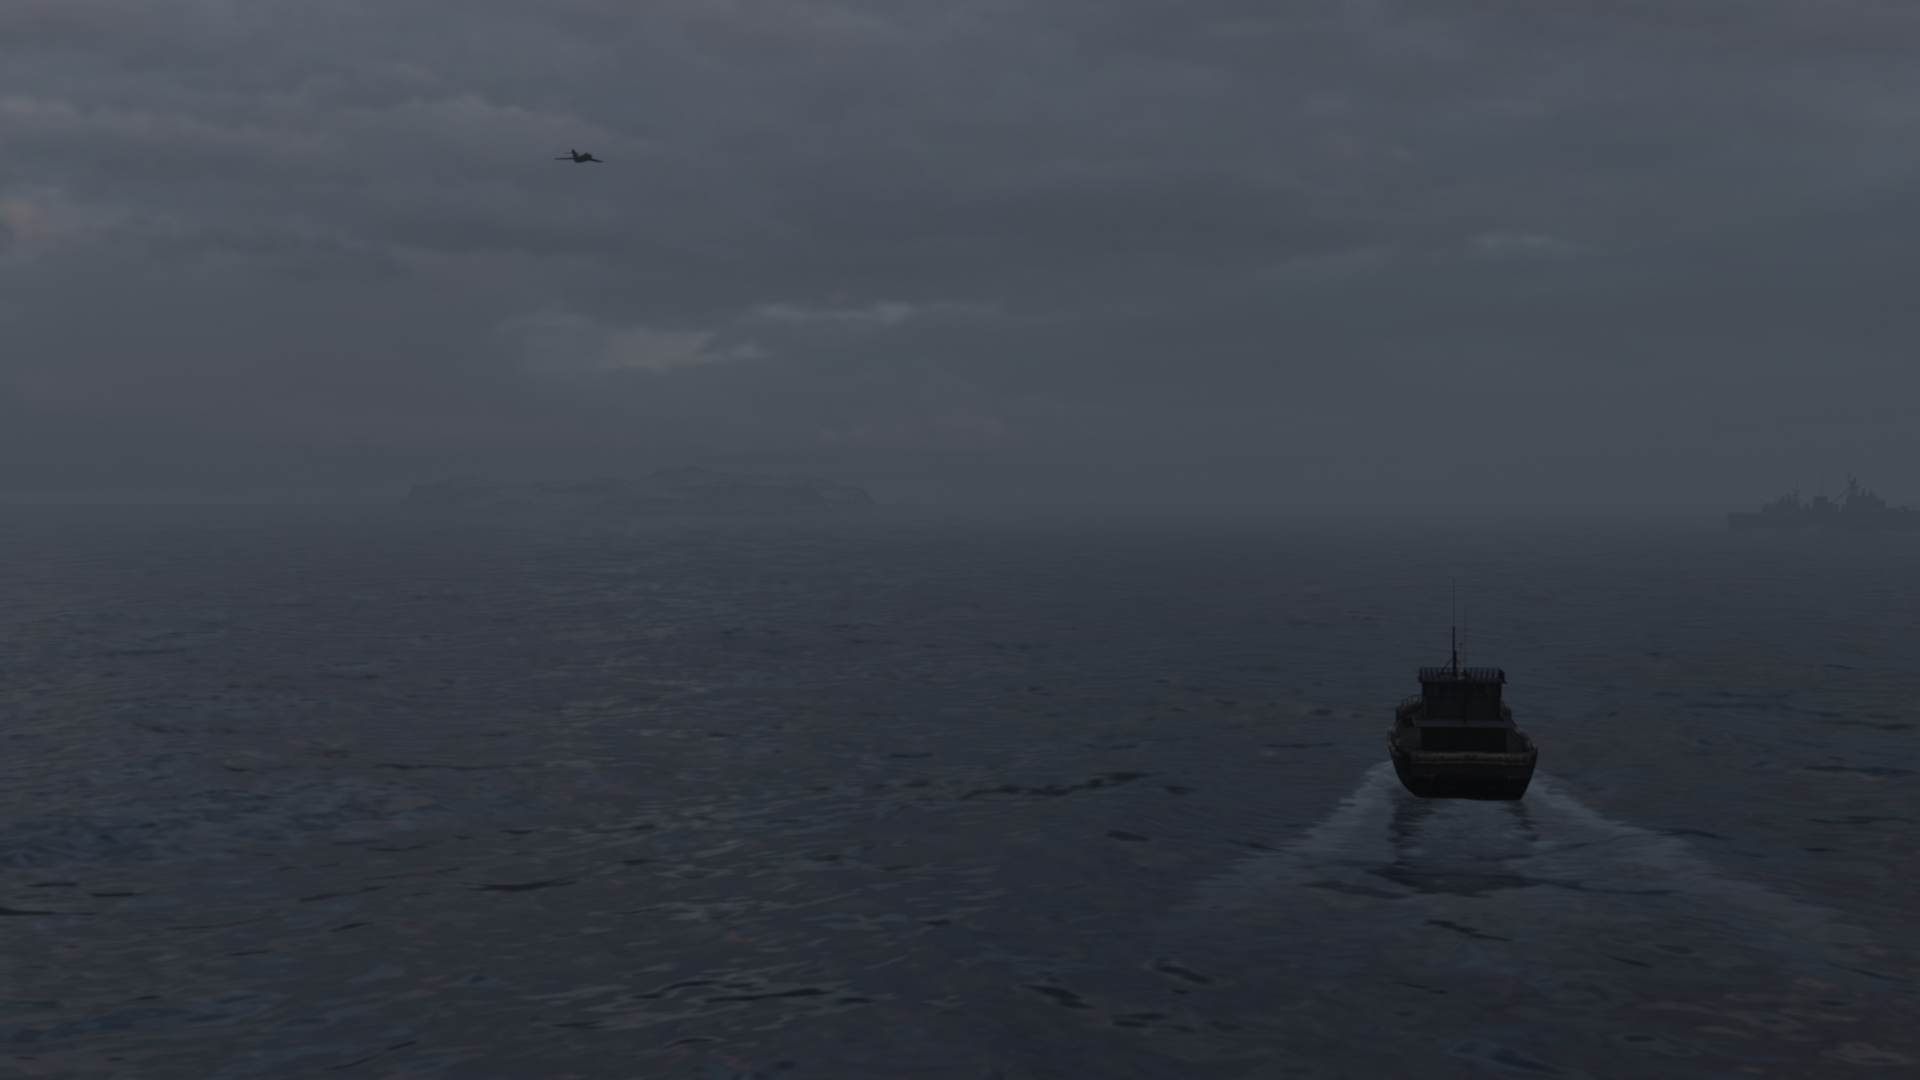
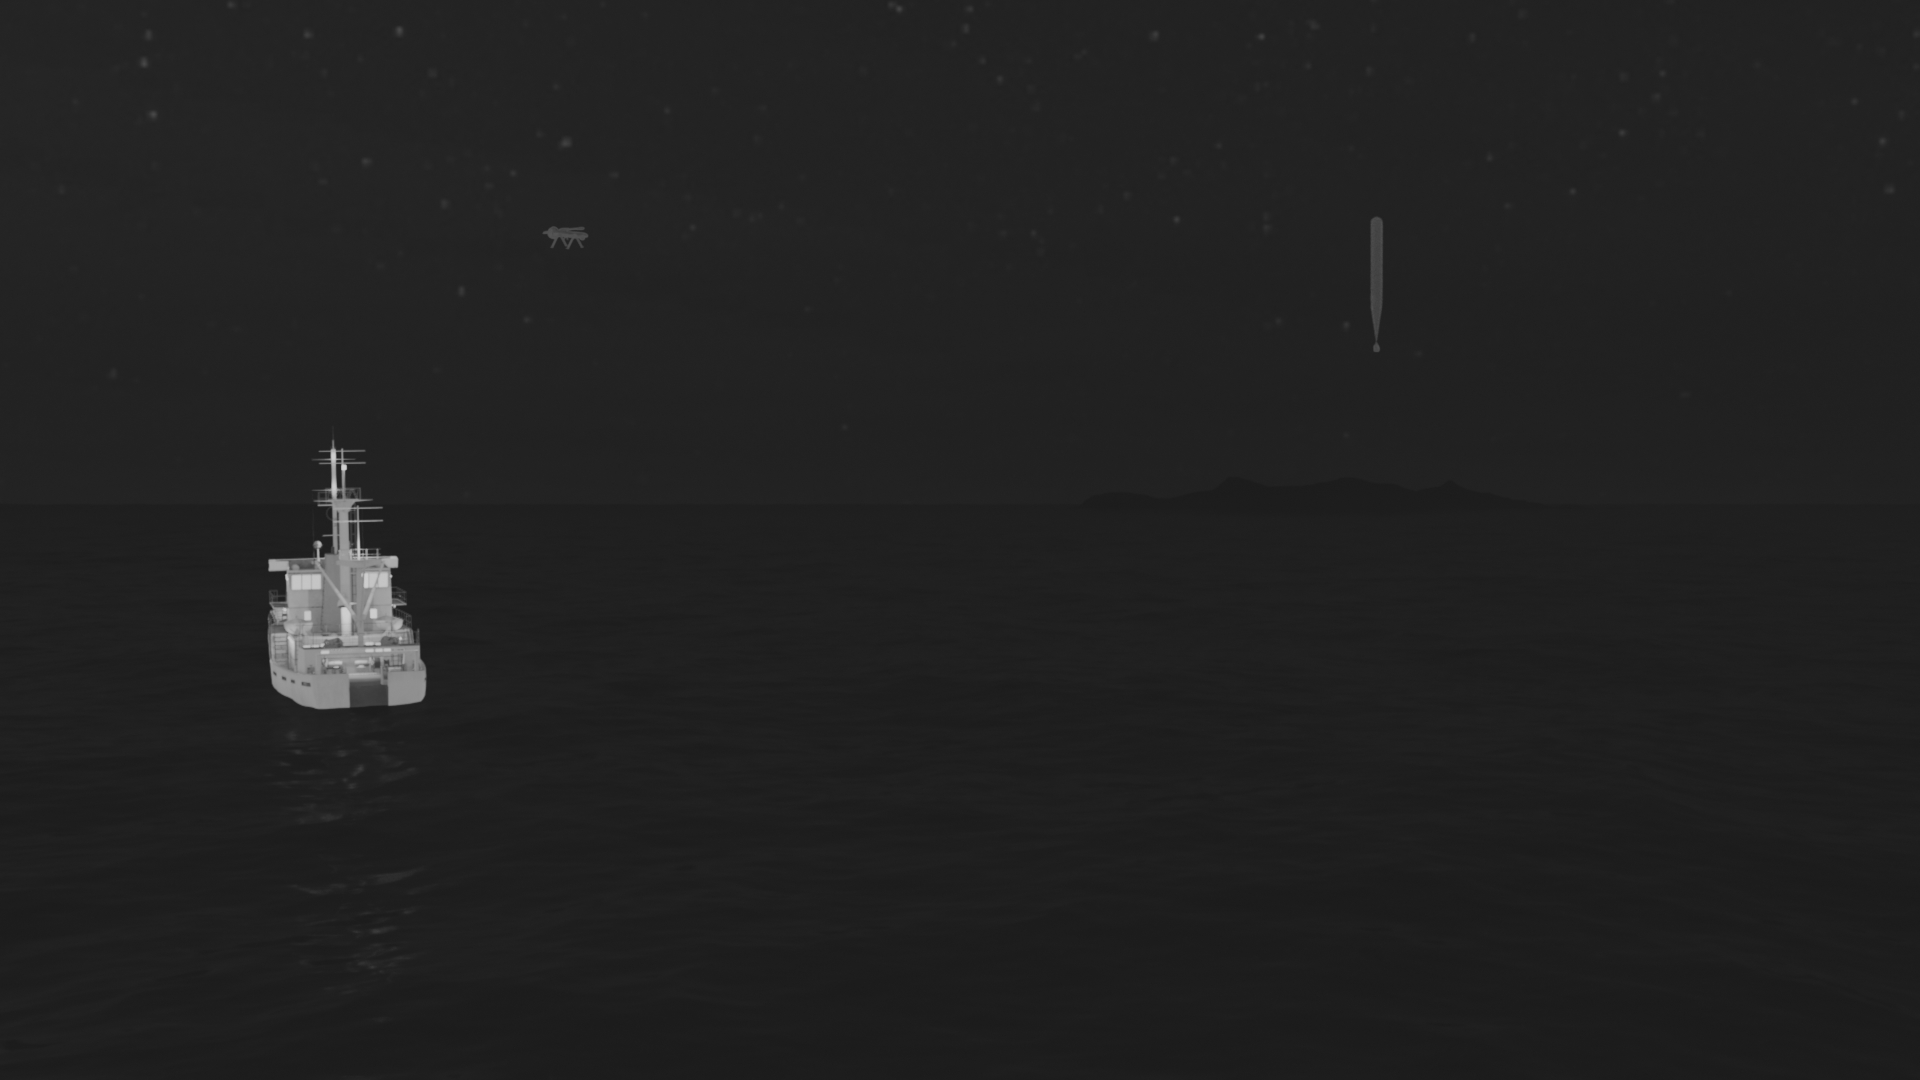
Military Border Operations Synthetic Data — Representative Image Collage (DataClinic L1 Analysis)

High-density representative sample — EO night W6 H7 condition (density 0.664, dataset maximum)
📊 Dataset Specifications
- 🖼️ 149,447 images (diagnosed: 149,446)
- 📦 88GB
- 📐 960x540 ~ 1920x1080 — variable resolution
- 🎨 RGB channels — both EO and IR encoded as RGB
- 🏷️ Single class — "images" (border surveillance scenes)
- 📅 2025.02.24 diagnosis completed
- 🏛️ Source: NIA (National Information Society Agency)
🎯 Data Characteristics
- 📷 EO (Electro-Optical) + IR (Infrared Thermal) dual sensor
- 🌙 Night (NT) + Day (DT) time periods
- ❄️ Summer (SU) + Winter (WI) seasons
- 🌧️ 7-level weather conditions (W1~W7)
- 📡 7-level camera altitude/angle (H1~H7)
- 🎯 Single to compound infiltration scenarios
⚠️ Not Available for Commercial Use
The Military Border Operations Synthetic Data was built for defense-specific purposes through an NIA project and is not licensed for commercial use. It may only be used for research, education, and defense AI development purposes.
Decoding the Filename — Complete 7-Dimensional Condition Encoding
The filenames in this dataset are not simple numbers. They fully encode which sensor, which season/time/weather, what altitude, and what infiltration combination was captured using 7 codes. This structure itself reveals the design philosophy of defense synthetic data.
Filename Structure Decoded
EO=Electro-Optical
IR=Infrared Thermal
SU=Summer
WI=Winter
NT=Night
DT=Day
7 levels
(Clear→Severe)
H1=Close-range Low
H7=Long-range High
Single/Compound
Core of Edge Cases
Camera Position/
Angle Sequence
EO_SU_NT_W6_H7_*_0027.
EO sensor, summer night, W6 weather, H7 (long-range high angle), highest scene number (0027).
This is the "standard surveillance scenario" of this dataset.
Conversely, low-density outliers are dominated by IR, H1, DT, WI combinations — IR thermal, close-range, daytime, winter are the edge cases.
Edge Cases — The Spectrum of Infiltration Scenarios
The infiltration target codes (A1~E5 combinations) in the filename are the true core of this dataset. From solo infiltration to compound infiltrations of 3-5+ persons, it covers the full range of tactical infiltration scenarios. These combinations are exactly the "edge cases of enemy infiltration".
Solo Infiltration — B5
W6 weather / H7 long-range high angle / Scene 0027. Dataset max density (0.664). The standard surveillance scene AI detects most easily.
3-Person Compound — A3+A2+A1
Same environment with 3 infiltrators. Density 0.660 — still high-density. Compound infiltration remains detectable in standard night surveillance.

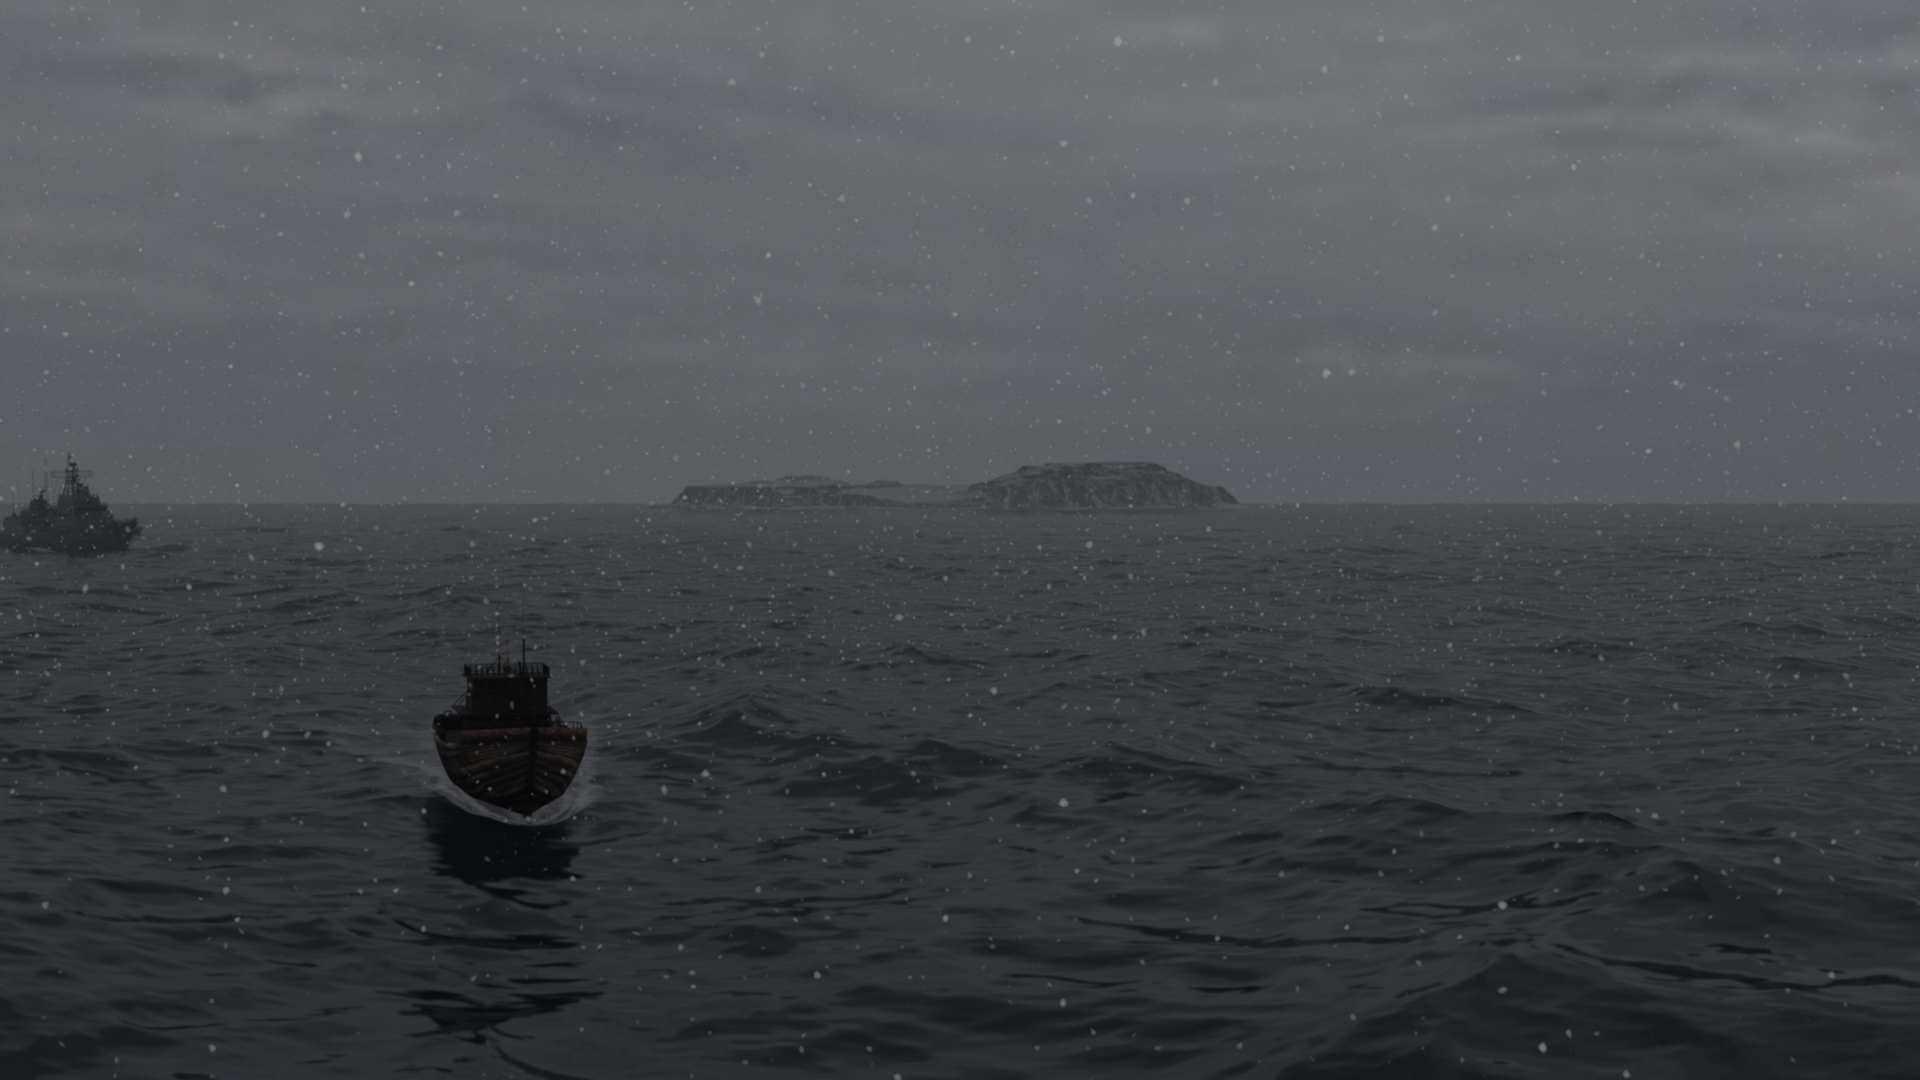
Mixed Infiltration — E3+D3
Different type (E-series + D-series) infiltration combination. Density 0.628 — lower high-density range. Mixed infiltration begins to increase AI detection difficulty.
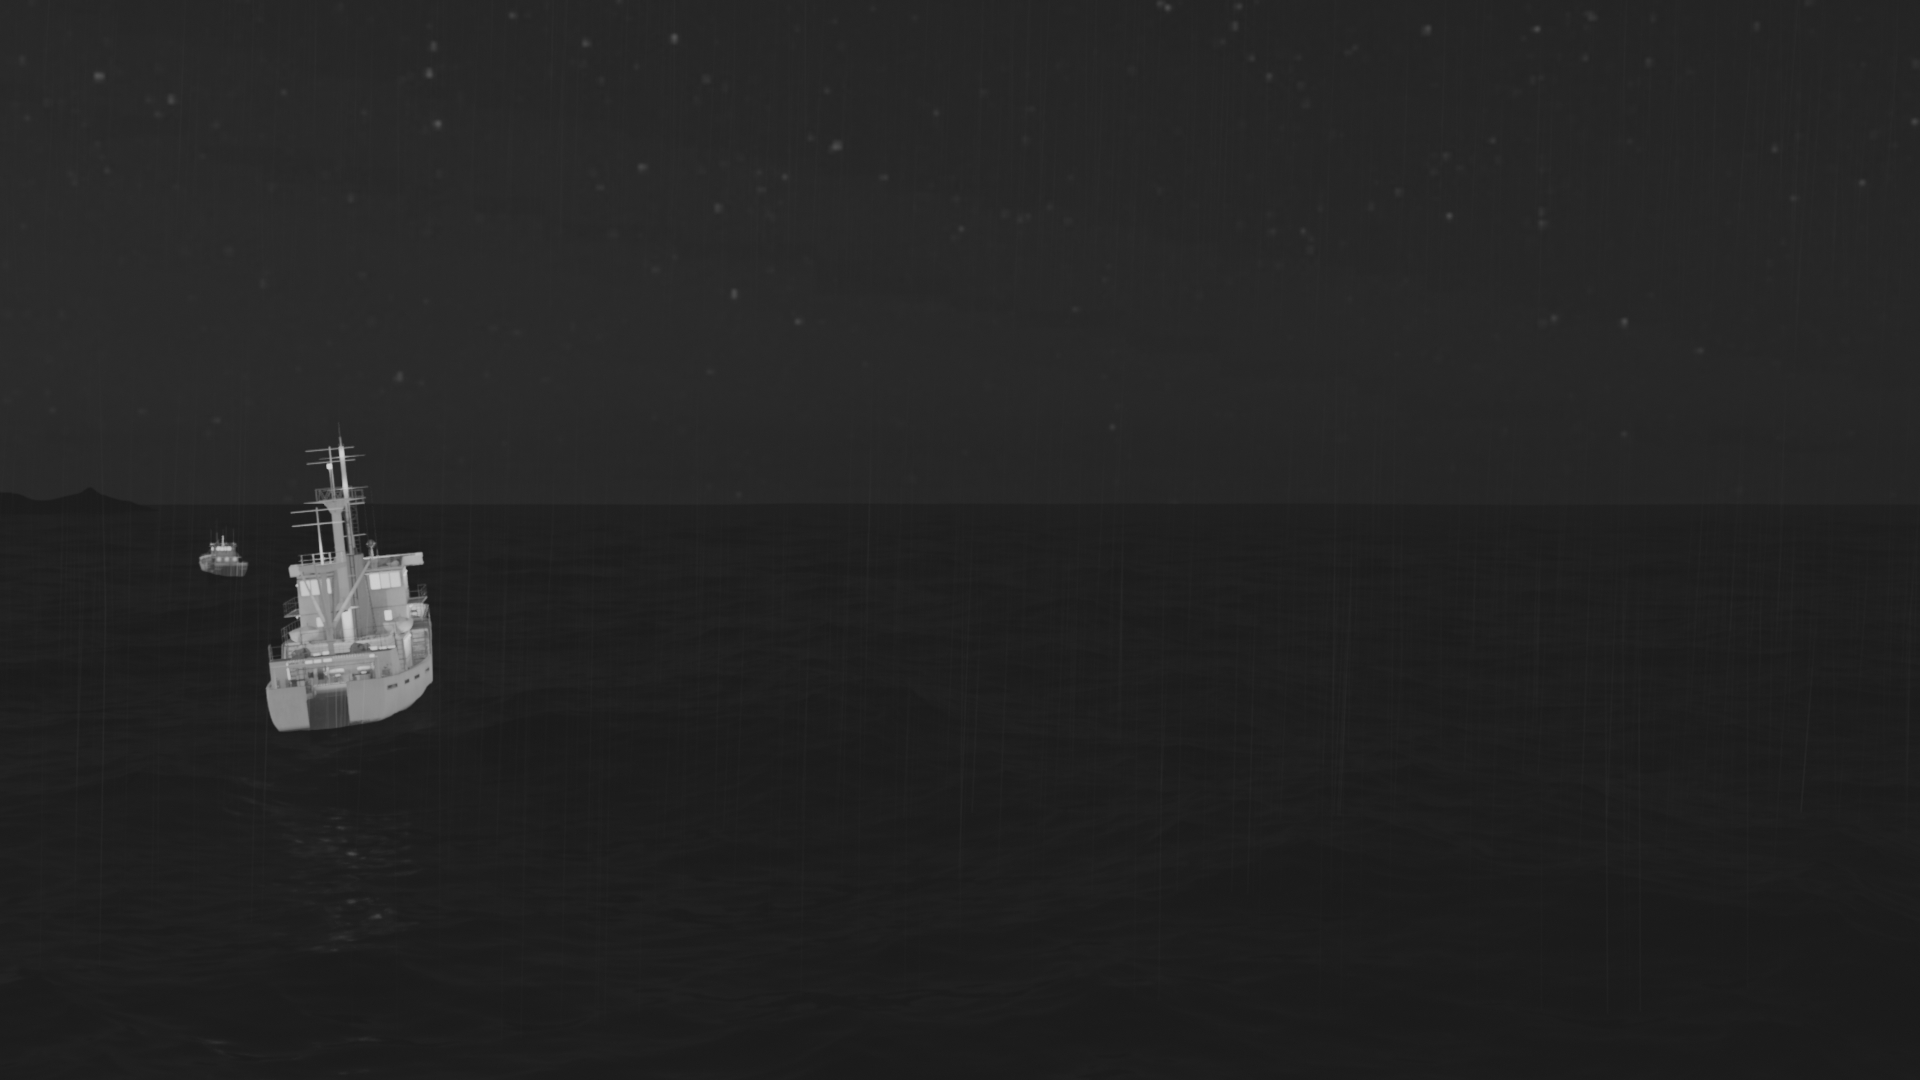
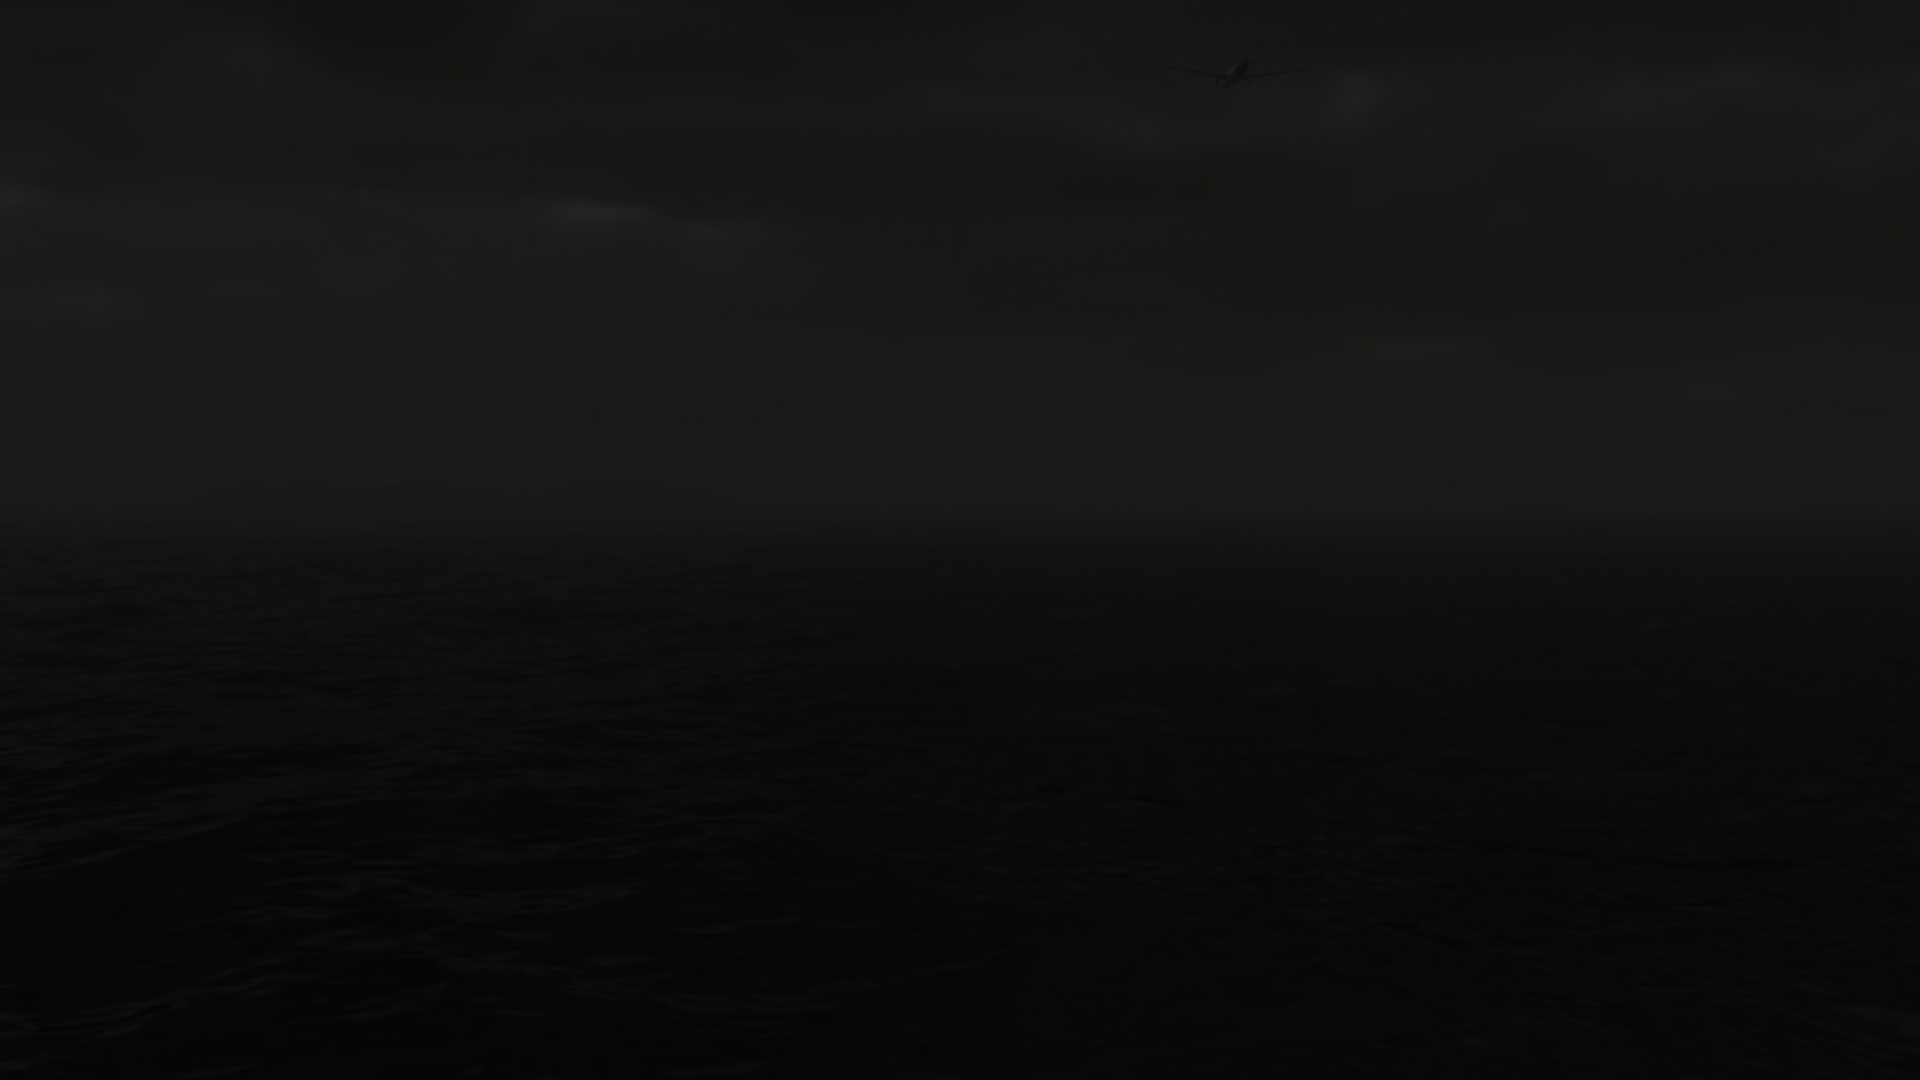
IR Night 2-Person — A4+A3
Switching to thermal camera causes density to plummet (0.105). Same scene, but AI recognizes IR images as "atypical" — the sensor modality barrier.
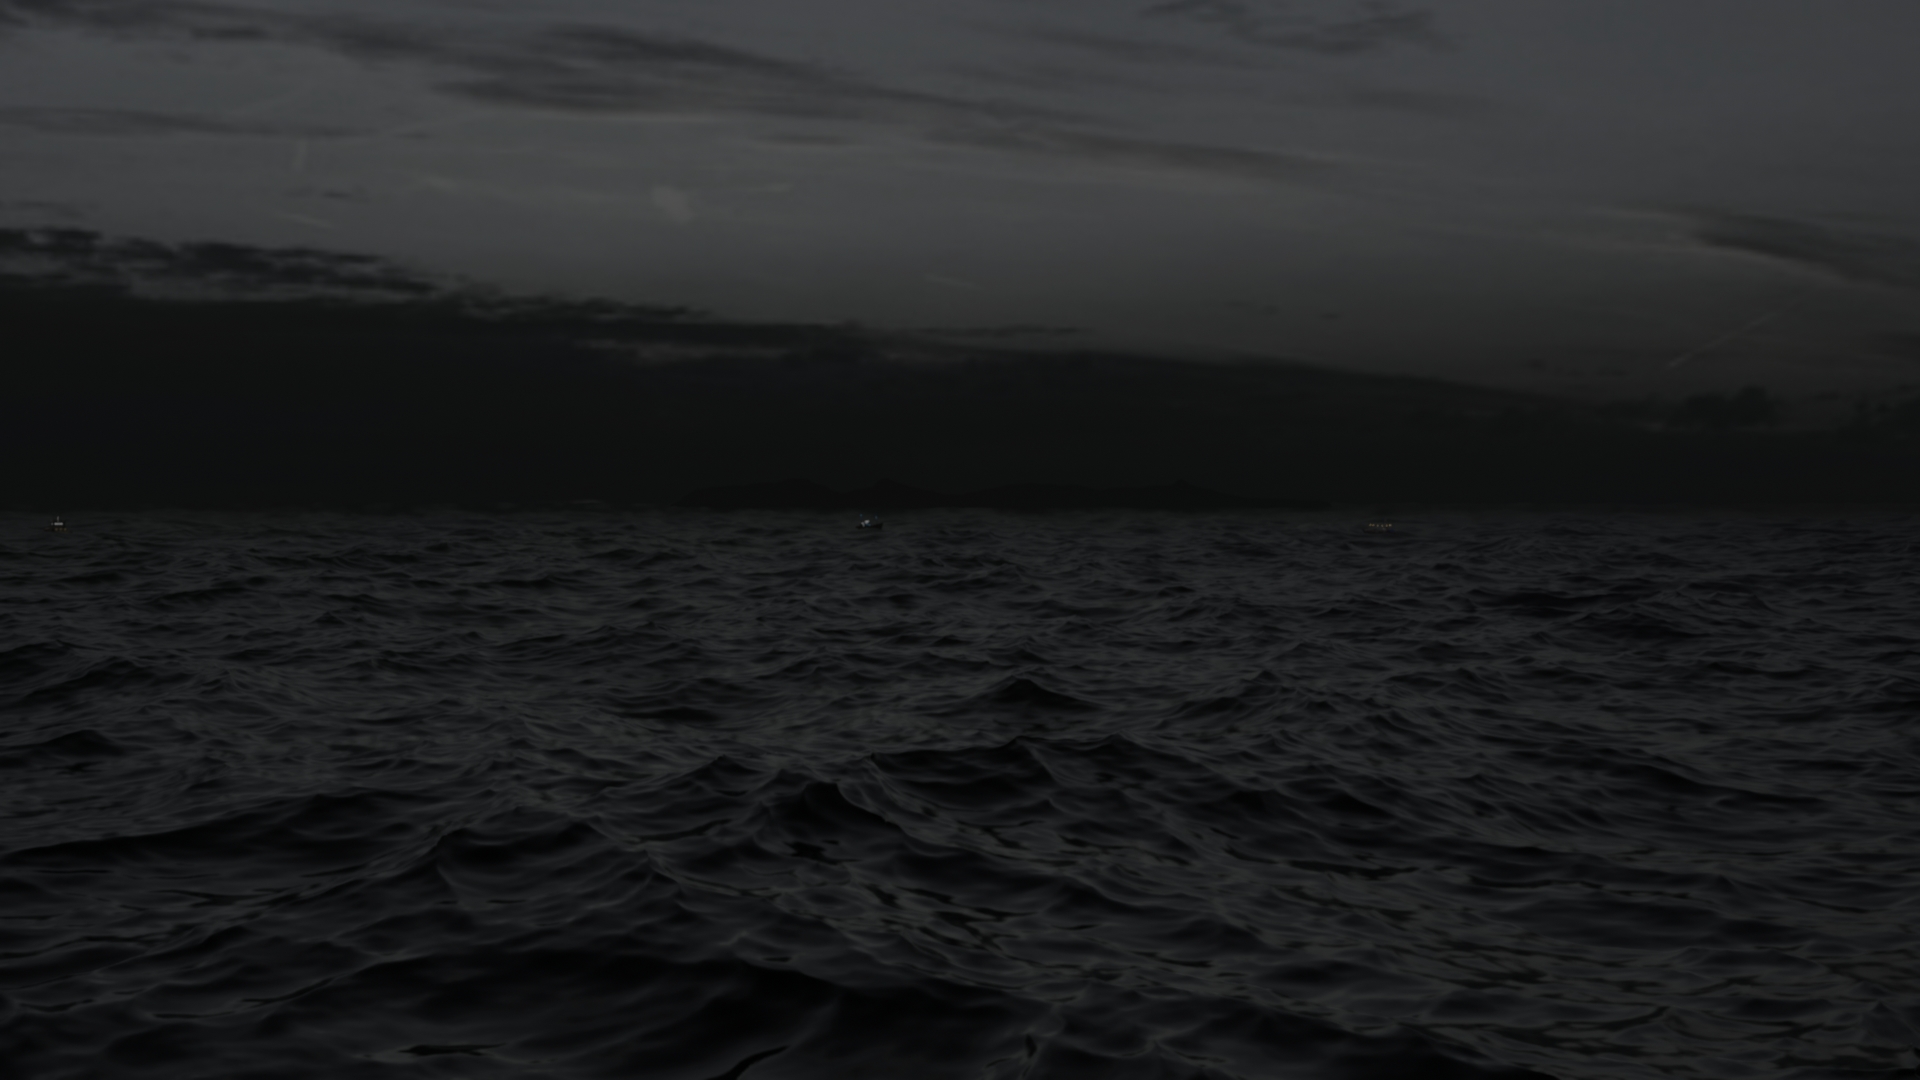
Winter Daytime — B3+A3
Winter (WI) + Daytime (DT) combination. Density 0.087 — extreme low-density edge case. Winter background and daylight create a completely different visual pattern from standard night surveillance.
Daytime Close-Range — A1+A5
DT (daytime) + H1 (close-range) + compound target. Density 0.086 — overall minimum. The scene AI finds most confusing. Pre-alert situation.
- Sensor Switch: AI recognition difficulty spikes when switching from EO (visible) to IR (thermal)
- Environmental Extremes: Winter (WI) + Daytime (DT) + Close-range (H1) is the most atypical combination
- Infiltration Complexity: Detection difficulty increases from solo (A1) to same-type group (A3A2A1) to mixed-type compound (E3D3, B3A3)
Level 1 — Basic Quality Diagnosis
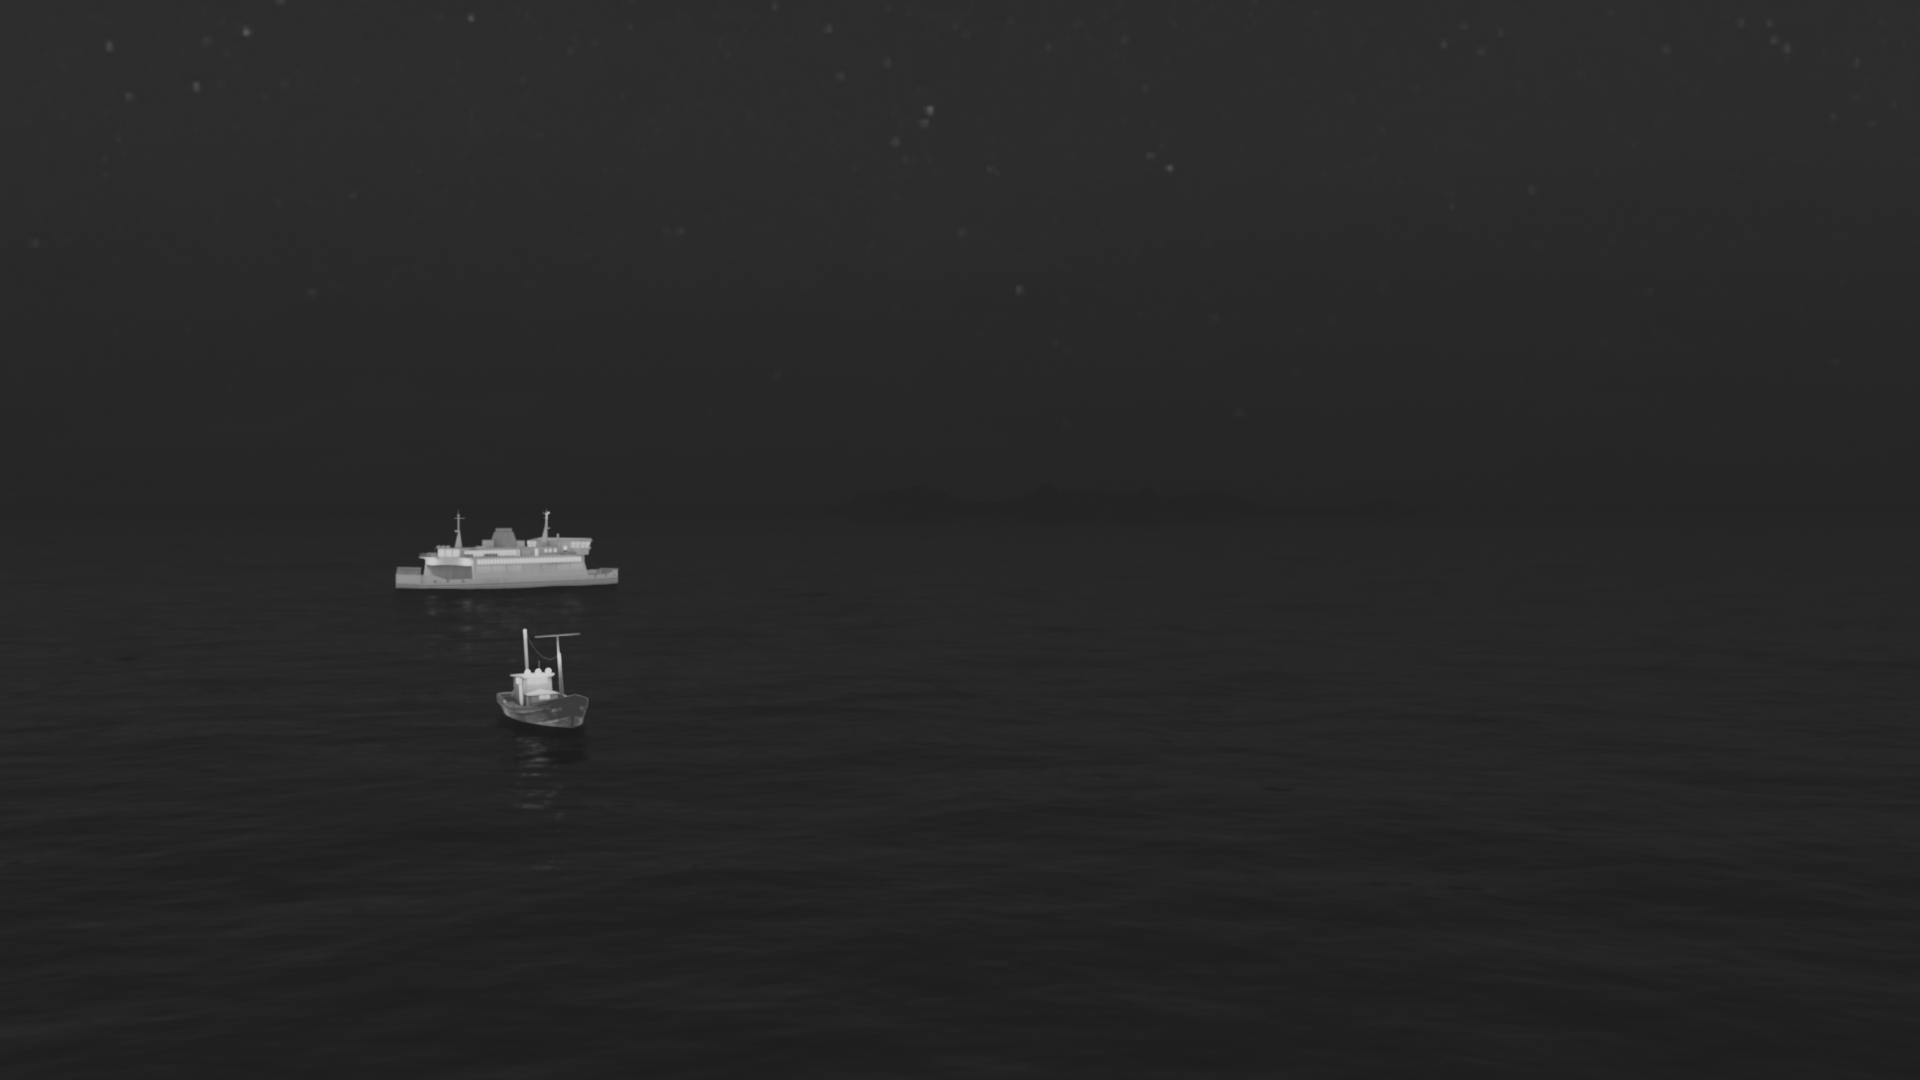
Overall Mean Image — The "Archetype" of Border Surveillance Scenes
This is the result of pixel-wise averaging 149,446 images. EO and IR, night and day, summer and winter all blend together into a blurry composite. It reveals the common structure of border surveillance scenes: sea and sky in the background with small infiltration subjects in the center.

Overall Mean Image — 149,446 images pixel average (DataClinic L1)
✅ L1 Strengths
- 🎨 RGB Channel Consistency: Both EO and IR unified as RGB encoding
- ❌ Zero Missing Values: No corrupted or empty images among 149,447
- 📊 L1 Statistics: Good — Rich structural and textural diversity
- 🗂️ 149,447 images — Largest scale among the three datasets
⚠️ L1 Cautions
- 📐 Integrity: Bad — Variable resolution issue
- 🔀 960x540 ~ 1920x1080: Same aspect ratio but size threshold exceeded
- 📋 No Labels: Single class for unsupervised learning
Level 2 — DataLens Analysis (Wolfram ImageIdentify Net V2)
At Level 2, Wolfram's general-purpose neural network analyzes 149,446 images in a 1,280-dimensional feature space. Despite being a single class, the visual difference between EO and IR is clearly visible in the distribution.
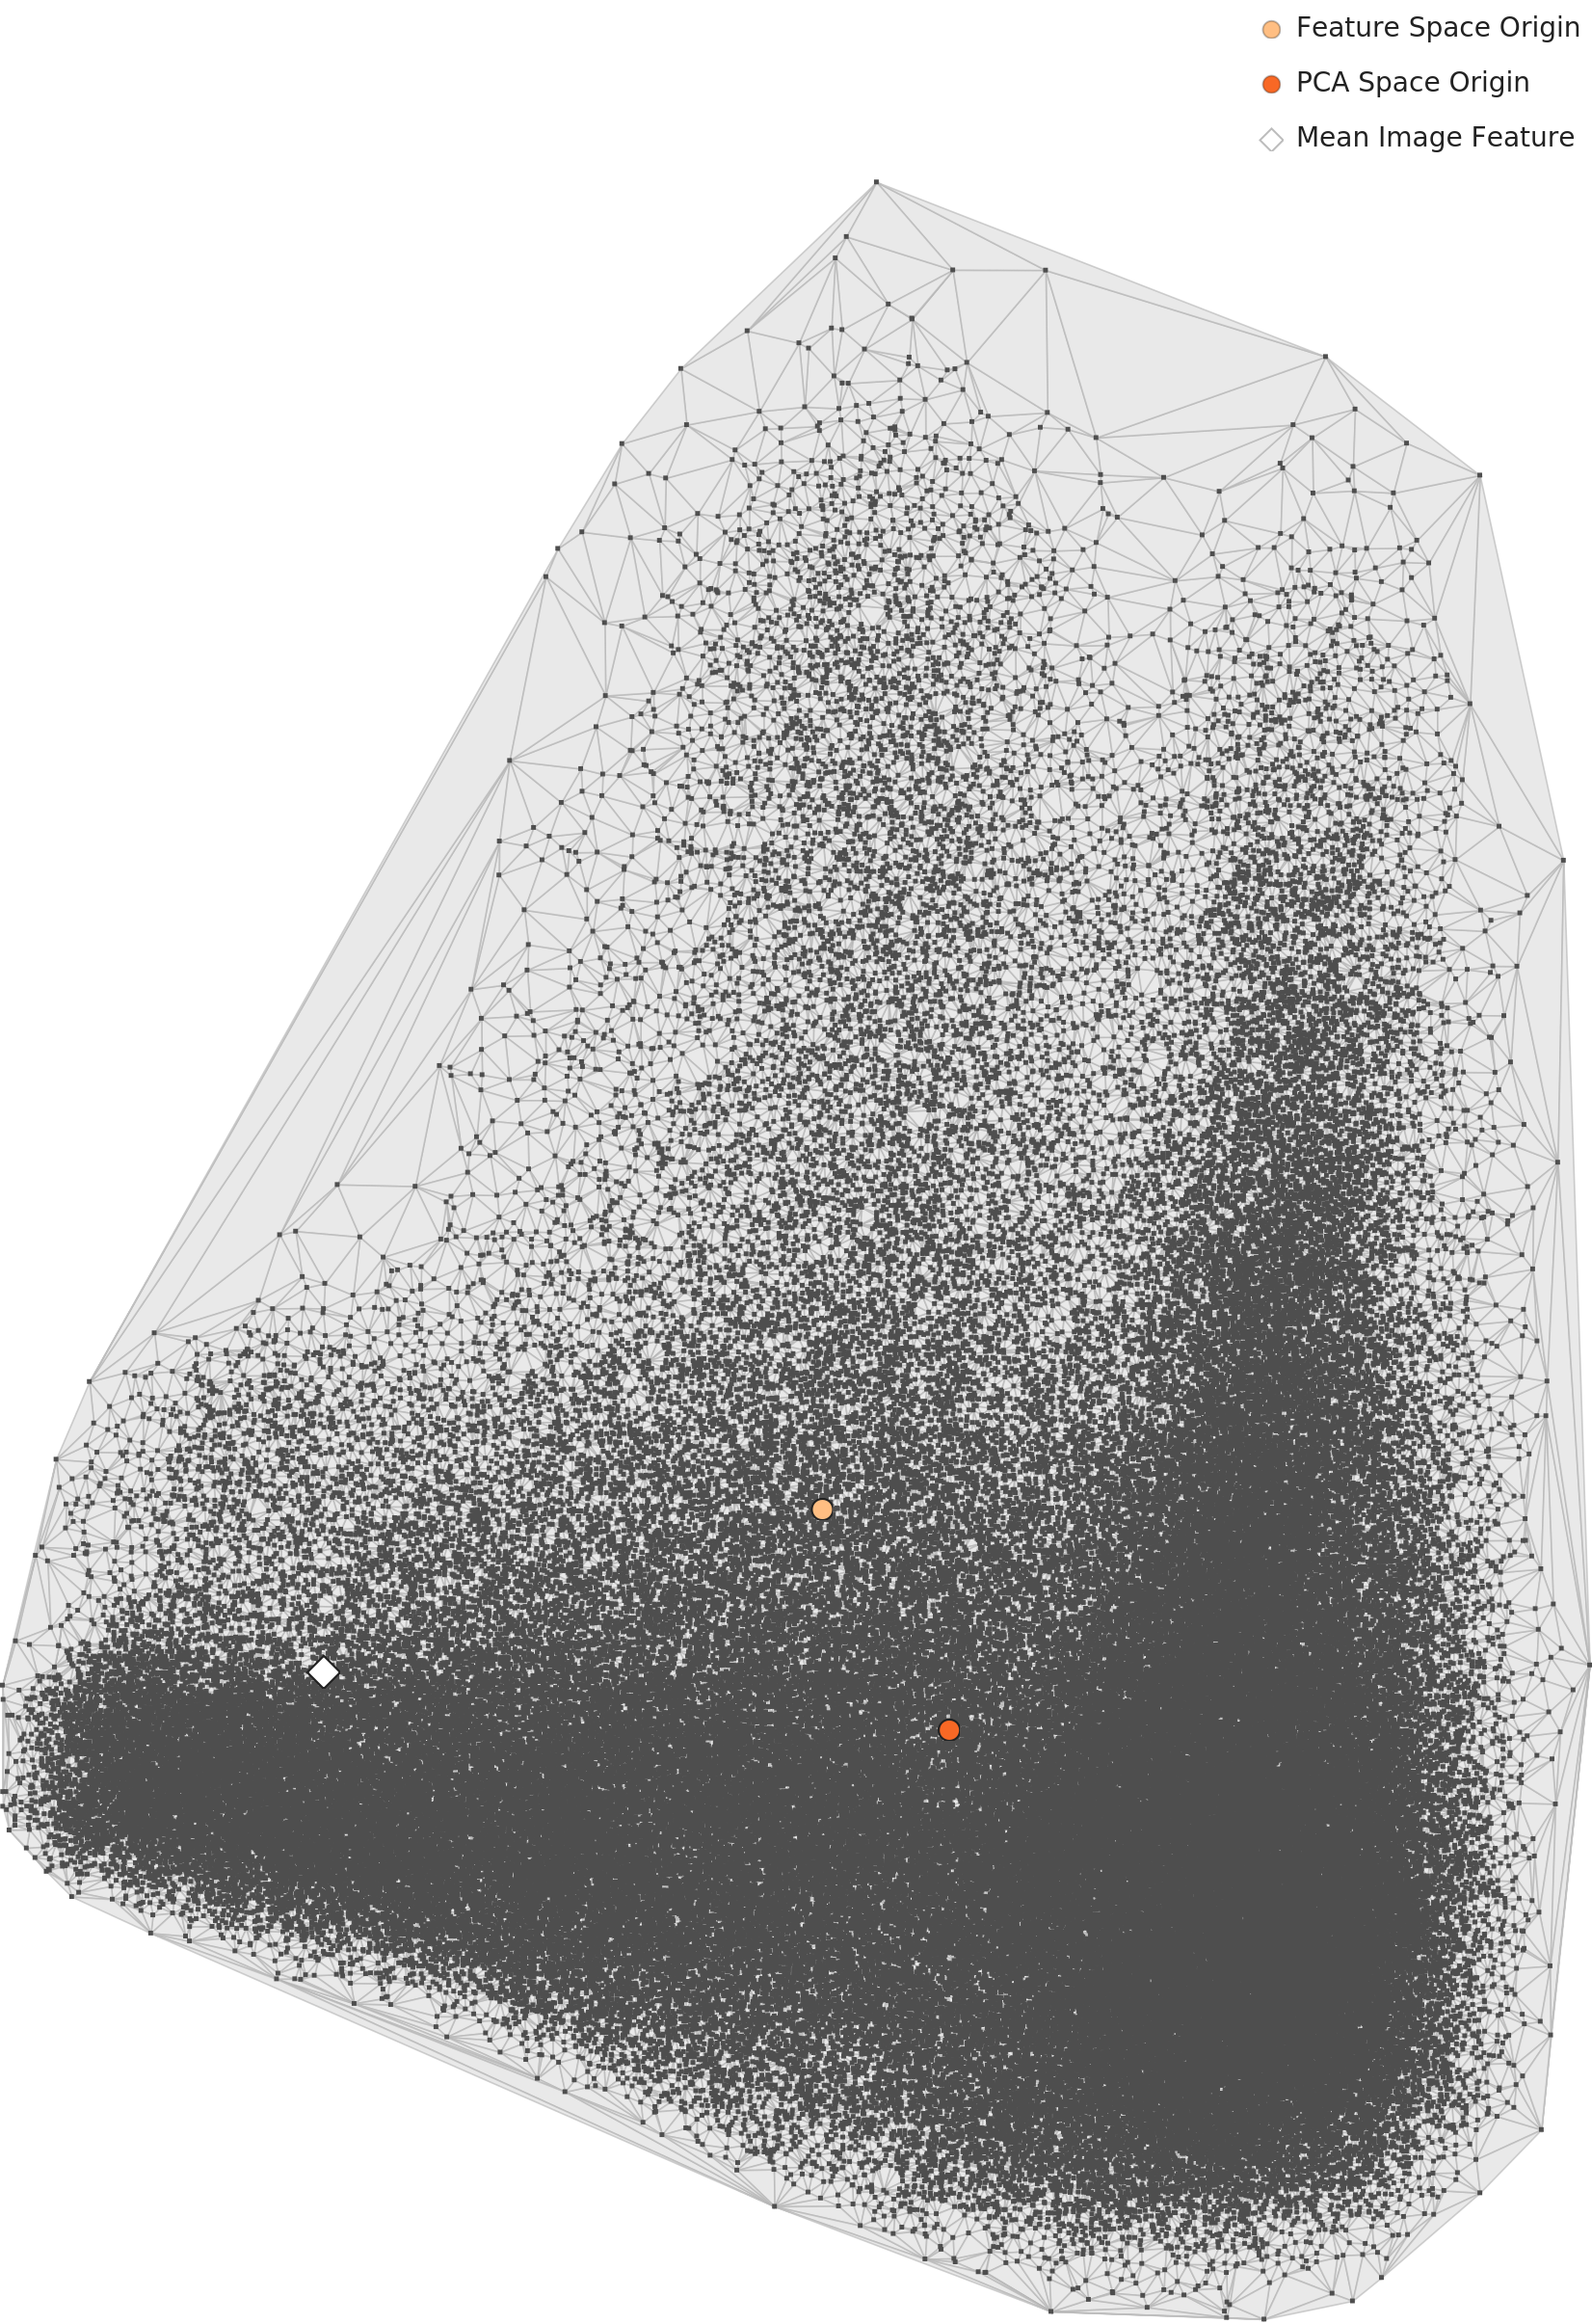
Level 2 PCA Distribution — EO/IR mixed distribution in 1280-dim feature space (Wolfram ImageIdentify Net V2)
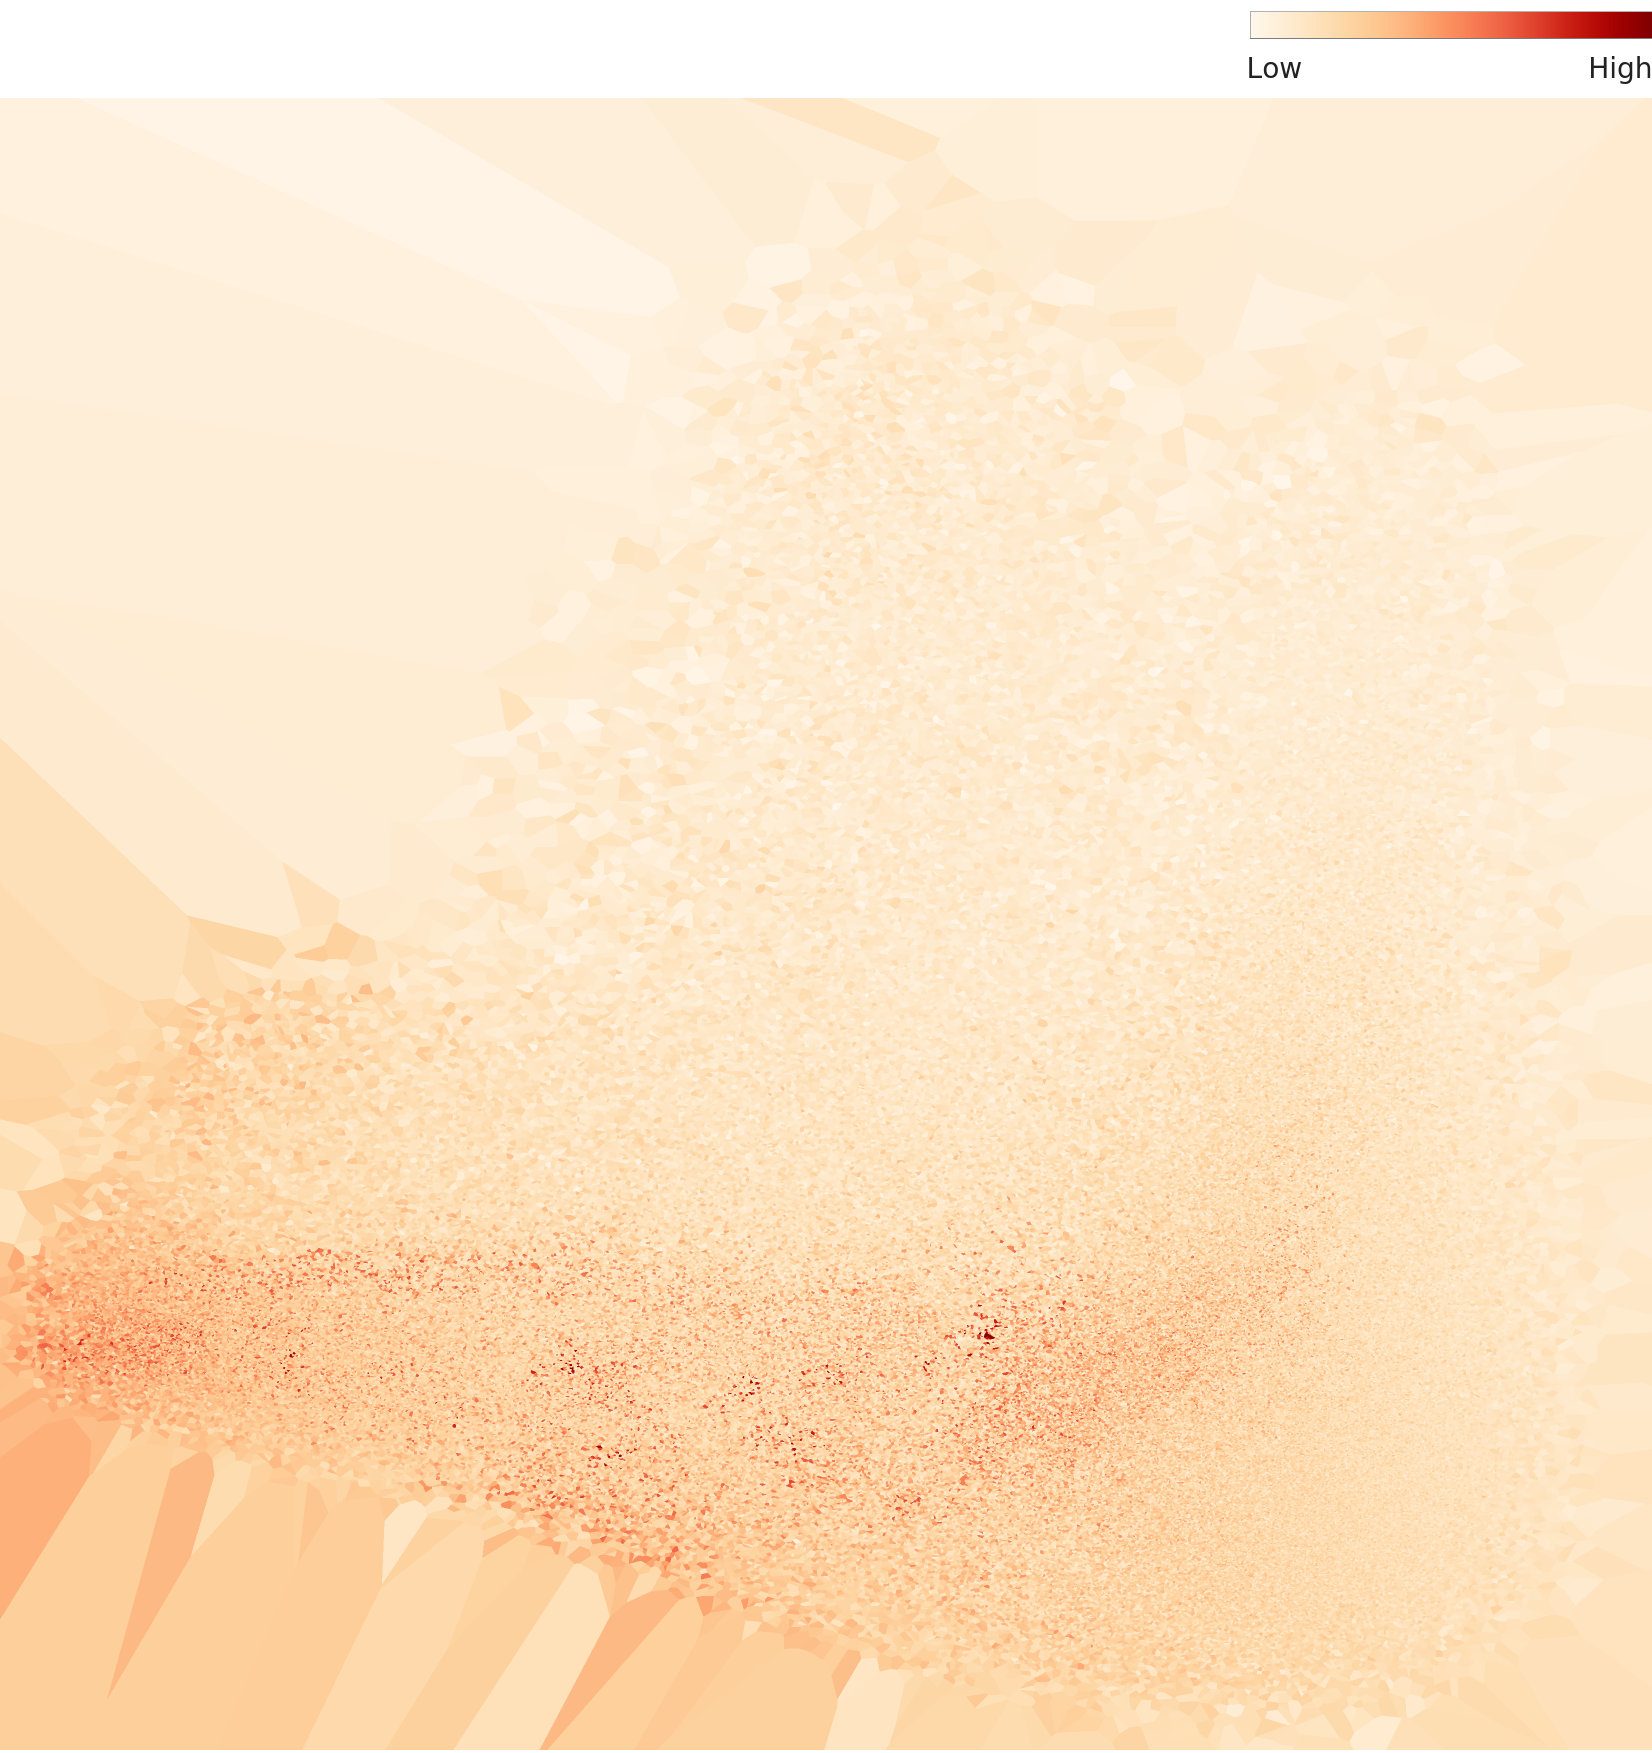
Level 2 Density Terrain Map — 1 major cluster, mean density 0.211 (low)
L2 Key Metrics
Outlier Sample Analysis — The Invisible Boundary Between EO and IR
🟢 High Density — "Standard Surveillance" Scenes
The top 20 high-density samples are all EO + Summer + Night + W6 + H7 combinations. Scene numbers also cluster around 0027 or the 0012~0018 range. The conditions AI recognizes as "typical border surveillance" are clearly revealed.


🔴 Low Density — The Most Challenging Edge Cases for AI
The low-density top ranks are dominated by IR images, Daytime (DT), Winter (WI), and Close-range (H1). The exact opposite conditions of high density.
🔄 The Two Most Different Scenes — EO vs IR Extremes
Both are "night infiltration" scenes, but to AI's eyes, EO (visible light) and IR (thermal) are completely different worlds.
Pebblous' Three Defense Synthetic Datasets — An Evolutionary Trajectory
Starting with the Military Border Operations Synthetic Data (#124), Pebblous' defense synthetic data has grown increasingly diverse and sophisticated. Comparing the three datasets reveals the direction of Pebblous' synthetic data technology evolution.
Three Dataset Comparison
| Metric | #124 Border | #224 Military | #226 Drone |
|---|---|---|---|
| DataClinic Score | 88 | 68 | 87 |
| Images | 149,447 | 3,171 | 28,801 |
| Data Size | 88GB | — | 52GB |
| Classes | Single | 10 | Single |
| L2 Mean Density | 0.211 | — | 0.300 |
| Recommended Action | BulkUp | Diet | BulkUp |
Recommendations — Beyond 88, the Next Steps
Data BulkUp — Focus on IR Region
This is DataClinic's core recommendation. Currently, IR images are concentrated in low-density regions of the embedding space, making them underrepresented. Adding more diverse infiltration scenario images under IR conditions could significantly improve the AI model's thermal recognition performance.
Resolution Normalization — Improve Integrity
The coexistence of 960x540 and 1920x1080 is the cause of the "Bad" integrity grade. When generating new images, unifying to a single resolution (1920x1080) or upscaling existing images to ensure consistency is recommended.
⚠️ L3 Diagnosis Not Performed — Opportunity for Deeper Analysis
This report was diagnosed only up to L2. Unlike PBLS_Drone and Military, there is no domain-specific lens (L3) analysis, meaning infiltration-type distribution differences or EO/IR cluster separability could not be precisely characterized. Performing an additional L3 diagnosis would allow much more accurate identification of DataBulkup target areas.
Multimodal AI Architecture Recommended: The analysis showing EO and IR occupy completely different positions in embedding space suggests that a multimodal Fusion architecture (processing EO and IR through separate encoders then fusing) is more suitable for this dataset than a simple CNN classifier. Additionally, domain adaptation techniques are needed to fine-tune models trained on synthetic images to work with real surveillance camera footage.
Conclusion — The Origin of Pebblous Defense Synthetic Data
The Military Border Operations Synthetic Data is not just another dataset. It is the work where Pebblous took its first step into the new domain of defense AI synthetic data. Built as public infrastructure through an NIA project, this dataset laid the foundation for the Pebblous defense synthetic data series that continued with PBLS_Military and PBLS_Drone.
The high score of 88 stems from EO/IR dual sensors, complete 7-dimensional condition encoding, and the large-scale composition of 149,447 images. The variable resolution integrity issue and the need for IR low-density region augmentation are improvements to be addressed in the next version.
For AI to catch shadows crossing the night sea, diverse training data across many conditions is required. This dataset is the first attempt at that goal, and Pebblous' defense synthetic data journey continues today.
Key Summary Card
Original DataClinic Report: dataclinic.ai/en/report/124 · Not for commercial use · NIA project data