Executive Summary
This post presents key insights from Pebblous DataClinic's Quality Diagnosis Report #116 for the BIRDS 525 SPECIES dataset, along with a comparative analysis against the predecessor Birds 450.
BIRDS 525 is a large-scale bird classification dataset comprising 525 species and 89,880 images. The DataClinic comprehensive diagnosis yielded a quality score of 77 (Fair). This is 12 points higher than Birds 450 (quality score 65) — a result of multiple factors: ① preserving original resolutions (L1 improvement), ② expanded feature space coverage from 75 additional species (L2/L3 improvement), and ③ doubled L3 analysis precision (41→81 dimensions).
In L1 (Basic Quality) analysis, while Birds 450 had all images uniformly preprocessed to 224px, Birds 525 preserves original resolutions from 45px to 4,763px. The general-purpose AI lens (L2, Feature Space Analysis) revealed two clusters, and L2 density comparison shows Birds 525 is distributed across a broader feature space than 450. The domain-specific lens (L3, Domain-Specific Analysis) maintains a stable bell-shaped distribution in the 81-dimensional space.
The most "typical" bird was the PEACOCK, while the most atypical were EMU and BIRD OF PARADISE. Note that commercial use is not permitted, so caution is needed for purposes beyond research and education.
Birds 450 vs Birds 525 — What Changed
| Metric | Birds 450 (#11) | Birds 525 (#116) | Change |
|---|---|---|---|
| Overall Score | Quality score 65 (Fair) | Quality score 77 (Fair) | +12 pts ↑ |
| Classes | 450 species | 525 species | +75 species ↑ |
| Total Images | 75,100 | 89,880 | +14,780 ↑ |
| Avg per Class | 150.6 | 161.2 | +10.6 ↑ |
| Class Balance Std Dev | 15.7 | 20.6 | -4.9 ↓ |
| Min Resolution | 170×196px | 45×109px | Smaller |
| Max Resolution | 224×224px | 4,763×3,421px | Much more diverse ↑ |
| L1 Statistics Grade | Poor | Good | Major improvement ↑ |
| L2 Analysis Lens | BLIP (Multimodal) | Wolfram ImageIdentify Net V2 | Lens changed |
| L3 Dimensions | 41 dimensions | 81 dimensions | 2x more precise ↑ |
| Commercial Use | Allowed ✓ | Not allowed ✗ | ⚠️ Caution |
🔑 The Key to Score Improvement: Multiple Factors
The 12-point improvement is the result of multiple improvements working in combination, not a single factor:
① Preserving Original Data (L1 contribution) — Birds 450 preprocessed all images to 224×224px, destroying the natural pixel-level statistical diversity created by different shooting conditions — camera type, distance, lighting, and background. Birds 525 preserves original resolutions from 45px thumbnails to 4,763px professional photographs, dramatically improving the L1 statistics grade from "Poor" to "Good."
② Expanded Class Diversity (L2/L3 contribution) — With 75 additional species, the coverage of the feature space expanded. Newly included species (SNOWY SHEATHBILL, OILBIRD, JACOBIN PIGEON, etc.) are rare species and regional endemics with visual characteristics absent from the original 450. These fill previously empty regions of the feature space, improving the overall distribution balance.
③ More Precise L3 Analysis (41→81 dimensions) — Birds 525's domain-specific lens uses 81 dimensions, twice that of Birds 450. Higher dimensionality captures finer visual differences between species, improving class separability in the embedding space.
⚠️ Important: Commercial Use Not Permitted
While Birds 450 permits commercial use, Birds 525 does not allow commercial use. It can only be used for research and educational purposes. For actual services or products, you should use Birds 450 or another dataset with appropriate licensing.
Dataset Overview — The World of 525 Bird Species
BIRDS 525 SPECIES IMAGE CLASSIFICATION is a large-scale multi-class classification dataset published on Kaggle, consisting of 89,880 images across 525 bird species worldwide. From the familiar Jacobin Pigeon to the spectacular Bird of Paradise, the flightless EMU, and the nocturnal Oilbird, it captures a cross-section of avian diversity on Earth.
The 75 newly added species in Birds 525 are rarer species, regional endemics, or species that are visually difficult to distinguish — all absent from Birds 450. These include SNOWY SHEATHBILL, OILBIRD, JACOBIN PIGEON, and others.
Another key difference from Birds 450 is the diversity of image sources. While Birds 450 used uniformly preprocessed resolutions, Birds 525 includes wildlife photographs, field guide images, and professional bird photography at their original resolutions. This creates data conditions closer to real-world deployment (in-the-wild).
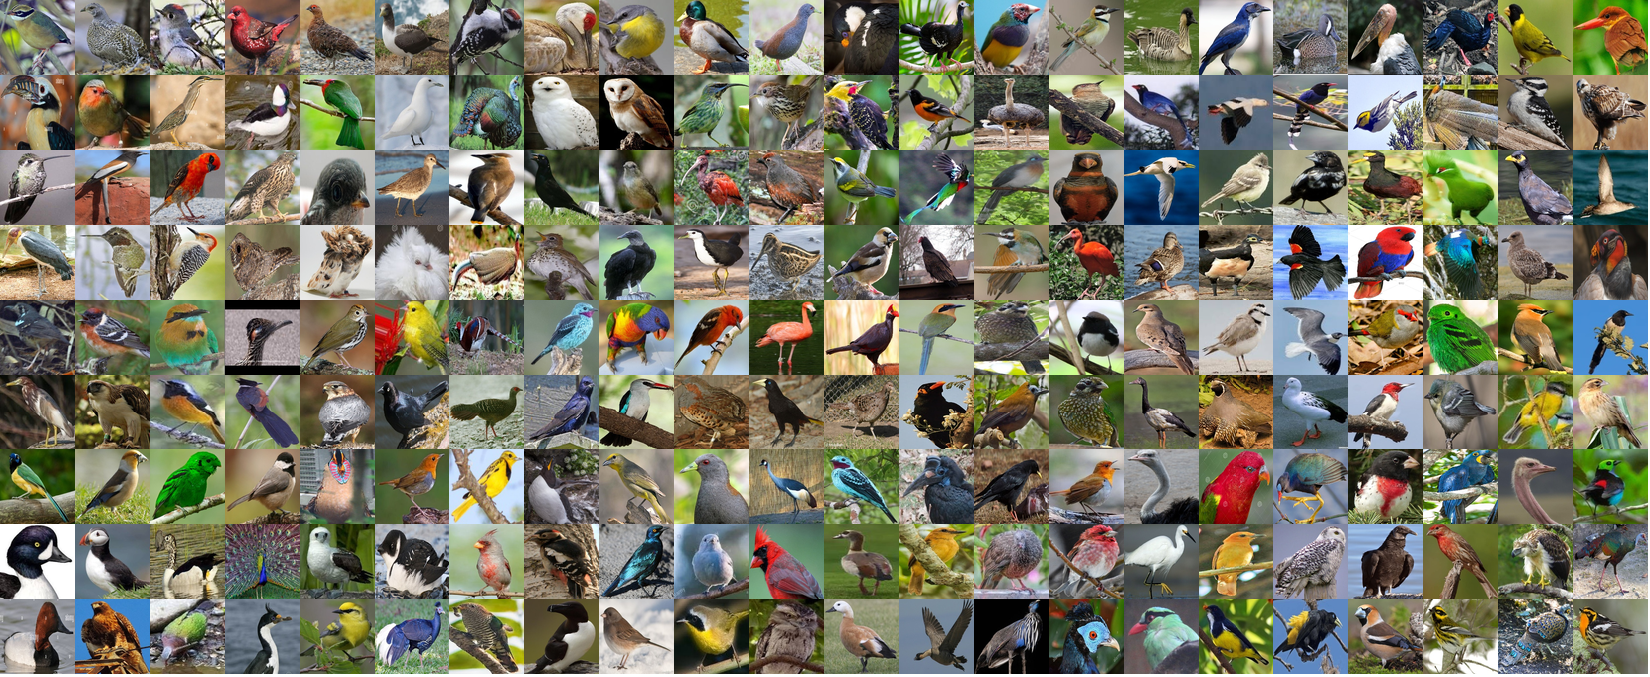
Birds 525 Dataset — Representative image collage of 525 bird species (DataClinic L1 analysis)

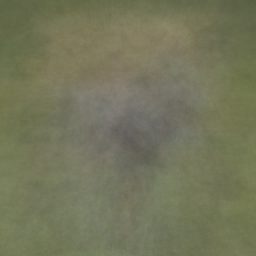
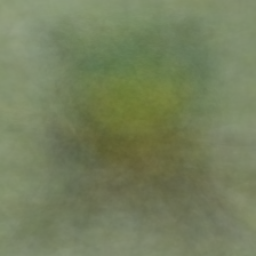
▲ Class mean images — pixel-wise average of 161 images per class. Sharper images indicate higher visual consistency within the class.
Level 1: Basic Quality Check — The Decisive Difference from 450
Level 1 examines image integrity, missing values, class balance, and pixel statistics. This stage reveals the core reason why Birds 525 significantly outperforms Birds 450.
✅ Missing Values: None
No missing values were found across all 89,880 images. This is on par with Birds 450's equally clean record.
✅ Channel Composition: Consistent RGB Throughout
All 89,880 images across 525 classes share identical RGB channel composition. With no grayscale images or alpha channel contamination, preprocessing overhead is minimized.
✅ Class Balance: Good
The number of images per class ranges from a minimum of 130 to a maximum of 263, with a mean of 161.2 and standard deviation of 20.6. While the deviation is slightly higher than Birds 450 (mean 150.6, std dev 15.7), the bias risk remains low for large-scale multi-class classification tasks.
🌟 Image Resolution: The Decisive Difference from Birds 450
The most distinctive feature of Birds 525 is its resolution diversity:
- Minimum: 45×109px (very small thumbnails)
- Maximum: 4,763×3,421px (high-resolution professional photographs)
In contrast, Birds 450 had a minimum of 170×196px and a maximum of 224×224px, with nearly all images uniformly preprocessed.
💡 Why Does Preserving Original Resolution Matter?
Level 2: The Bird World Through a General-Purpose AI Lens
Level 2 extracts features from all images using Wolfram ImageIdentify Net V2 (1,280 dimensions). Unlike Birds 450, which used BLIP (a multimodal language-image model) for L2, Birds 525 employs a pure vision model to analyze distributions based solely on visual features.
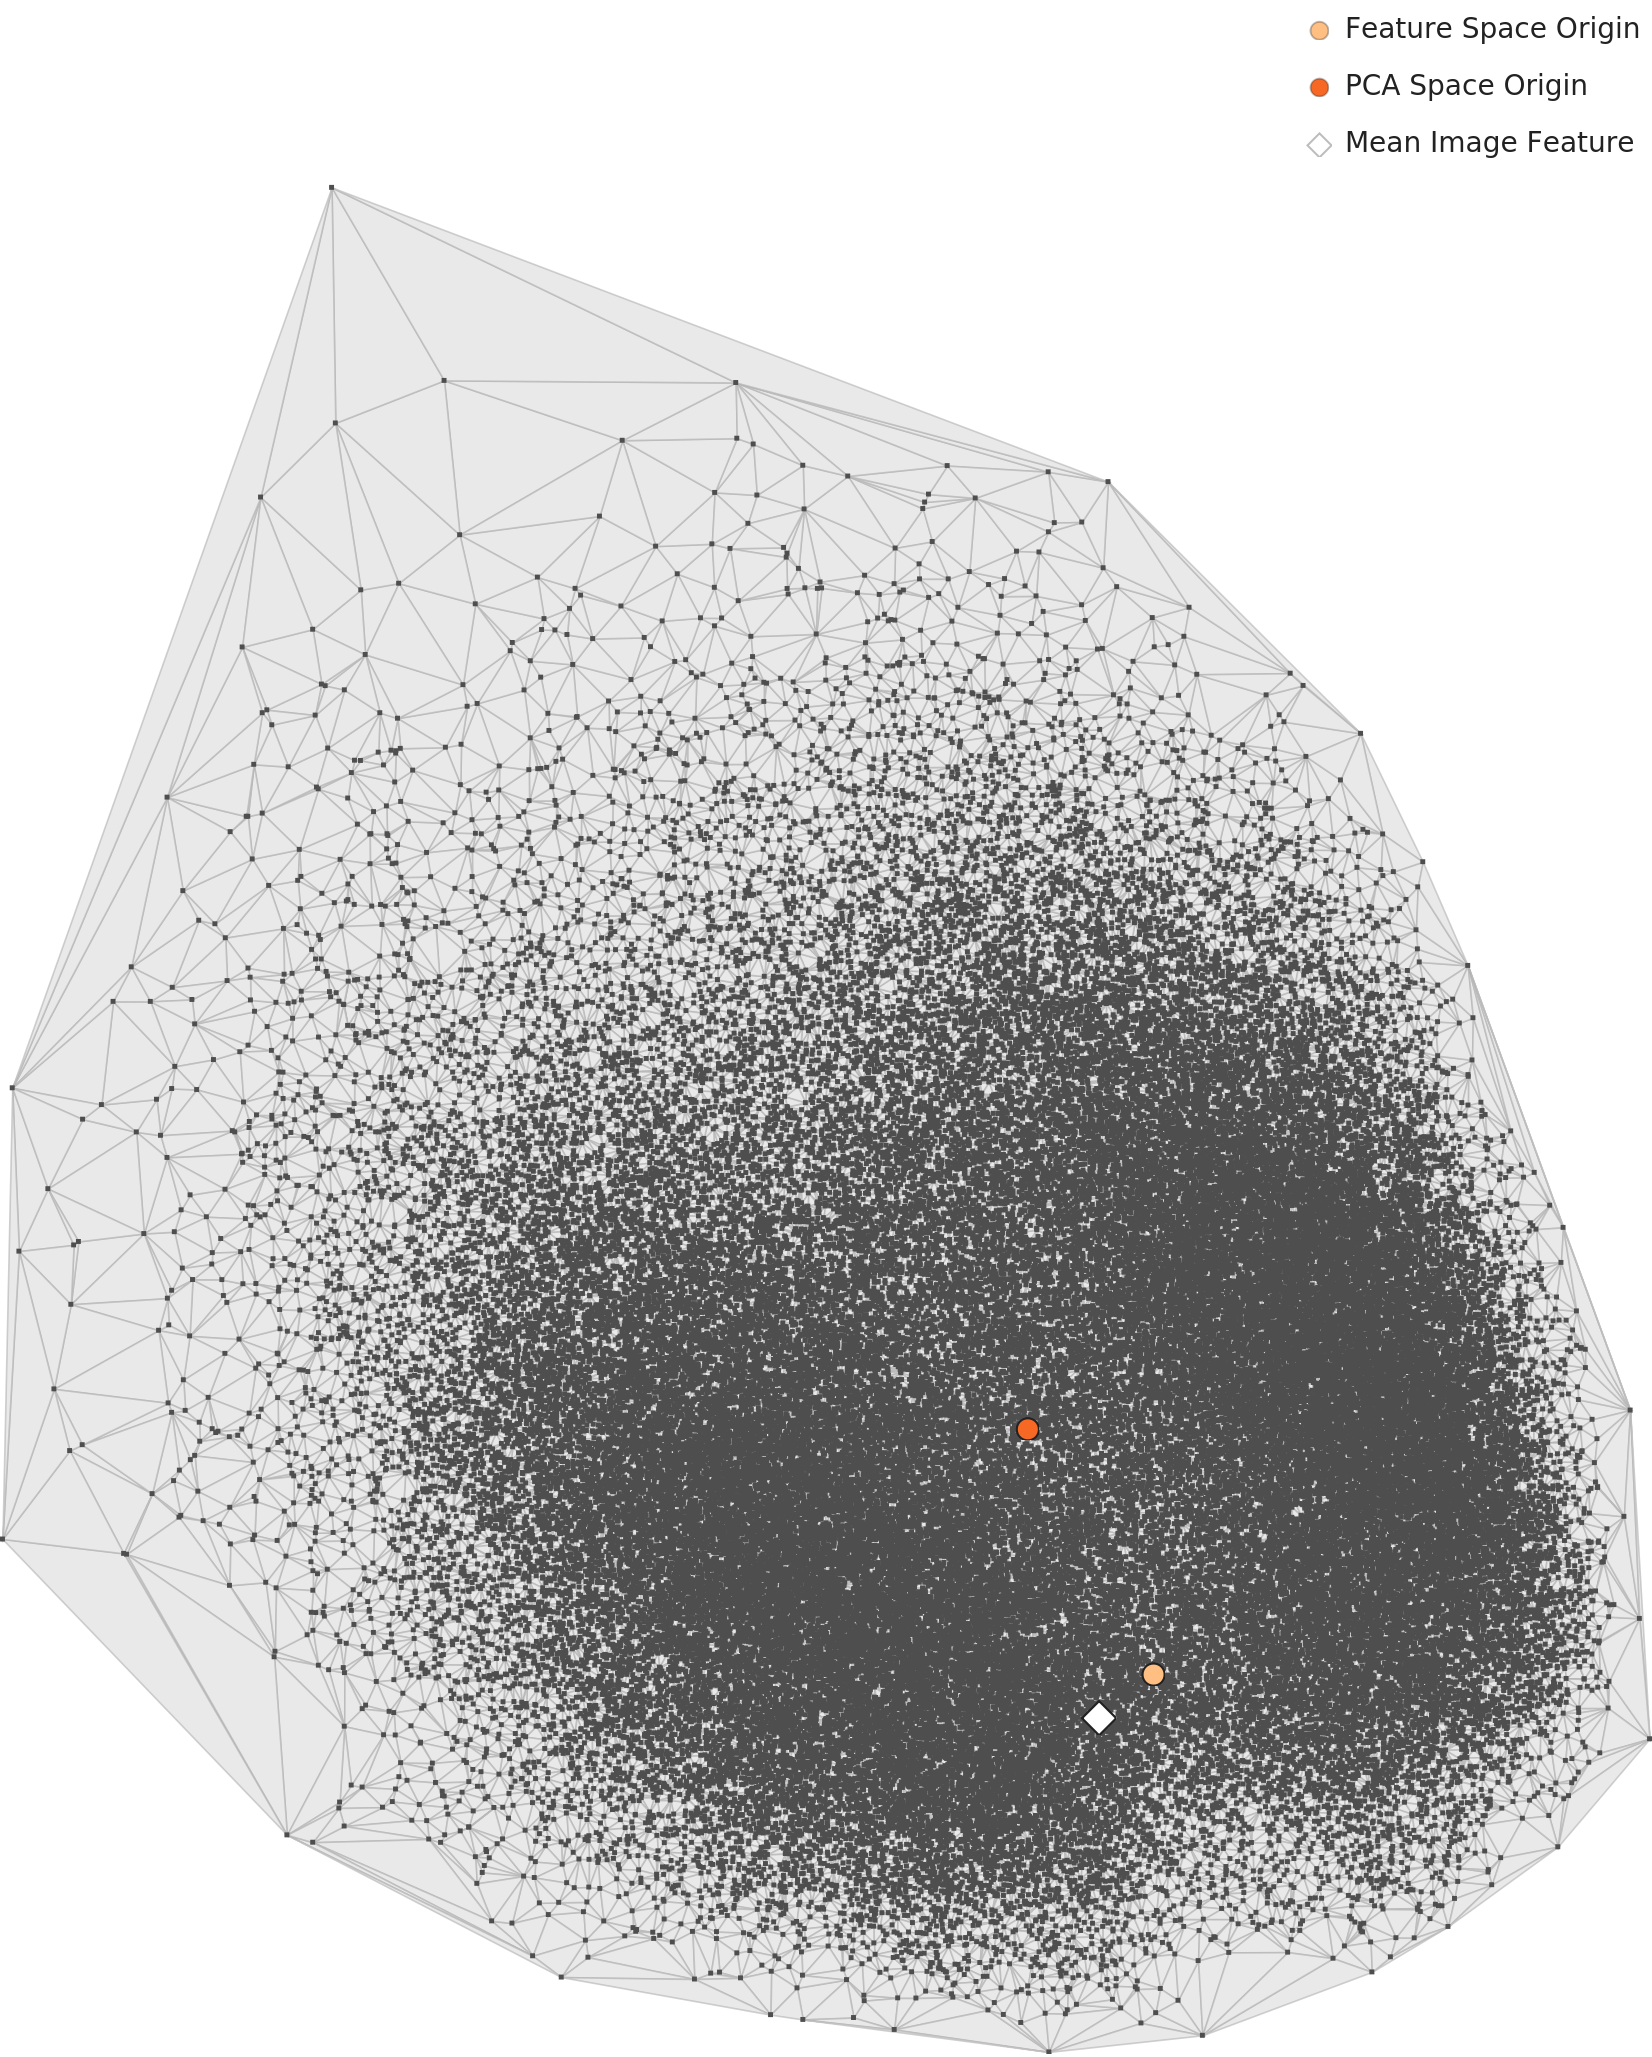
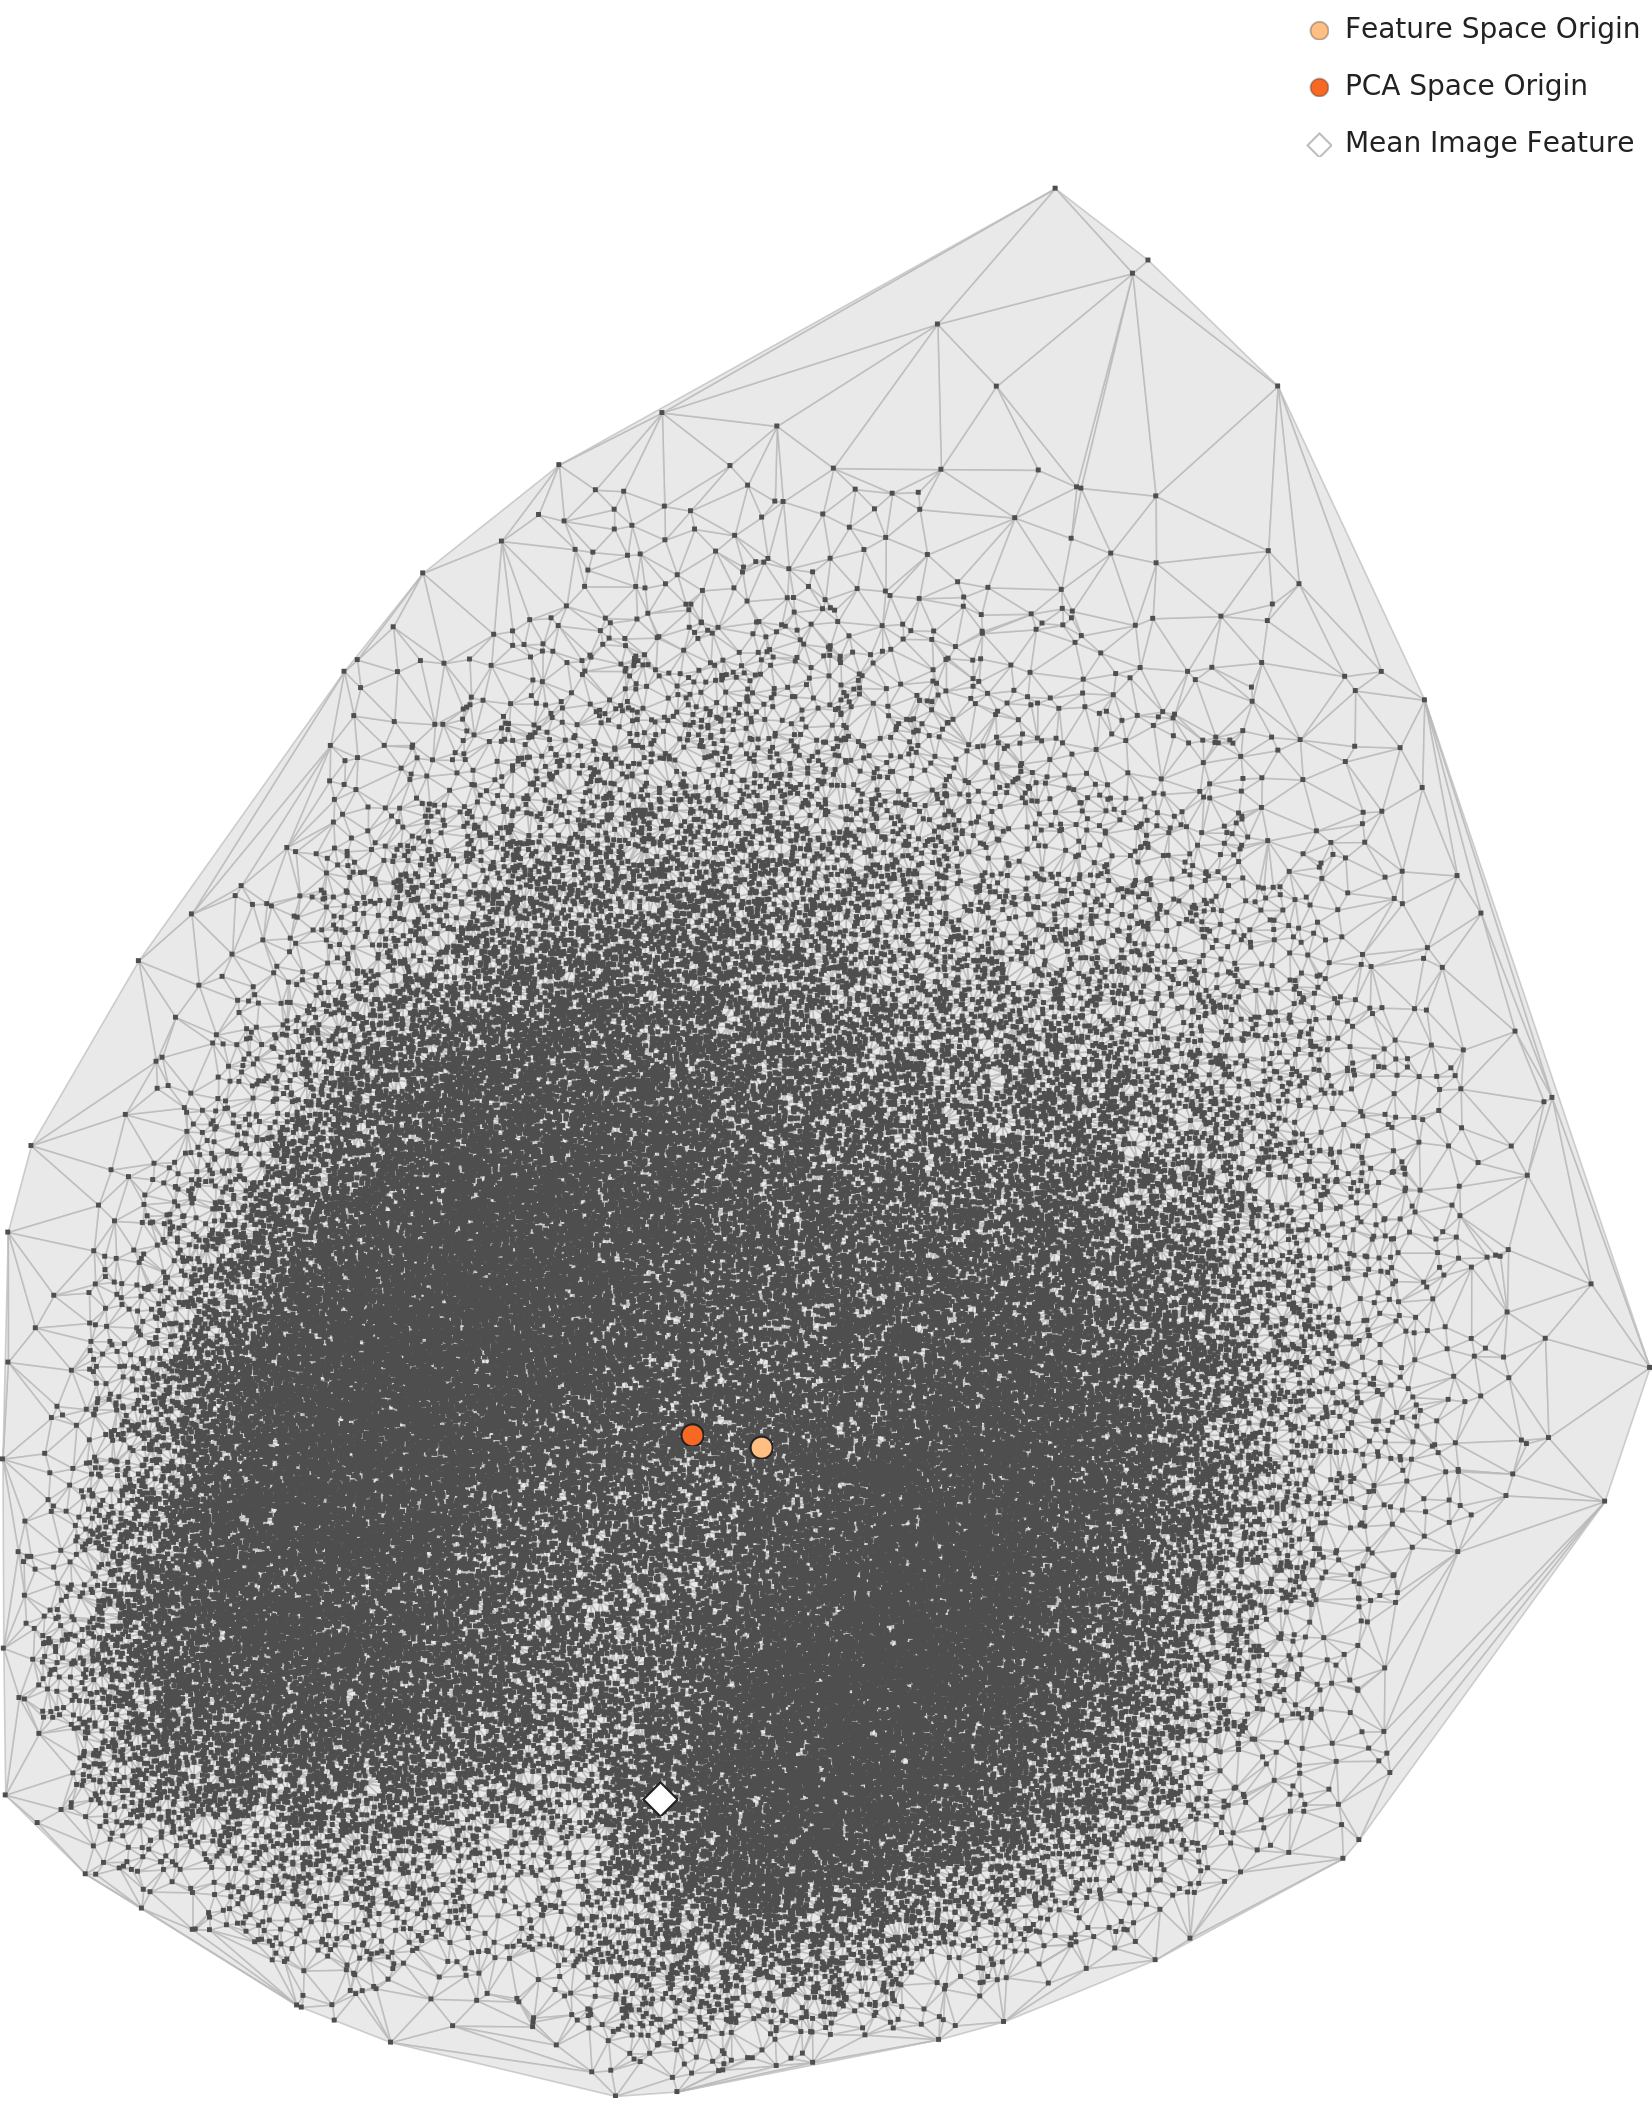
🔵 Two High-Density Clusters
PCA and density topography analysis reveal two high-density clusters. Interpreting these with domain knowledge:
- Cluster A — Tropical and subtropical birds with vivid colors and distinctive forms. Visually striking species such as Peacock, Bird of Paradise, Emerald Cuckoo, and Crowned Crane
- Cluster B — Brown and gray forest/grassland birds. Passeriformes (perching birds) with relatively similar appearances
This two-cluster structure was similarly observed in Birds 450. General-purpose AI models tend to first classify birds by the strongest visual signal: "colorful birds vs. plain birds."
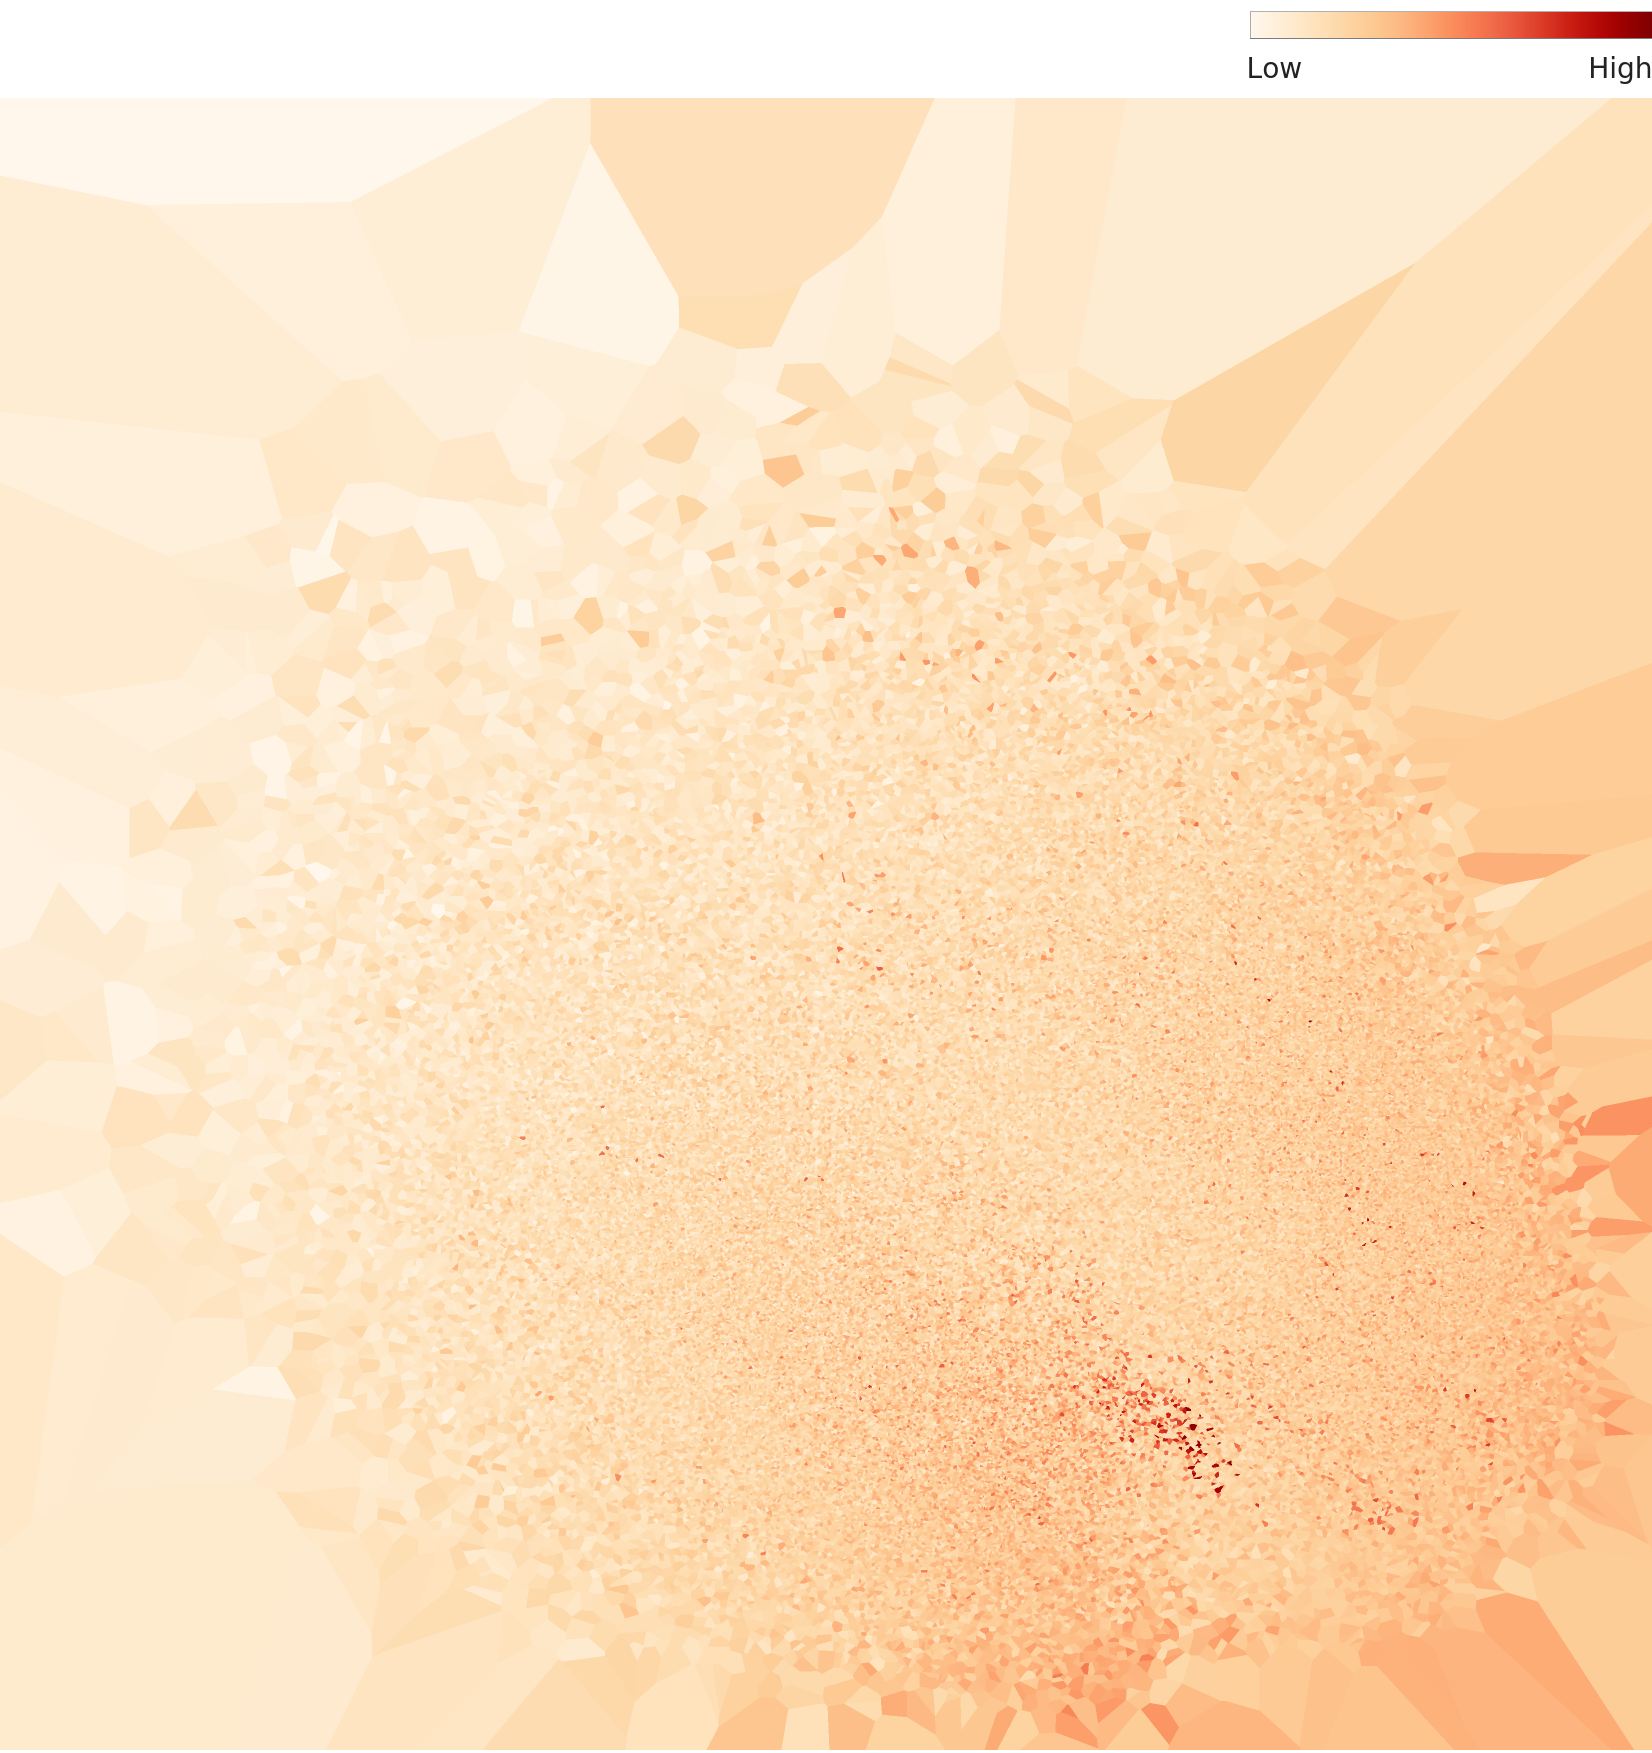
📊 Density Distribution Comparison: Birds 450 vs. 525
Comparing the L2 density distributions side by side reveals structural differences between the two datasets. Birds 450 (left) shows a peak density of 4.26 (COMMON POORWILL) with a narrow, concentrated range, while Birds 525 (right) shows a peak density of 0.34 (PEACOCK) with a broader, more dispersed range.
This difference indicates that the feature space expanded with the addition of 75 species. The lower density is not a negative signal — it is a positive sign that more species occupy the feature space more evenly.

Birds 450 L2 density · peak 4.26 · narrow distribution
Birds 525 L2 density · peak 0.34 · broad distribution
🔬 Per-Class Density Comparison: Crowned Crane vs. Firefinch

AFRICAN CROWNED CRANE — features concentrated due to distinctive crown shape

AFRICAN FIREFINCH — broad distribution typical of small passerines
Level 3: Bird-Specific Lens — More Precise with 81 Dimensions
Level 3 applies a domain-specific lens optimized to 81 dimensions based on Wolfram ImageIdentify Net V2, tailored for the Birds 525 dataset. Compared to Birds 450's L3 at 41 dimensions, Birds 525 uses a representation space that is 2x more precise.
🔵 Cluster Structure Preserved
The domain-specific lens (L3) maintains a two-cluster structure similar to L2. This demonstrates that the visual dichotomy of "colorful birds vs. plain birds" remains a core distinguishing criterion even in domain-specific models.
This contrasts with the Korean Food dataset (2 clusters in L2 → merged into 1 cluster in L3). With Korean food, the domain-specific lens highlights the commonality of "all being Korean food," whereas for birds, distinguishing between colorful and plain species remains visually meaningful even to domain experts.
📈 Density Distribution Comparison: 450 vs. 525 at L3
The L3 density comparison shows a similar pattern to L2. Birds 450 (left, 41 dimensions) has a concentrated density distribution, while Birds 525 (right, 81 dimensions) is more broadly spread.
Notably, the bell-shaped distribution remains stable despite the dimensionality doubling (41→81). This indicates that the structural integrity of the data is preserved even in the 81-dimensional space. However, embedding boundaries between some classes are not fully separated, earning a "Fair" consistency rating.

Birds 450 L3 density · 41 dimensions · narrow distribution

Birds 525 L3 density · 81 dimensions · broad distribution
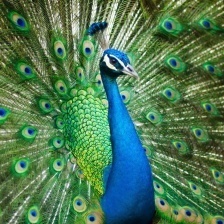
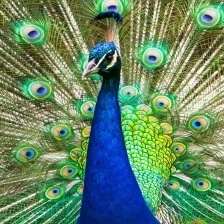
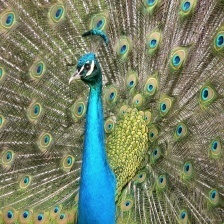
Outlier Analysis — Why the Peacock Is the Most "Typical" Bird
🏆 High-Density Samples — The "Typical Birds" as Seen by AI
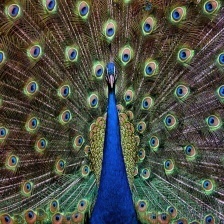
The PEACOCK overwhelmingly dominates the top high-density samples, with densities of 0.33-0.34. This contrasts with Birds 450, where COMMON POORWILL recorded the highest density.
Ironically, the Peacock is the most typical precisely because it is the most flamboyant:
- Distinctive yet consistent visual pattern — The male's fan-shaped tail feathers are highly distinctive, yet Peacock photographs are remarkably similar to each other
- Color vividness — The blue-green iridescent body and eye-patterned tail are visual patterns that AI models recognize strongly
- Compositional consistency — Front-facing photographs with spread tails are overwhelmingly common, resulting in low feature vector variance
⚠️ Low-Density Outliers — Birds That Break the Mold
Low-density outliers include species that look dramatically different from "typical birds":
- SNOWY SHEATHBILL (0.0529) — Nearly all-white with a sharp beak. Frequently photographed against snowy backgrounds, placing it at an extreme position in feature space
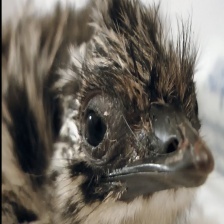
- EMU (0.0532) — A large flightless bird. Its long neck and massive body create a silhouette entirely unlike typical birds
- BIRD OF PARADISE (0.0541) — Males have extremely ornate and bizarre plumage. As flamboyant as Peacocks but with far more varied photography compositions
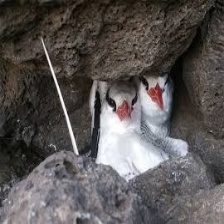
- RED BILLED TROPICBIRD (0.0545) — Distinctive long tail feathers and white body, with many in-flight capture photographs


↔️ Most Different Pair: OILBIRD vs. JACOBIN PIGEON
The most distant pair in feature space is OILBIRD and JACOBIN PIGEON. The Oilbird is a cave-dwelling nocturnal bird with a sharp beak and dark brown body, while the Jacobin Pigeon is an ornamentally bred pigeon with white plumage and a distinctive head crest. They are polar opposites in color, form, and habitat.

OILBIRD
(Cave-dwelling, nocturnal)

JACOBIN PIGEON
(Ornamental pigeon)
▲ The most distant pair in feature space. Polar opposites in color, form, and habitat.
Improvement Suggestions — Data Diet + Bulk-up Combined
DataClinic recommends combining Data Diet (duplicate removal) and Data Bulk-up (data augmentation) for this dataset. A quality score of 77 is a solid starting point, and applying both prescriptions together could push the score into the 85-90 range.
🥗 Data Diet — Cleaning Up Peacock Class Duplicates
The PEACOCK class is a classic Data Diet candidate with clustered high-density outliers. If front-facing spread-tail photographs are excessively repetitive, replacing them with varied angles, behaviors, and non-tail photographs would improve model robustness.
💉 Data Bulk-up — Reinforcing Outlier Classes
Classes that appeared as low-density outliers need data augmentation:
- EMU — Add images from diverse shooting angles (side, front, group) and varied environments (grassland, farm)
- BIRD OF PARADISE — Add various male courtship display scenes and female images to increase intra-class diversity
- SNOWY SHEATHBILL — Add non-snowy environment photographs to reduce background bias
🎯 Key Takeaways
✅ Overall quality score: 77 (+12 over Birds 450, multiple factors)
✅ L1 statistics: Good (original resolution preserved) / L2·L3: broad feature space distribution
✅ Missing values: None / Channels: All RGB / L3 81 dimensions (2x more precise)
⚠️ Minimum resolution 45px — preprocessing standardization needed
⚠️ Commercial use not permitted — research and education only
📈 Data Diet + Bulk-up could target 85-90 score range
The full diagnosis results and detailed per-class analysis for all 525 classes are available at DataClinic Report #116.