2026.03 · Pebblous Data Communication Team
Reading time: ~15 min · 한국어
Executive Summary
This report presents key insights from the quality diagnosis report of the WikiArt dataset using Pebblous DataClinic.
WikiArt is an art image dataset consisting of 81,471 images across 27 styles, from Abstract Expressionism to Baroque. The DataClinic overall diagnosis resulted in a quality score of 53 (Poor). Class imbalance is extreme, ranging from a minimum of 98 images to a maximum of 13,060 images — a difference of over 133x — which creates a high risk of training classifiers biased toward specific art styles.
The L2 (Feature Space Analysis) using Wolfram ImageIdentify Net V2 (1,280 dimensions) discovered 3 high-density clusters, but the boundaries between art styles are unclear and class separation is blurry. The L3 (Domain-Specific Analysis) using BLIP Image-Text Matching (56 dimensions) also showed difficulty in cluster separation, though the overall distribution shape was satisfactory.
To improve data quality, both minority class augmentation (bulk-up) and majority class deduplication (diet) are needed simultaneously. In particular, label consistency review should be prioritized due to the visual similarity among abstract art styles.
Dataset Overview
WikiArt is a large-scale image dataset spanning centuries of Western art history. Published on Kaggle, this dataset is widely used in computer vision and art style classification research. It comprises 81,471 images across 27 art styles, covering major art movements including Impressionism, Baroque, and Abstract Expressionism.
| Item | Details |
|---|---|
| Dataset Name | WikiArt |
| Source | Kaggle (WikiArt) |
| Total Images | 81,471 |
| Number of Classes | 27 Art Styles |
| Overall Score | 53 (Poor) |
| Report Date | 2025.01.01 |
The 27 art style classes include Abstract_Expressionism, Action_painting, Analytical_Cubism, Art_Nouveau, Baroque, Color_Field_Painting, Cubism, Early_Renaissance, Expressionism, Fauvism, High_Renaissance, Impressionism, Mannerism_Late_Renaissance, Minimalism, Naive_Art_Primitivism, New_Realism, Northern_Renaissance, Pointillism, Pop_Art, Post_Impressionism, Realism, Rococo, Romanticism, Symbolism, Synthetic_Cubism, and Ukiyo_e. This dataset addresses the inherently challenging task of art style classification, and its difficulty further complicates data quality issues.
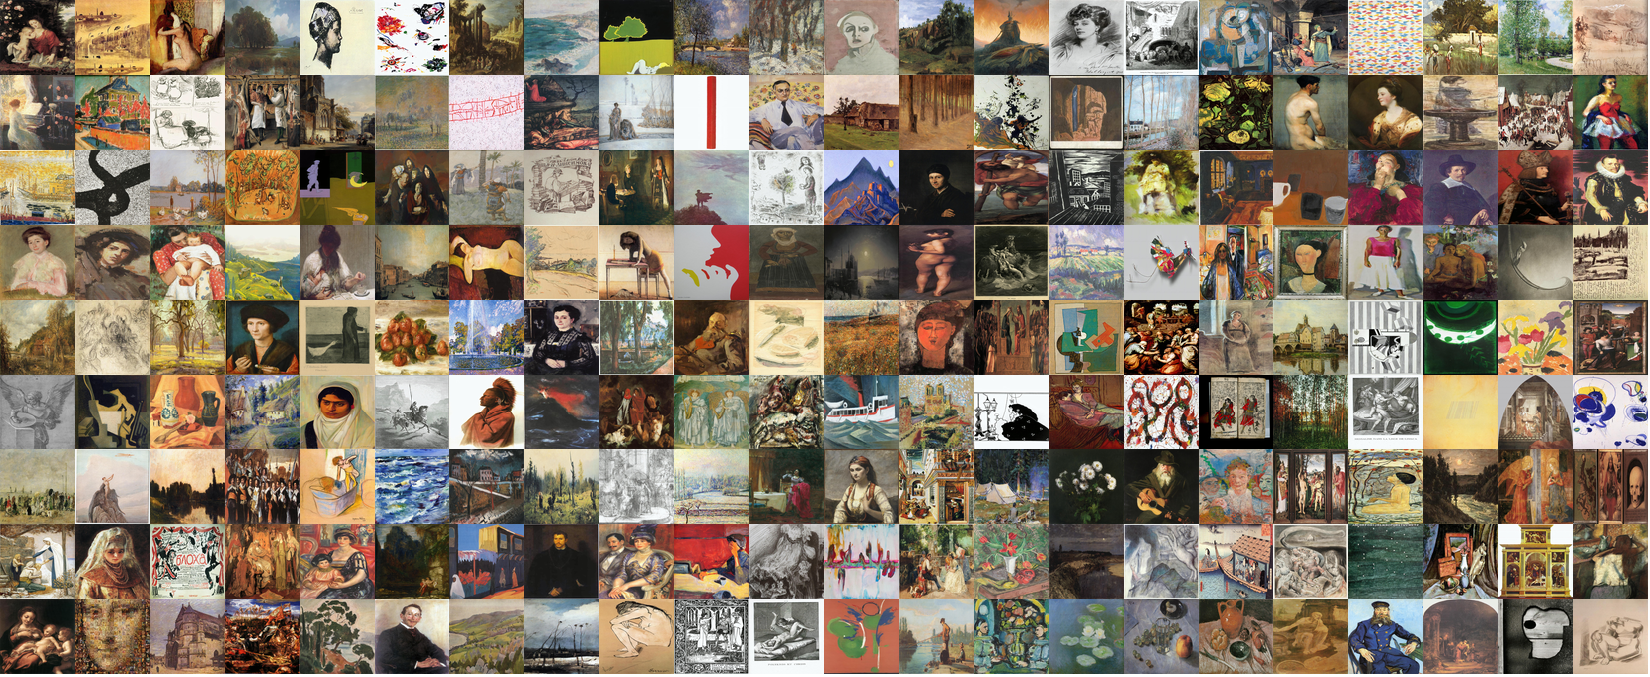
WikiArt Dataset — Collage of Representative Images from 27 Art Styles (DataClinic L1 (Basic Quality) Analysis)
Overall Diagnosis: 53 (Poor)
The DataClinic overall score for the WikiArt dataset is 53 (Poor). This means the dataset urgently requires quality improvement before it can be directly used for AI model training. The primary reason for the score of 53 is one single factor: extreme class imbalance.
In art history, mainstream styles like Impressionism and Romanticism have vast bodies of work, while niche movements like Analytical_Cubism and Action_painting inherently have fewer pieces. This real-world imbalance is directly reflected in the dataset. AI models become biased toward classes with more data, while minority classes are effectively ignored.
Level 1: Pixel Quality Analysis
Level 1 analyzes basic pixel-level statistics of images. DataClinic computes the mean image for each class and examines RGB channel brightness distributions, missing values, and class imbalance.
RGB Channel Consistency: Good
Pixel-level RGB channel consistency was rated as Good. Channel distributions are evenly balanced, and images with extremely dominant or deficient channels are rare. This indicates that while WikiArt encompasses diverse art styles and eras, the digitization quality has been maintained consistently overall.
Missing Values: None
No missing values were found across all 81,471 images. Every image contains valid pixel data, eliminating the need for any missing value handling during preprocessing.
Class Imbalance: Poor — The Core Issue
The most critical issue at Level 1 is class imbalance. DataClinic analysis revealed:
- Minimum class: 98 images (Analytical_Cubism, etc.)
- Maximum class: 13,060 images (Impressionism, etc.)
- Mean: 3,016 images
- Standard deviation: 3,269 (greater than the mean — extreme variance)
The min-max ratio reaches an astonishing 133:1. The fact that the standard deviation (3,269) exceeds the mean (3,016) clearly demonstrates how severely skewed the distribution is.
Below are the mean images for representative classes, revealing distinctly different visual characteristics for each art style:

Abstract Expressionism

Art Nouveau

Baroque
The mean images show that Abstract Expressionism exhibits abstract characteristics with mixed colors and textures, while Baroque displays dark backgrounds with strong chiaroscuro typical of classical painting. The fact that mean images are clearly distinguishable across styles indicates that some degree of inter-style differentiation exists at the pixel level.
Level 2: Feature Space Analysis (Wolfram ImageIdentify Net V2)
Level 2 uses Wolfram ImageIdentify Net V2 (1,280-dimensional feature vectors) to place images in a high-dimensional embedding space and analyze inter-class separability and density distributions. This is a general-purpose vision model not specialized for any particular domain, measuring "how differently a computer perceives images."
3 High-Density Clusters Discovered
Analysis of the PCA-reduced feature space revealed 3 high-density clusters. This means WikiArt's 27 art styles are broadly grouped into 3 visual types from a general vision model's perspective: classical painting styles (Baroque, Renaissance, etc.), modern abstract styles (Abstract Expressionism, Minimalism, etc.), and stylized art movements (Ukiyo_e, Art_Nouveau, etc.).
The PCA visualization below shows the distribution of mean features per class:
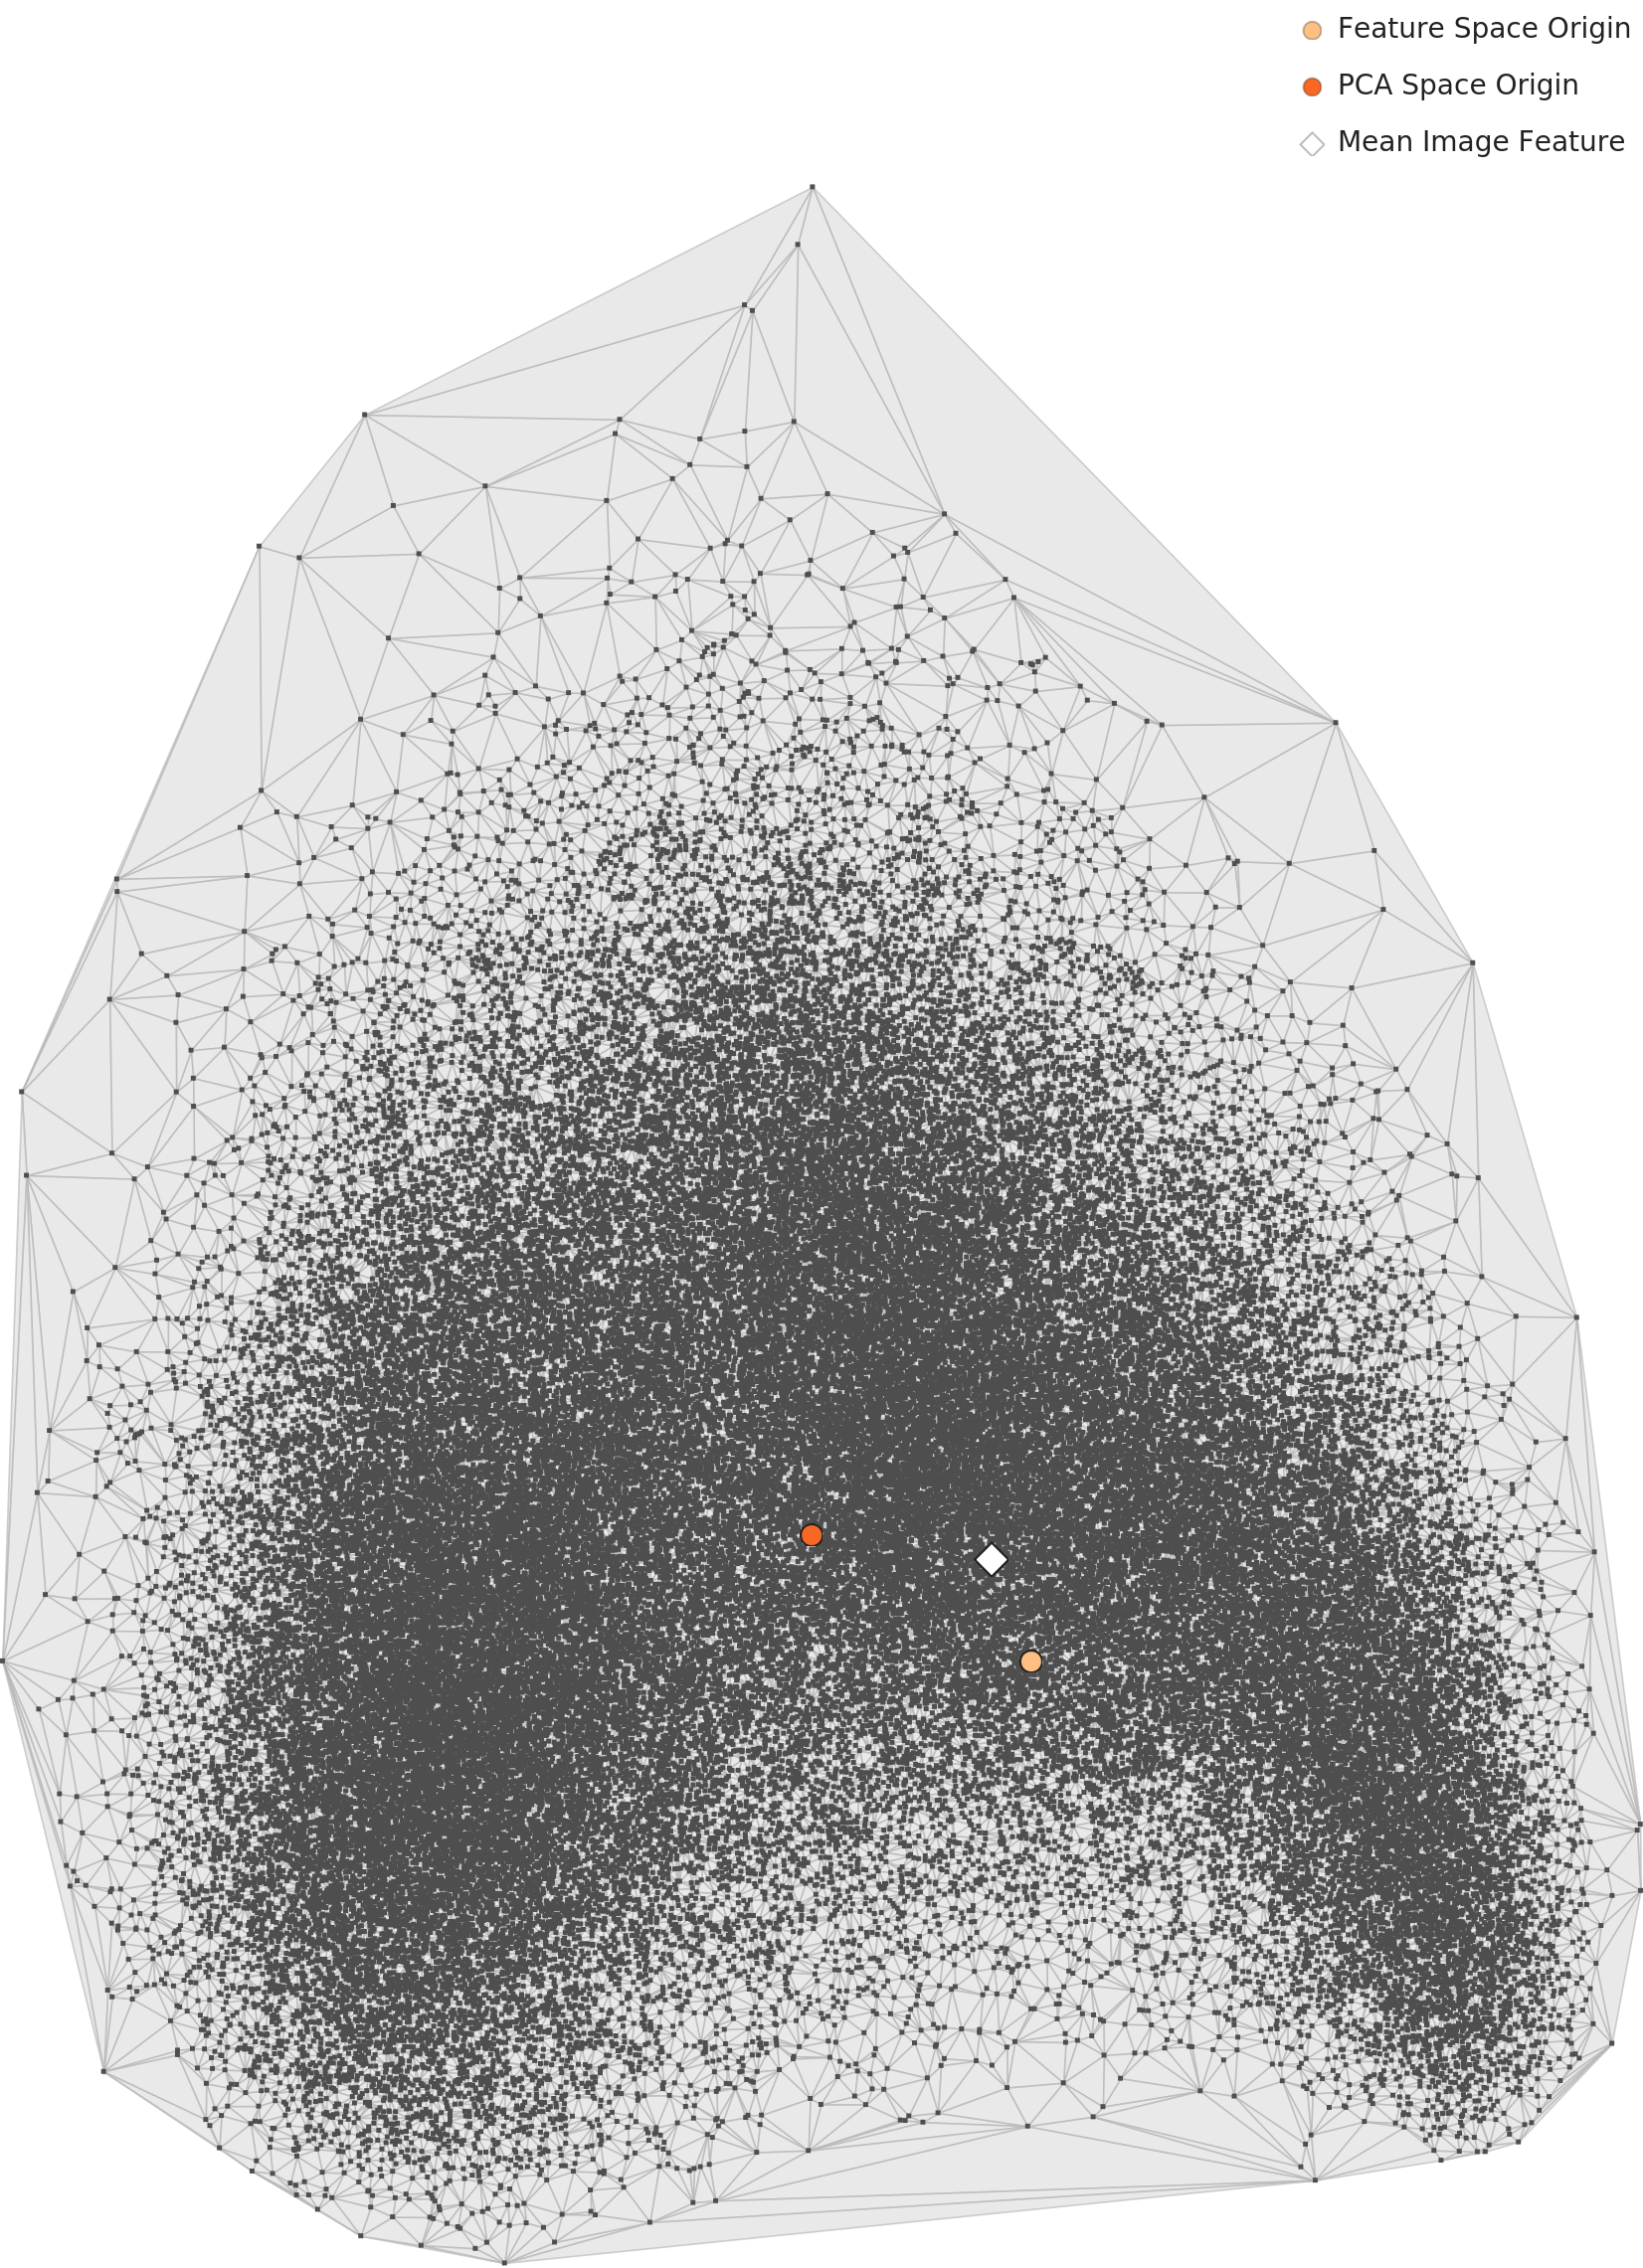
Unclear Boundaries Between Styles
However, the most important finding is that cluster boundaries are highly unclear. In particular, abstract art styles (Abstract_Expressionism, Action_painting, Color_Field_Painting, Minimalism) overlap significantly in the embedding space. From a computer vision model's perspective, these styles are difficult to distinguish. Art historically, these movements evolved in a continuous context, making this a somewhat expected result.
Distribution: Bell-shaped
The density distribution is bell-shaped, with most images concentrated in the center of the feature space and a small number of outliers at the extremes. This indicates a healthy data structure close to a normal distribution.

Level 3: Domain-Specific Analysis (BLIP Image-Text Matching)
Level 3 uses BLIP Image-Text Matching Nets (56-dimensional feature vectors). BLIP is a multimodal model trained on both images and text, measuring "in what artistic context an image is understood." The compressed 56-dimensional representation extracts only the core features specialized for the art domain.
Cluster Separation: Still Unclear
In the BLIP-based analysis, cluster separation between art styles remains unclear. Similar to L2, abstract art styles fail to separate in the text-image matching space. This suggests that the difficulty in distinguishing these styles is not merely due to visual similarity, but also because textual descriptions cannot clearly differentiate them.
The L3 PCA visualization shows the feature distribution by art style:
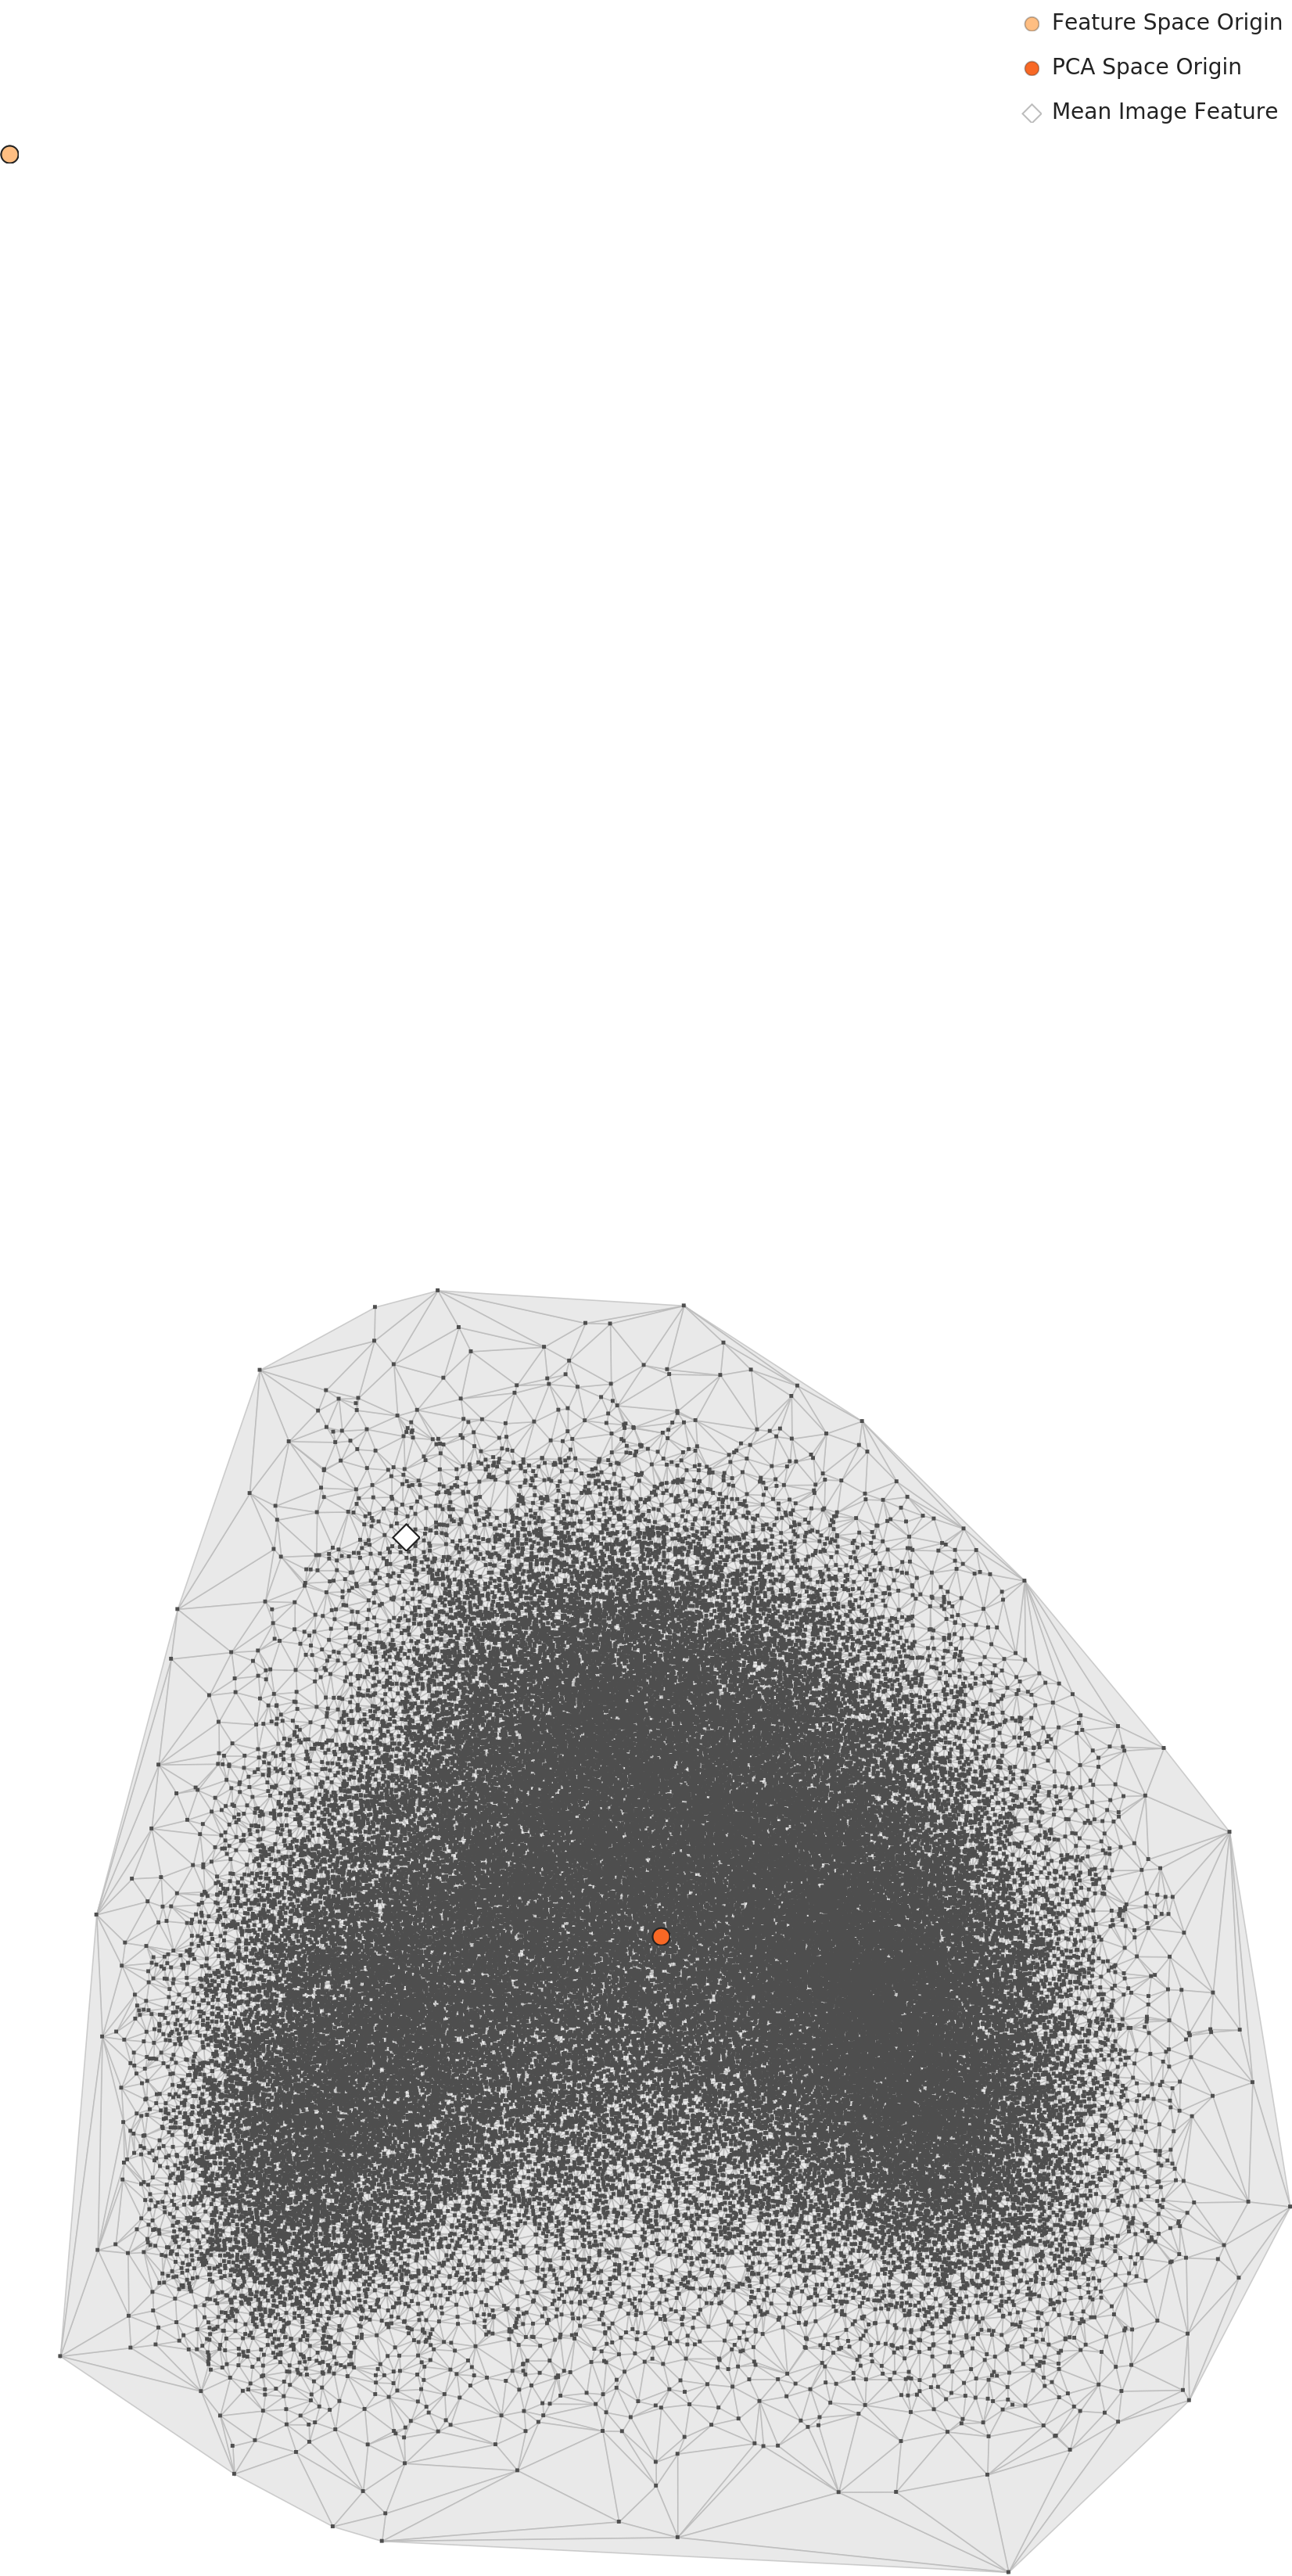
Geometry: Fair / Distribution: Good
In the L3 analysis, the Geometry metric was rated as Fair, while the Distribution was rated as Good. A good distribution indicates that overall data dispersion in the BLIP feature space is adequate. While L2 showed a bell-shaped distribution, L3 confirms a similar or more even distribution.
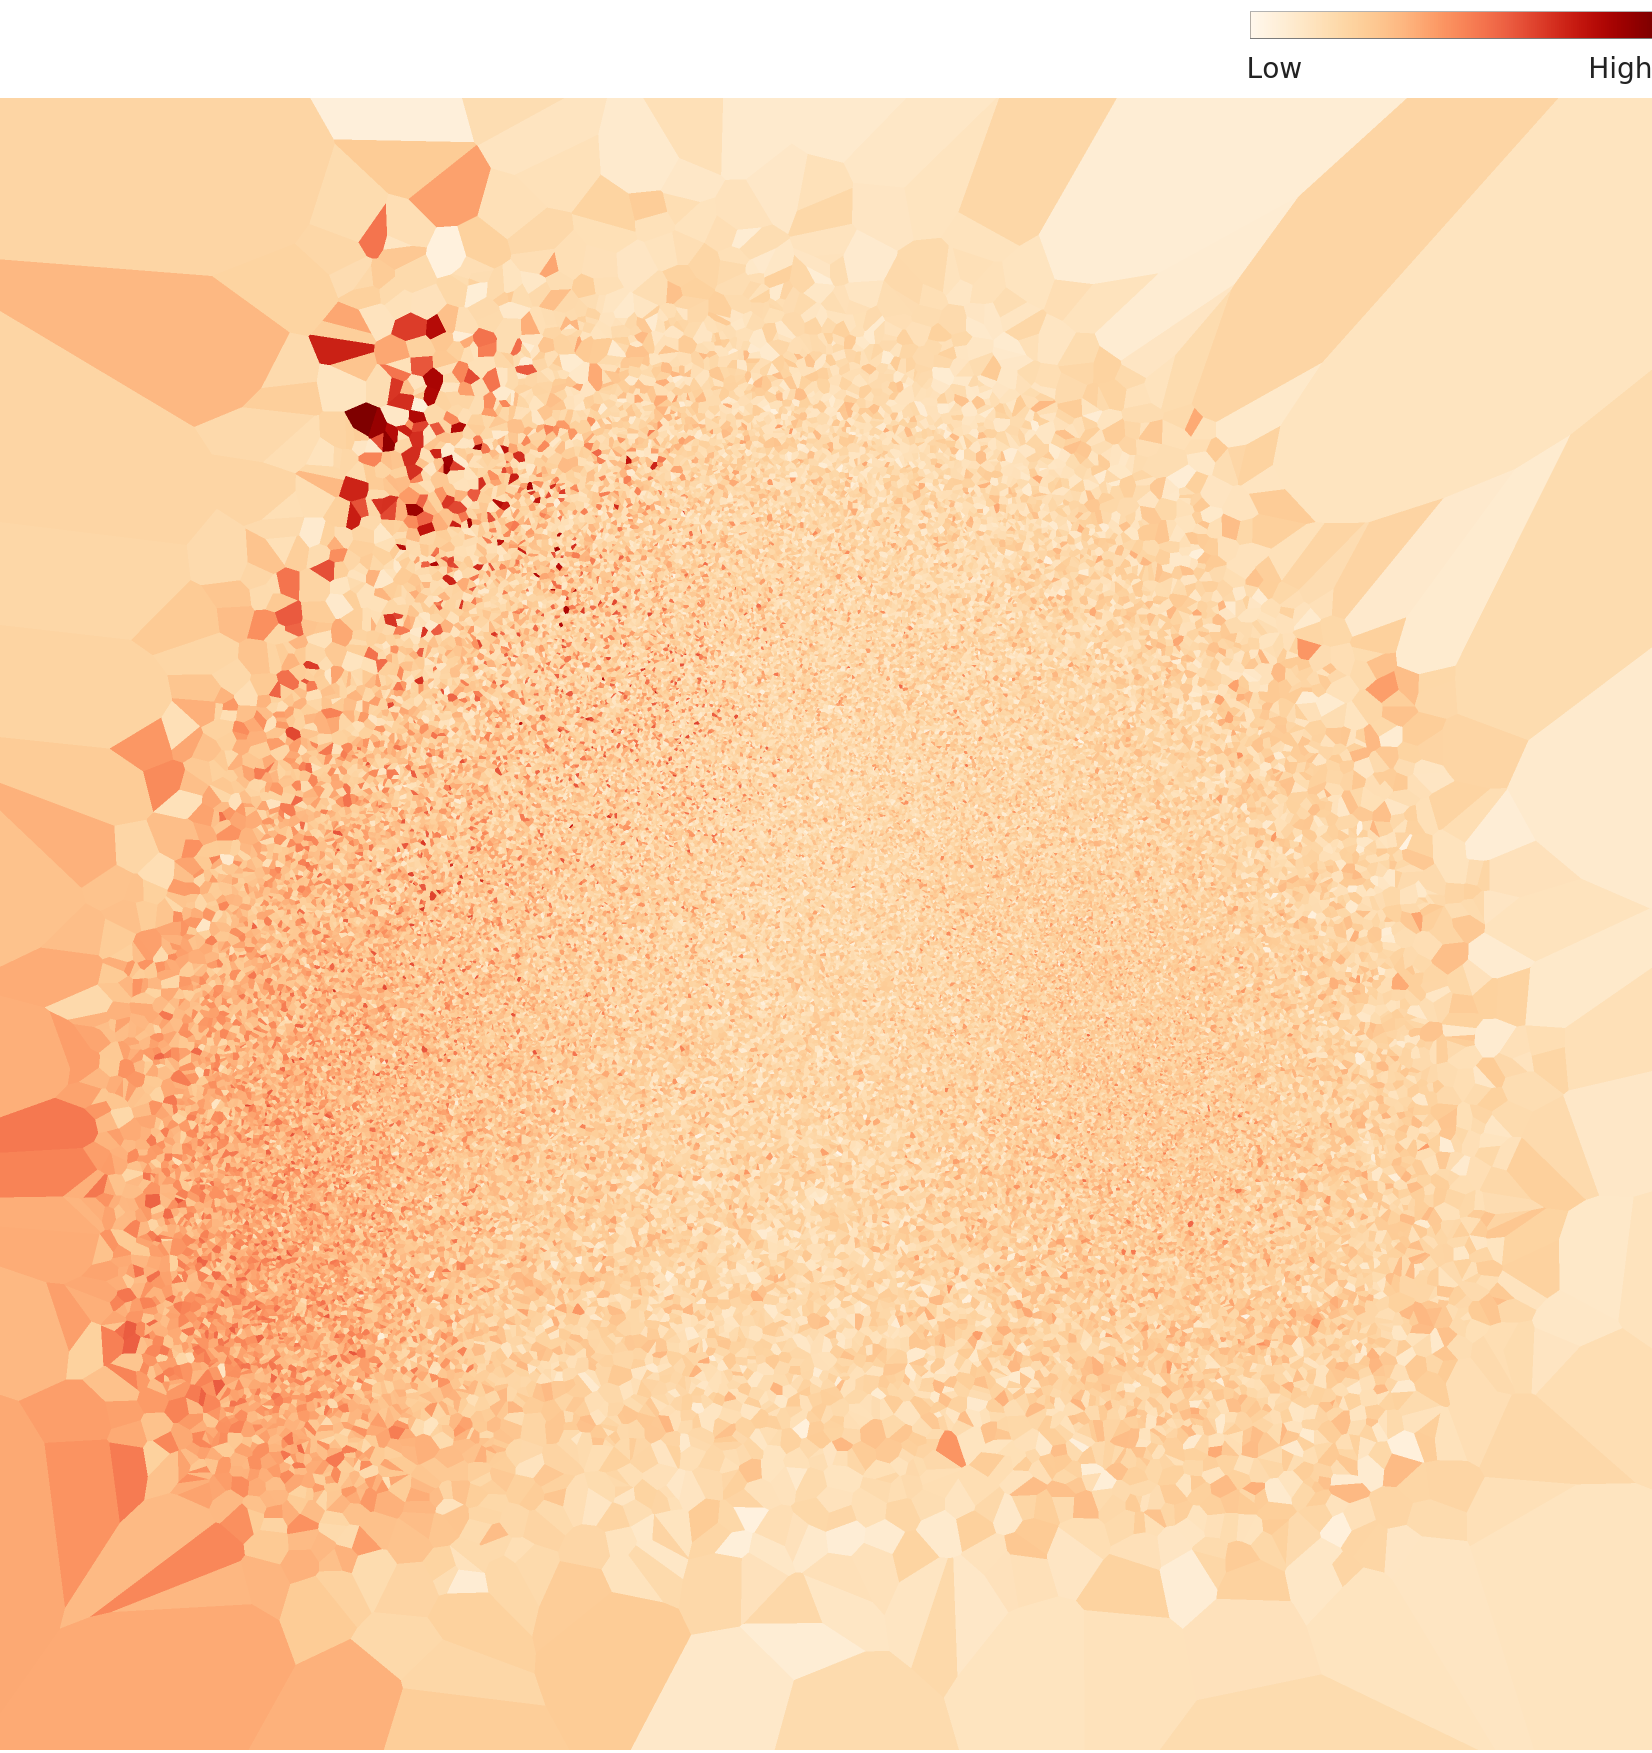
Outlier Analysis: High-Density vs. Low-Density Samples
DataClinic uses density-based outlier analysis to identify the most typical samples (high-density) and most atypical samples (low-density) in the dataset. Based on the L2 analysis, the following samples were identified.
High-Density Samples — Representative Images
High-density samples are images with the most "typical" characteristics in their class. These images form the core concept of each class during model training.
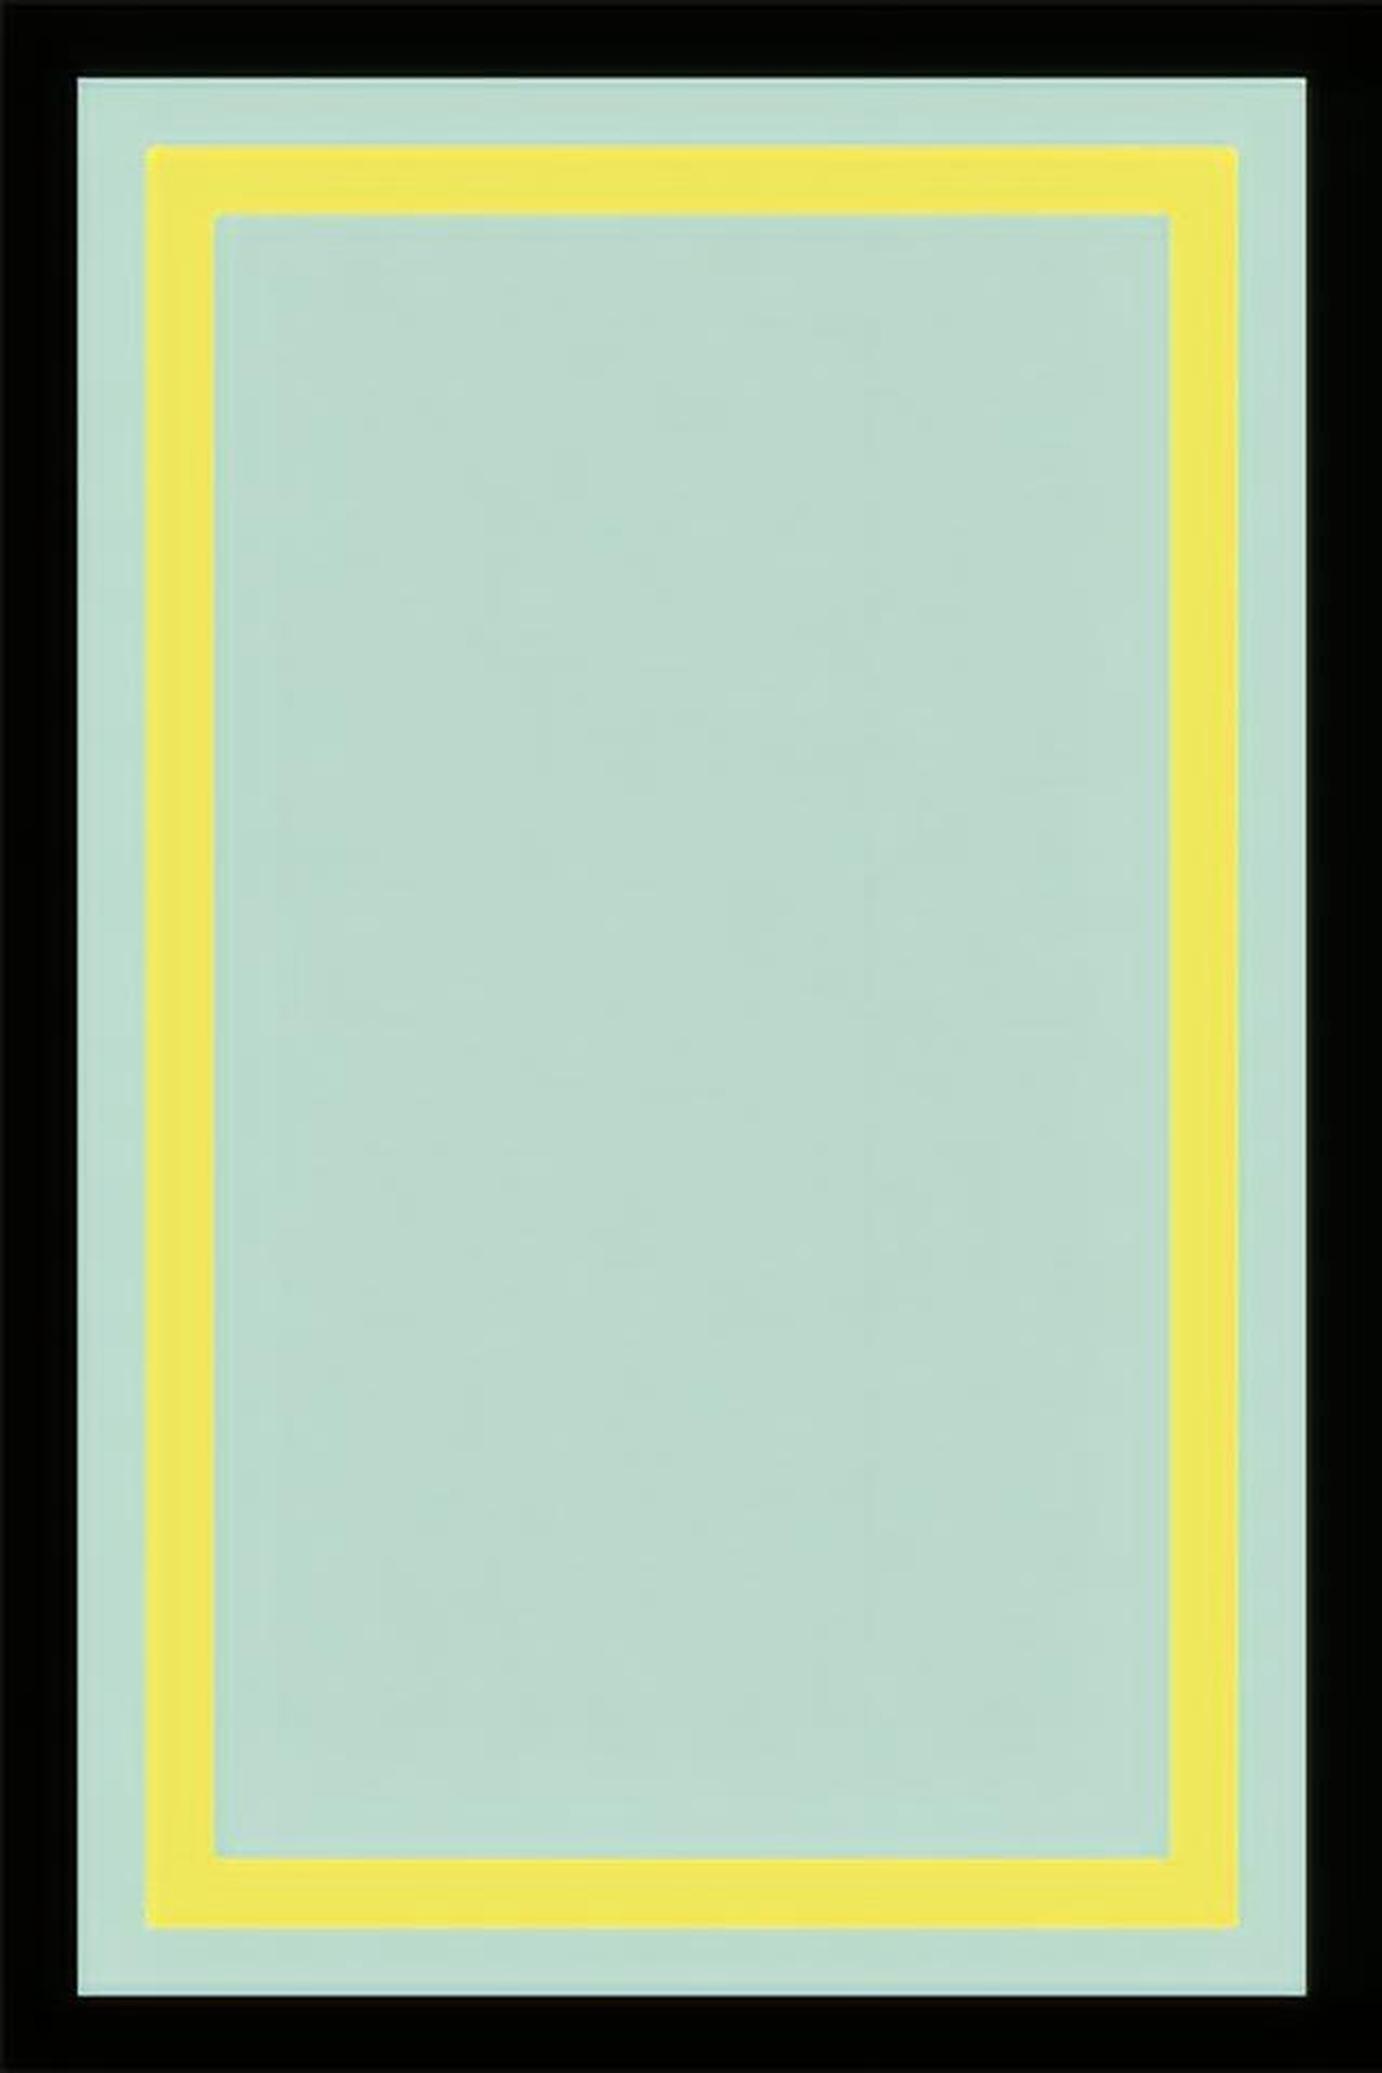
Minimalism — Density 0.319
An abstract painting showing typical minimalist characteristics with minimal form and color

Color Field Painting — Density 0.318
A quintessential Color Field work with large color fields filling the canvas
Low-Density Samples — Outlier Images
Low-density samples are outliers that visually differ significantly from other images within their class. These images may be mislabeled or represent atypical works of the art style, requiring review.
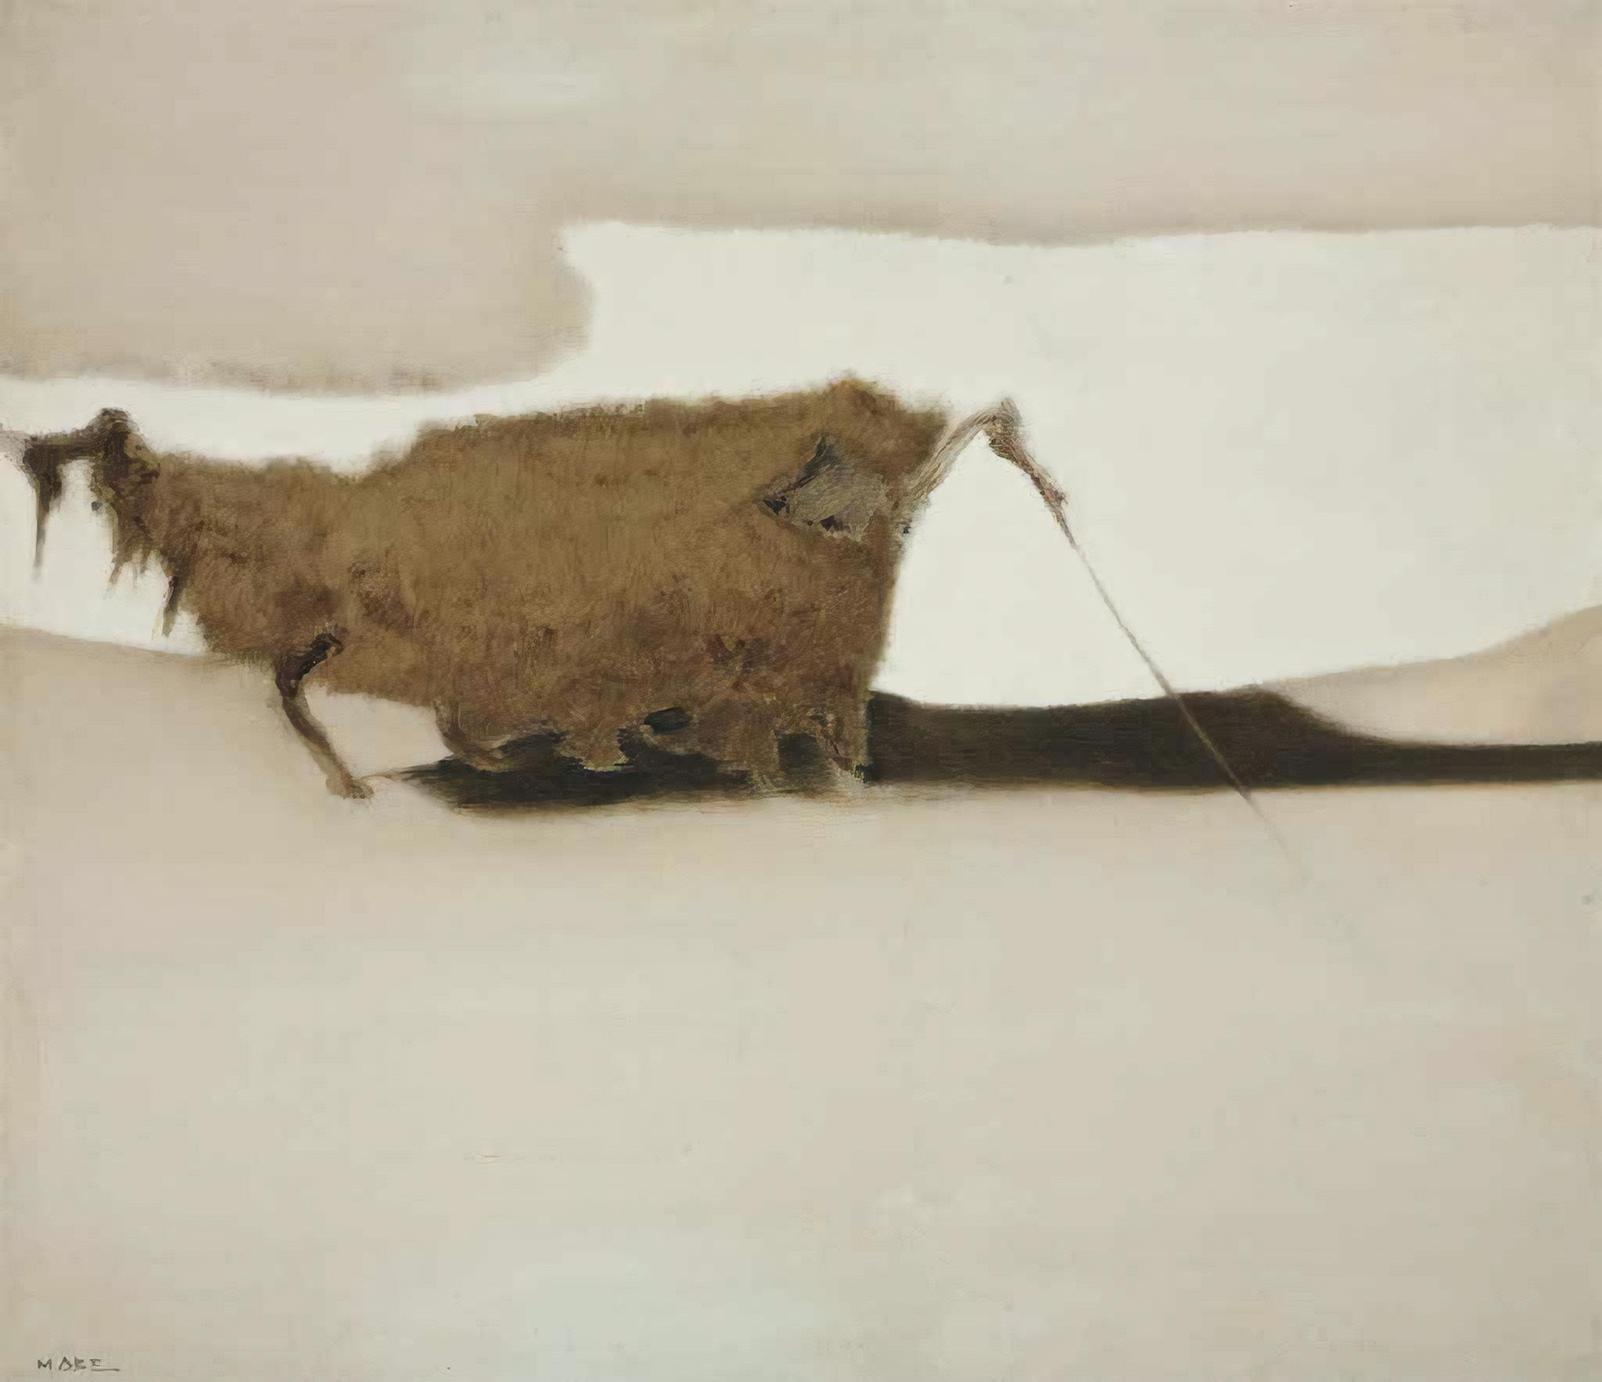
Abstract Expressionism — Density 0.047
An outlier image markedly different from other works in the Abstract Expressionism class
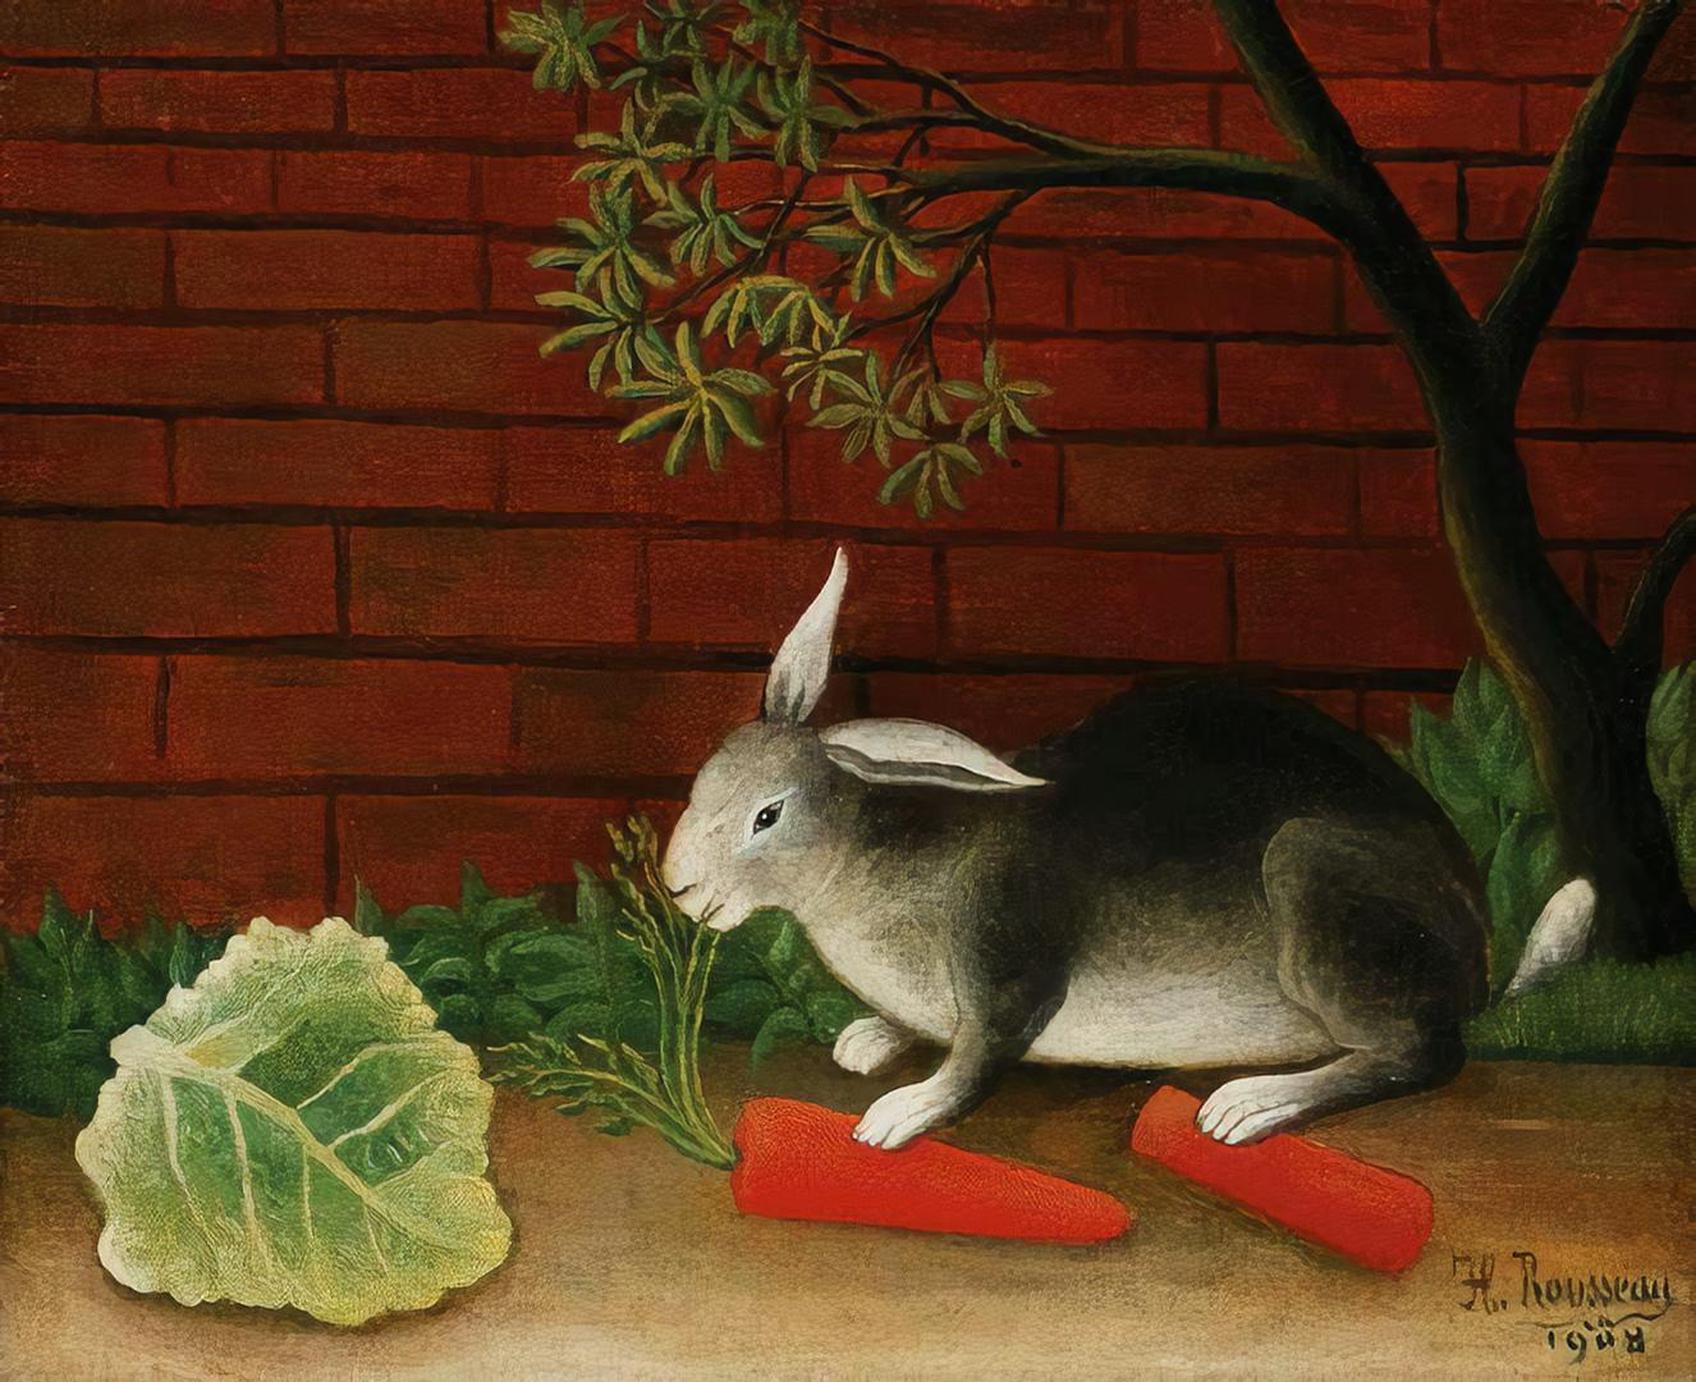
Naive Art Primitivism — Density 0.048
An atypical work with very low density in the Naive Art category
Notably, the density values of the low-density samples (0.047, 0.048) are approximately 7 times lower than the high-density samples (0.318, 0.319). Such extreme outliers are likely labeling errors, collection errors, or edge cases at the boundaries of art styles. DataClinic automatically identifies these samples and catalogs them for data engineer review.
Recommendations: Simultaneous Bulk-Up + Diet Strategy
To raise the WikiArt dataset's quality score from 53 to above 80, two simultaneous improvement strategies are needed: "bulk-up" to augment minority classes, and "diet" to remove unnecessary duplicates from majority classes.
1. Minority Class Bulk-Up (Data Collection and Augmentation)
- Additional Collection: Collect additional images from the official WikiArt website, museum APIs, etc. for classes with fewer than 100 images, such as Analytical_Cubism (98 images) and Action_painting
- Data Augmentation: Use augmentation techniques such as rotation, color adjustment, and cropping to ensure at least 500 images per minority class
- Target: Balance all classes to a minimum of 300 images
2. Majority Class Diet (Deduplication)
- Similarity-Based Deduplication: Classify image pairs with cosine similarity above 0.95 in the L2 embedding space as duplicates and remove one
- High-Density Cluster Sampling: Select and retain 3,000 representative samples centered on high-density regions for majority classes exceeding 13,000 images (e.g., Impressionism)
- Target: Limit maximum images per class to 5,000 or fewer
3. Label Consistency Review
- Boundary Style Review: Re-verify label consistency for overlapping classes in the embedding space, such as Abstract_Expressionism, Action_painting, Color_Field_Painting, and Minimalism
- Outlier Review: Manually re-confirm or remove samples in the bottom 5% density (low-density outliers)
- Class Merging Consideration: Consider merging overly similar styles (e.g., Analytical_Cubism + Synthetic_Cubism) into parent classes
Expected Improvement Results
Expected DataClinic score changes after applying all 3 improvements:
| Metric | Current | Expected After Improvement |
|---|---|---|
| Class Imbalance | Poor (98–13,060 images) | Good (300–5,000 images) |
| Outlier Ratio | ~5% | <1% |
| Label Consistency | Fair | Good |
| Overall Score | 53 (Poor) | 75–80 (Fair–Good) |
DataClinic goes beyond simply discovering problems — it quantitatively shows which classes need how much improvement. This enables the most effective allocation of data engineering resources.