Executive Summary
To train a robot you need one cell per attempt: did this one succeed? That cell goes to four places. It becomes the reward that trains a policy, the filter that decides which episodes stay in the training set, the score that ranks one policy against another, and the signal that decides whether to try again. Nobody can watch thousands of rollouts by hand, so recent systems hand the judgment to a vision-language model and use the answer as ground truth. How often that judge is right is something almost nobody measures before wiring it in.
A preprint posted on 3 September puts those judges on a single scale for the first time. It pulls 2,197 attempts from 14 sources that different teams collected independently, normalizes them into one schema, and scores 13 judge models under the same question and the same input conditions. The best model reaches 0.77 balanced accuracy, which the authors read as roughly one wrong call in four. All five detectors that were fine-tuned specifically to catch failures land below their own base models. What separates the easy sources from the hard ones is not the robot and not the task family but what you have to see in order to decide. Where the outcome shows up as an object that moved, the judges do well. Where it depends on whether two parts actually mated, no model clears 0.60.
One appendix section transfers straight into practice. One purpose-built detector reports 80.6% in its own paper. On that validation split, 79.7% of the samples are failures, so a rule that answers "failure" without looking at anything scores 79.7%. Move the same model onto a class-balanced subset and it drops to 0.533. An auto-labeler's score cannot be read without the board it was scored on. Read the boundaries too. This is a v1 preprint two days old, the data and code are promised but not yet downloadable, and the most quotable finding, the lean toward success when the evidence is ambiguous, comes from the authors reading wrong answers by hand in a subsection that states it is not a statistically supported claim.
0.77
Best balanced accuracy of 13 judges
On a scale where chance is 0.50, the authors read this as one wrong call in four
0.52
13-model mean on contact-rich assembly
Not one model cleared 0.60 on this slice
5 of 5
Specialists that scored below their base
Largest drop 0.088 points, though two of the five pairs are effectively tied
80.6 ↔ 79.7
Published score vs the always-failure rule (%)
A validation split where answering "failure" every time already scores 79.7%
Who Writes Down Success in Robot Learning
Validating a single robot policy means moving the arm hundreds or thousands of times. Every one of those recordings gets one cell filled in by a person. Did this attempt succeed? The cell is not large the way a video or a trajectory is large, and it holds one of two values. It is also the value that travels to more places than anything else in a robot learning pipeline.
The FailBench paper lists four of those places and cites each one. The label becomes the reward that pushes a policy forward in reinforcement learning, the filter that decides whether an episode stays in the training data, the score that says which of two policies is better, and the monitor that decides whether to retry. Get the cell wrong and you get four things wrong at once.
Opening every rollout by hand is expensive, so recent systems hand the judgment to a vision-language model. Feed it the footage and the task instruction, ask whether the attempt succeeded. What the paper points at is what happens next. The answer is used inside the pipeline as if it were ground truth. In the authors' words, in every one of those jobs the answer is used as ground truth, and the quality of the judge itself is rarely evaluated extensively before it is integrated into the pipeline.
Two named cases follow. AutoEval correlates its whole pipeline against human evaluation without isolating the classifier inside it. WorldGym reports 0.89 balanced accuracy for GPT-4o on RT-1 labels and then applies that same judge to scoring generated rollouts. Measuring a judge on one source and using it on another is already standard practice.
Scoring a finished recording after the fact is not the only option. The paper splits failure detectors into two families. One reads the policy itself, looking for anomalies in hidden states, action statistics, or predicted trajectories. SAFE reads a VLA's hidden states and predicts a single failure score; Sentinel pairs a statistical consistency check over the policy's actions with a VLM reading the observations. Most of this family calibrates on successful rollouts alone and sets the threshold by conformal prediction, so it needs no failure data at all. The trade is accuracy against detection time, because the point is to stop or retry a rollout while it is still running. The cost is that the detector is bound to one policy and its architecture.
This article is about the other family. Those judges take a finished recording and an instruction and nothing else, which means the same judge can be attached to any policy on any robot. That generality is the point of them, and it also relocates the hard question. Whether the judge still works once it is moved outside the place it was built is not a side question here. It is the question.
The paper also makes room for the obvious objection, which is that a person could just watch. It describes how human judging actually runs in real-robot evaluation today. RoboArena runs double-blind pairwise comparisons across seven institutions, ManipulationNet has a central committee verify every submitted performance, and ArmnetBench has an on-site operator score each rollout as successful, suboptimal, or failure. The cost is not only labor. On the result the paper cites, real-robot policy comparisons typically run 20 to 30 trials, too few to separate two policies with statistical confidence. That is where the pressure to hand judging to a model comes from.
We have written before about what human labeling of this kind costs. AgiBot World had annotators label even the stretches where the robot fumbled. Knowing that price, arguing that the field should turn back from automated judges is not this article's interest. The question is the other one. What do you validate and approve an automated judge against?
Failures From One Place Cannot Measure Skill
Benchmarks for scoring failure detectors already existed. The trouble is that most of them came out of a single collection campaign. One robot, one gripper, fixed camera placement, the same scenes, the same task family, labels applied by the same people to the same standard. A score measured there mixes the detector's skill with the character of that campaign, and there is no way to pull the two apart.
The practice of manufacturing failures makes it worse. Teams perturb a demonstration until it fails, generate errors automatically, stage mistakes, or pair a perfectly good success video with a different instruction so it counts as a failure. The paper's objection sharpens here. Failures built that way carry traces of how they were built, and a detector can score well by recognizing the traces. Reading the physical state and memorizing the manufacturing artifact look identical from the outside if all you have is the score.
Categories get mixed too. Many existing benchmarks put execution-time errors and plans that were wrong to begin with into one number. The paper's point is that such an average smears a nearly solved problem together with an unsolved one. That is why FailBench narrows its scope. It covers execution failures, meaning the attempted motion did not produce the intended result and the outcome can be judged from the recording alone. Planning failures, where the intended action was inappropriate before execution began, are out of scope. Asking one question across fourteen sources is possible only because the question was shaved this thin.
Instead of collecting new data, FailBench cuts across recordings that already exist. The authors screened roughly 30 candidate corpora, kept 14 sources, normalized their differing camera setups and labeling conventions into one schema, and froze 2,197 samples: 1,176 failures and 1,021 successes. Six of them were never built for failure detection at all. RH20T rates the quality of teleoperated trajectories; REASSEMBLE labels every segment of a contact-rich assembly. In the paper's framing, neither was made to test failure detection, which is why they were pulled in, and both ended up among the hardest slices.
Three rules governed selection. A source had to record a robot carrying a manipulation task to completion, it had to supply its own outcome label, and it had to add a task family, a robot, or a failure mode the collection did not already have. The authors attach a condition to the middle rule: no label in FailBench is their own judgment of a video. So what happens when an inherited label is wrong? They randomly select around 25% of the benchmark for manual inspection, and whenever a sample turns out to have a wrong or ambiguous label they swap in a different sample from the same source and the same distribution. Sampled inspection, not full inspection.
Behind "normalized into one schema" sits a run of decisions. Every source labels differently, so each one needed a call on how to collapse to binary. RH20T has the recording operator assign a quality rating from 0 to 9; the authors mapped 0 (robot fault) and 1 (task goal missed) to failure and the rest to success. More telling is what happened to the ambiguous middle grades. armnetbench's suboptimal tier, robometer's partial-progress tier, and score 4 out of RoboRewardBench's five-point quality scale all dropped out of the benchmark. The stated reason for excluding score 4 is that it represents ambiguous near-completion. At least across those three sources, the samples the judges get scored on are the ones their own sources did not consider ambiguous.
In the table below, the column worth staring at is the last one. How much of the available pool each source contributed varies by more than a hundredfold.
| Source | How the failures arose | Available | Drawn | Share |
|---|---|---|---|---|
| reflect | Planned | 30 | 30 | 100% |
| botfails | Planned | 145 | 144 | 99.3% |
| ur5fail | Organic | 140 | 139 | 99.3% |
| armnetbench | Organic | 345 | 300 | 87.0% |
| robometer | Not stated | 257 | 120 | 46.7% |
| phail | Organic | 524 | 80 | 15.3% |
| simplerenv | Organic (sim) | 2,710 | 300 | 11.1% |
| bdv2fail | Synthetic | 1,000 | 100 | 10.0% |
| robofac | Planned | 1,204 | 60 | 5.0% |
| roboreward | Synthetic | 2,831 | 100 | 3.5% |
| reassemble | Organic | 4,551 | 124 | 2.7% |
| rh20t | Organic | 12,625 | 300 | 2.4% |
| roboarena | Organic | 10,783 | 100 | 0.9% |
| robometersim | Organic (sim) | Not stated | 300 | n/a |
| Total | 14 sources (12 real, 2 sim) | 37,145 | 2,197 | — |
▲ Tables 5 and 6 of the paper, re-sorted by share drawn. The share column is our calculation. robometersim's eligible pool is not stated by its source, so the paper leaves it blank as well. The available pools are not counted in the same unit from row to row: rh20t counts scenes, reassemble counts action segments cut from 153 long recordings, botfails counts episodes. The paper flags two further caveats itself. 154 rh20t scenes and one botfails episode carry no usable binary label, and roboarena's pool is counted before the scene matching its own rule requires. Read roboarena's 0.9% as a sign of how wide the choice was rather than as a like-for-like sampling rate.
This spread matters beyond circumstance because of how the scores are aggregated. The paper's headline metric is the macro average, which weights every slice equally. roboarena, drawn from 0.9% of its pool, carries the same weight as reflect, which was taken whole. One slice holds only 30 samples, so noise in a small slice lands directly in the total. That combining benchmarks shuffles rankings is something an earlier audit from the same lab already showed.
RoboArena was never a success-and-failure benchmark. It ranks two policies against each other through double-blind pairwise comparison, and its evaluators happened to record outcomes as well, which is what FailBench reworked into binary labels. And roboreward's available pool of 2,831 is exactly the size of that benchmark's test split. The reserved exam paper was reused in full.
The paper's priority claim has a boundary. Its introduction states that no published evaluation scores a detector across independently collected sources under one protocol. The authors themselves note a counterexample in the next section: PRIMO R1 transferred zero-shot to RoboFail at 67% after training for process reasoning, and they call it the one cross-source result they are aware of. So what is first is scoring many detectors on many sources under one protocol, not the cross-source experiment itself.
Thirteen Judges on One Scale, and the Best Scored 0.77
The table only reads properly once the metric is clear. Balanced accuracy averages the recall on successes and the recall on failures. However lopsided the two classes are, the expected score from guessing is pinned at 0.50. On data that is nine parts failure, plain accuracy hands 0.90 to a rule that answers "failure" without thinking. Balanced accuracy gives that same rule exactly 0.50. Why the difference is decisive in practice shows up with real numbers in the next section.
There are two ways to aggregate as well. The macro average scores each slice and then weights those scores equally. The micro average pools every answered sample into one calculation. The paper compares models on the macro average. The reflect slice, which contains only failures and therefore has no balanced accuracy of its own, drops out of the macro and enters the micro.
The scoring conditions are held together. Each model runs with the prompt, decoding settings, and thinking budget its own authors recommend, while the question asked and the way it is scored stay the same. What the judge actually sees, though, follows the source. Models that accept video get the clip; the rest get 32 still frames spaced evenly across it. The sources are uneven in their own right. Most provide a single fixed external camera, two supply three synchronized views including a wrist camera, and two release only the first and last frames. What is visible turns out to be the axis that separates the scores later, and that axis already differs source by source.
Here is the scorecard for all 13. Note that first and second place trade positions depending on which aggregate you read.
| Judge model | Group | Macro | Micro | Real | Sim |
|---|---|---|---|---|---|
| Gemini 3 Flash | General | 0.77 | 0.74 | 0.76 | 0.77 |
| Gemma-4-31B-it | General | 0.75 | 0.76 | 0.75 | 0.76 |
| Qwen3-VL-8B-Thinking | General | 0.69 | 0.69 | 0.68 | 0.75 |
| GPT-4o | General | 0.69 | 0.67 | 0.69 | 0.68 |
| Qwen3-VL-4B-Thinking | General | 0.65 | 0.65 | 0.64 | 0.71 |
| Guardian (thinking) | Specialist | 0.63 | 0.61 | 0.62 | 0.64 |
| RoboReward-8B | Specialist | 0.62 | 0.59 | 0.62 | 0.61 |
| Hy-Embodied-VLM-1.0 | Embodied | 0.61 | 0.62 | 0.61 | 0.64 |
| ViFailback-8B | Specialist | 0.59 | 0.56 | 0.60 | 0.54 |
| HY-Embodied-0.5 | Embodied | 0.54 | 0.53 | 0.54 | 0.54 |
| Qwen3-VL-2B-Thinking | General | 0.53 | 0.53 | 0.52 | 0.55 |
| RoboFAC-7B | Specialist | 0.51 | 0.52 | 0.51 | 0.51 |
| FailSense-Calvin-3B | Specialist | 0.50 | 0.50 | 0.50 | 0.53 |
▲ Table 1 of the paper. All figures are balanced accuracy, where chance sits at 0.50. Sorted descending by the macro average.
The top row is 0.77. The paper renders that as roughly one incorrect judgment in four. Attach the judge and auto-fill 1,000 labels, and more than 200 of them move to the next stage flipped. Second-place Gemma-4-31B-it trails by a point on the macro at 0.75 but leads on the micro at 0.76. This is exactly why a "number one" claim with no stated aggregate is worth nothing.
3.1The Five Purpose-Built Models Cluster at the Bottom
Read down the group column and an arrangement stands out. All five detectors fine-tuned specifically for failure detection sit below the general-purpose VLMs. The paper's sentence carries one exception: every purpose-built detector scores below every general-purpose model except the smallest. Qwen3-VL-2B-Thinking, at the 2-billion-parameter scale, scores 0.53, above two specialists and below three. The authors' conclusion is that robotics-specific training does not account for the gap, not that fine-tuning is inherently harmful.
The two models built for embodied robot work sit in the same band. One observation here is ours rather than the paper's. This panel mixes models spanning two years, from GPT-4o released in May 2024 to Hy-Embodied-VLM-1.0 released in July 2026. The paper does not treat model generation as a controlled variable, so reading the table as a generational comparison means saying something the paper does not.
3.2Pick a Judge in Simulation and the Gaps Disappear
The last two columns split the scores between real-robot recordings and simulated ones. The orderings are nearly identical, with a rank correlation of 0.95. The absolute levels differ, though. The simulated side is about 1.3 points easier on average, and the spread between models is smaller there. The authors' implication lands directly on how a judge gets chosen: simulated environments mask the performance gaps, and a judge selected on them may not perform equally when deployed in a real environment. Testing a judge in simulation and then attaching it to a real line is a common order of operations.
Where 80.6% Came From
Appendix D traces, in three lines of arithmetic, where one specialist's self-reported performance came from. The model is RoboFAC-7B and the figure its paper reports is 80.6% plain accuracy on its own validation split.
Start with what that split contains. Of 1,204 samples, 960 are failures. That is 79.7%. So a rule that never looks at the footage and answers "failure" every time scores 79.7% on that board. The reported 80.6% sits 0.9 percentage points above it.
FailBench drew 30 failures and 30 successes from the same data, balanced the classes, and ran the same model again. It caught all 30 failures. It cleared 2 of the 30 successes. Averaging those two recalls gives a balanced accuracy of 0.533. The last line ties the two ends together. Hold those measured recalls fixed and change only the class prior back to the original unbalanced split, and you get 0.811, which is 0.5 percentage points from the 0.806 that paper reported. Same model, same behavior, different board.
This arithmetic was checked independently twice in our pipeline and came out clean. The working rule that falls out of it is simple. When someone hands you a performance number for an auto-labeler, compute the majority-class share of the validation split that produced it. If the reported score sits just above that share, the score describes the composition of the board more than the skill of the tool. Designs that inflate performance by construction are something we have seen before in a medical benchmark that split records from the same mother across train and test. Same illness, different symptom.
4.1Under the Same Conditions, All Five Pairs Point the Same Way
Instead of reading published scores each on its own terms, you can hold the conditions fixed and compare before and after fine-tuning. The authors ran all five specialists next to the base models they started from, under the same prompt, the same decoding, and the same input conditions. All five pairs point the same way.
| Specialist | Base model | Specialist | Base | Difference |
|---|---|---|---|---|
| ViFailback-8B | Qwen3-VL-8B-Instruct | 0.587 | 0.675 | −0.088 |
| RoboReward-8B | Qwen3-VL-8B-Instruct | 0.619 | 0.675 | −0.057 |
| RoboFAC-7B | Qwen2.5-VL-7B-Instruct | 0.514 | 0.555 | −0.040 |
| FailSense-Calvin-3B | PaliGemma2-3B | 0.503 | 0.506 | −0.003 |
| Guardian (thinking) | InternVL3-8B | 0.627 | 0.629 | −0.002 |
▲ Table 7 of the paper. Macro averages over the 13 slices that contain both classes, sorted by size of the drop.
Two cautions come with reading this. The bottom two pairs differ by less than 0.003 and should be read as ties. And even those ties carry a condition. Guardian drew level with its base by winning big on two of its own home datasets; take those two out and it separates to 0.596 against 0.639. There is a case pointing the other way as well. Guardian also beats its base by a wide margin on the robofac slice, which is not its home. "It only wins at home" holds for the macro average but not for the individual slices.
The paper's own conclusion is cautious: fine-tuning for failure detection can make a model worse outside the data on which it was trained. No experiment in this paper establishes why. The circumstances from the previous section are the only circumstantial support. The data these specialists trained on mostly came out of a single collection campaign, and much of it contained failures that were manufactured.
4.2The Authors Wrote Down the Other Side First
Guardian's published scores reproduced in the authors' own pipeline, and they put that result down first. On UR5FAIL they got 0.741 against a published 0.77, and on BDV2FAIL they got 0.850 against a published 0.85, which is essentially a match. Some published scores do reproduce.
The authors draw a line around the ViFailback case as well. Its test split holds 445 failures and 55 successes, so the constant all-failure rule scores 0.890 there, and that paper reports 0.900 for its base model. The authors refuse to call this a reproduction and label it a warning instead. FailBench contains no ViFailback home subset, so there is no way to measure the same thing under the same conditions.
The RoboFAC case shows both sides at once. Its original paper reported beating GPT-4o by 34.1 percentage points on its own evaluation benchmark and, when inserted as a supervisor into a real robot pipeline, a 29.1% average relative improvement across four tasks. The same model scores a macro 0.51 on FailBench and 0.53 on the robofac slice it is the source of. The two sets of numbers are not in contradiction. A composite score on an in-house benchmark and a cross-source balanced accuracy measure different things. But if you pick a tool on the first number, the second one is what you will meet.
Finally, this comparison should not be read as market competition. At least four of the five specialists under evaluation came out of university labs. Guardian belongs to the French WILLOW lineage, RoboReward to Stanford and UC Berkeley, FailSense to Sorbonne, RoboFAC to Shanghai Jiao Tong. These are not products competing. They are different optimization targets that happened to land on one scale. Metric AI Lab, which built FailBench, is a company rather than a university, lists robot failure detection and benchmark science among its research areas, and is developing a failure detection tool of its own. The paper carries no conflict-of-interest or funding statement. It is also true that none of the 13 evaluated models belongs to that company, and that the arithmetic is published down to the appendix so third parties can check it. Read it knowing who did the measuring.
Can Contact Be Judged by Eye?
Put 14 sources on one scale and you can see which conditions make judging hard. It could split by robot platform. It could split by how difficult the task is. Neither of those is where it actually split.
Compare the two ends and the axis appears. The easiest source, robofac, is teleoperated footage of planned failures, and the consequence of a failure shows up in where objects are. Pick the wrong item or set it down in the wrong place and the frame records it. The hardest, reassemble, is contact-rich assembly on a NIST Task Board, the standard fixture built to measure assembly precision, where parts are inserted and turned. The 13-model mean there is 0.52, and not one model cleared 0.60 on this slice. The top score is exactly 0.60.
What separates them is not the robot and not the difficulty of the task. It is the kind of visual evidence the verdict requires. Whether an object moved reads off a wide frame. Whether two parts actually mated requires reading a very small region inside a frame that holds the whole workspace, and a few degrees of misalignment can look exactly like a seated part. The paper does not assert why. It logs a hypothesis: accurate detection may be difficult because of the board-specific knowledge required, or because of the high-precision manipulation of small objects. Scoring that breaks down on contact-dependent work also showed up in the games where humanoids won the sprint but could not hammer a nail. What is new here is that the same boundary appears on the judging side.
Where does this axis come from? That the scores separate by slice is measured in the table. But the statement that accuracy is not associated with the robot or the embodiment, and the statement that it is not associated with the task type either, whether pick, place, or push, come from the authors' hand inspection of wrong answers in the appendix. The distinction that inspection read out is this. Where the failure is semantic, acting on the wrong object or on an item of the wrong color, the detectors mostly catch it. Where the failure is physical, an object released in the wrong place, the jaws closing on nothing, a grasp that slips, they mostly miss it. The authors say plainly that they did not annotate the benchmark according to this distinction and that the sources do not share a failure-type taxonomy that would let them count it. reassemble already carries eight failure types, and this time it was used only for sampling and error review. Annotating every sample under one taxonomy and scoring the panel against that split is the extension they name as next.
One limitation the authors declare themselves lands on top of this. Every FailBench number comes from visual input and the instruction. Yet four of the sources already record force-torque or audio. The hardest slices hold contact signals that the benchmark did not use. The authors did not bury this; they put it in the limitations section. The finding is that contact was left to be judged by eye, not that judging contact is impossible.
5.1The Errors Do Not Overlap
Different models get different samples wrong. Measured as intersection over union of error sets across all 78 model pairs, the mean is 0.28. The highest-overlap pair reaches 0.82, and the authors warn against reading that as agreement about skill. RoboFAC-7B and ViFailback-8B answer failure almost regardless of input, so they are wrong on nearly the same successes. That is shared bias, not shared perception, in the paper's words. Excluding those two, there are only 59 samples the remaining eleven all get wrong.
So why not combine several models? A majority vote of the top three gains about 2 points over the single best model. The cost is running a model three times per verdict, so evaluation runs roughly 3 times the price. And on contact-rich assembly the majority vote still only reaches 0.55. What none of them can see, three of them together cannot see either. How to combine multiple verdicts and multiple pieces of evidence was the subject of an earlier piece on how counting evidence works, and this result points the same way as that one. Counting the same view several times does not add evidence.
5.2Which Way It Leans When the Evidence Is Ambiguous
This is the most quotable observation in the article. That is exactly why the evidence grade has to come first. It comes from a subsection where the authors read wrong answers by hand. The opening paragraph of that subsection says so directly: the inspection followed no fixed protocol and covered a small share of the errors, and nothing in the subsection is a statistically supported claim. Most of the traces they read belong to one model, Gemma-4-31B-it, and the limitations section states that the mechanism is established on that model and assumed rather than shown for the rest of the panel. It is not a systematic bias measured across all 13.
Read on that footing, the cases are vivid. On a collapsed stacking attempt, the model's trace closes with "Is there any reason to believe it failed? No." On a toy left at the mouth of a drawer, it asks "Is it in the drawer or just at the drawer?" and never answers. In one episode of putting an apple in a bowl, the apple is dropped from the gripper at about 63 seconds, never reaches the bowl, and the bowl is empty in every later frame, while the model's verification step records the apple as clearly visible inside the bowl and answers success. In the grapes case the jaws never closed at all. From one camera the grapes read as held; from the other two they are still on the table. All three views went into the model, and it answered success.
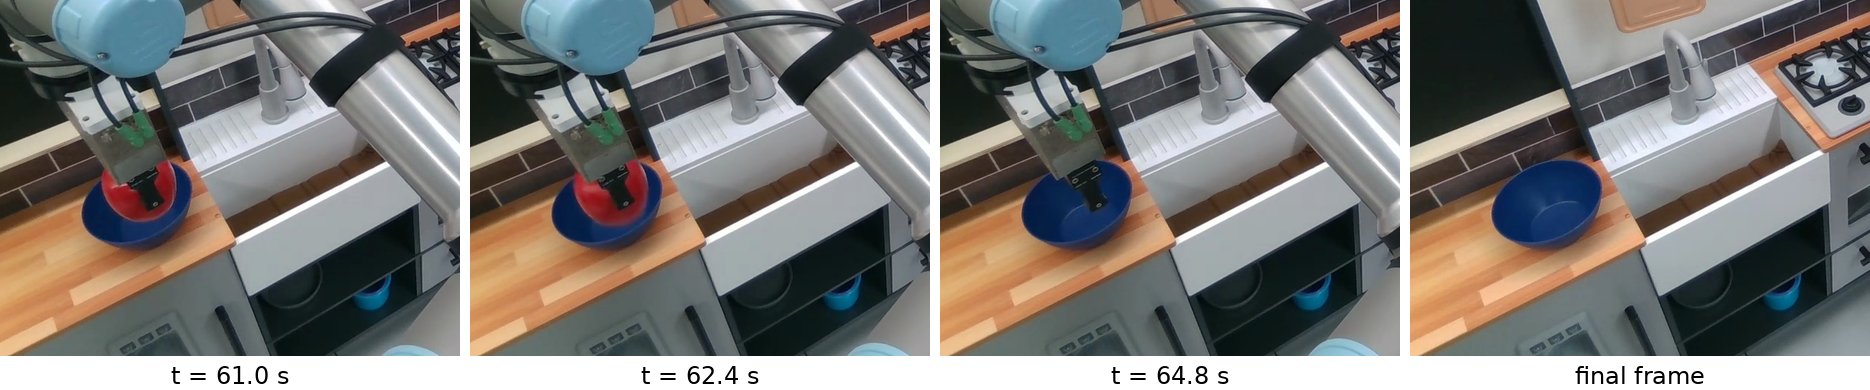
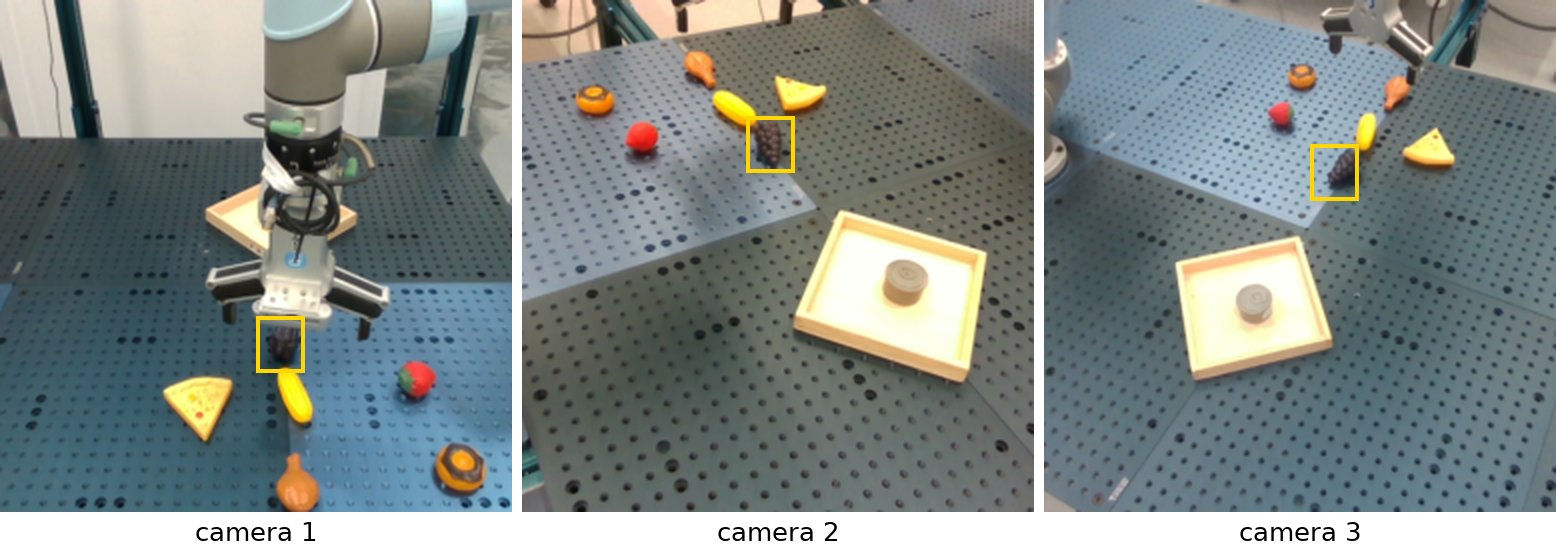
The inspection flags two more mismatches. One is scoring the approach instead of the outcome: a bolt carried to the hole and turned halfway gets called a completed insertion. The other is not checking whether the scene even permits the goal. A bowl that is upside down for the whole recording, a knife lying across the opening, and the attempt still passes. The model checks whether the instructed motion was performed, not whether the world it was performed in could produce that result.
The authors' summary is one sentence: failure is treated as what must be proven. The ambiguity, they write, comes from the viewing geometry or from an underspecified success criterion, and the model resolves it toward success. Exactly one quantity in this subsection was counted. Gemma-4-31B-it's wrong answers carry longer reasoning than its right ones, 1,868 characters against 1,464 on average, with the medians moving the same way. That is as far as the conclusion goes: spending too little reasoning on the harder samples does not account for these errors. There is no intervention experiment that raises the reasoning budget. Thinking budgets were fixed at whatever each model's own authors recommend.
LLM judges that score text have the same hole, widely used and rarely checked. The kind of bias differs, though. As the paper puts it, text judges are biased by position, verbosity, and self-preference, while the problem here is physical state. Unlike a bias manufactured by the design of a rating scale, this one is not fixable by rewriting the prompt. If the camera did not capture the moment, the judge is ruling on something it cannot see.
Change the Frame Before You Change the Model
If the diagnosis turns on the type of evidence, the prescription comes from there too. What the authors tested last was not a better judge model but the frame the judge is sent. They gave Gemini 3 Flash four frames and the task instruction and asked it to mark, with a single box, the region where the outcome would show. Then they cropped to that region and handed it back to the same model for the verdict. The half that draws the box never sees the ground truth. Only fixed-camera views are cropped; wrist and moving cameras go through whole. The 31 samples with no fixed view to crop drop out of this experiment.
The macro average went from 0.773 to 0.797. That is 2.3 points with no retraining. But this table has to be read to the bottom. Four of the fourteen slices got worse.
| Slice | Samples | Full frame | Cropped | Change (pts) |
|---|---|---|---|---|
| simplerenv | 300 | 0.693 | 0.800 | +10.7 |
| roboarena | 100 | 0.740 | 0.810 | +7.0 |
| robometer | 120 | 0.850 | 0.900 | +5.0 |
| rh20t | 300 | 0.655 | 0.701 | +4.6 |
| ur5fail | 139 | 0.828 | 0.857 | +2.9 |
| botfails | 144 | 0.667 | 0.694 | +2.8 |
| reassemble | 124 | 0.567 | 0.591 | +2.3 |
| armnetbench | 300 | 0.723 | 0.743 | +2.0 |
| roboreward | 69 | 0.840 | 0.860 | +2.0 |
| robofac | 60 | 0.933 | 0.950 | +1.7 |
| robometersim | 300 | 0.857 | 0.837 | −2.0 |
| bdv2fail | 100 | 0.780 | 0.740 | −4.0 |
| phail | 80 | 0.918 | 0.873 | −4.5 |
| reflect† | 30 | 0.567 | 0.500 | −6.7 |
| Macro overall | — | 0.773 | 0.797 | +2.3 |
▲ Table 4 of the paper. Gemini 3 Flash serves as both localizer and detector, and the 31 wrist-camera-only samples are excluded. reflect† contains failures only and is scored by failure recall.
Looking only at the net gain hides something. This pipeline fixed 223 samples and broke 160. The net is 63, and an exact McNemar test gives p = 0.0015. Statistically a clear improvement, and also a lot of movement in both directions. "Cropping helps" carries only half the result.
An ablation in the appendix sorts out where the credit belongs. Hold the same boxes and swap only the detector, and simplerenv's gain vanishes. The authors' summary: a well-drawn box only pays if the detector can read it, and a strong detector cannot rescue a badly drawn one. How the crop is rendered barely mattered either. Darkening everything outside the box worked almost as well as cutting to it, and enlarging the crop afterward added nothing. Their own sentence states the limit of this section: none of this teaches the model to read contact state. What it does is take away everything the model does not need to look at.
6.1Run Six Steps Before You Attach a Judge
Turn all of this into an adoption review and you get six steps. The first two need no model runs at all; the effort climbs from there.
One
Ask which validation set produced the performance number you were handed, and count the success and failure split of that set. A performance table with no class ratio is a table you cannot read.
Two
Use that ratio to compute what a constant one-sided answer would score. One division. If the reported score sits just above it, you are looking at the composition of the board, not the skill of the tool.
Three
Measure it once more outside the data the tool trained or validated on. A hundred recordings from your own floor is enough. Draw them with the classes balanced.
Four
Break the score out by evidence type. Aggregate tasks decided by whether an object moved separately from tasks that turn on whether contact was established.
Five
Have a person look at the frames the judge actually receives. Check how many pixels the deciding region occupies and whether the deciding moment is in the footage at all.
Six
Read a sample of the reasoning traces behind wrong answers. Which way the errors lean does not show up in the total, and recording a failure as a success costs something different downstream than the reverse.
There is a range this procedure does not reach. The label FailBench covers is one binary cell attached to a finished execution. It says nothing about whether a detector can spot a bad plan, anticipate a failure, name which failure occurred, or estimate progress. In the authors' phrasing, this is the thinnest label a recording can carry, which is what makes it comparable across fourteen sources and also what caps what a score on it can tell you. The embodiment is lopsided as well. Every source is a parallel-jaw arm on a tabletop, bimanual work appears in only 98 rollouts, and there is no humanoid, no mobile manipulation, and no dexterous hand.
Running this benchmark yourself is not possible right now either. The abstract says FailBench and the accompanying evaluation harness are released, but as of 5 September 2026 the project homepage lists code, dataset, and leaderboard all as coming soon. The paper itself is a v1 preprint posted on 3 September, with no peer review information. What is available today is not the data but the method and the arithmetic. Because the appendix is public, the six steps above transfer directly to your own data.
What happens after a label is wrong? One thing needs to be clear. This paper never shows a policy degrading because it was trained on contaminated labels. What it measured stops at the accuracy of the judge. That connection is one we build from adjacent evidence, and an earlier case where well-curated data failed to translate into policy performance is part of that evidence. How far an error in one label travels before it reaches the policy is something nobody has quantified yet.
Why This Matters to Pebblous
AI-Ready Data is about the shape a model can actually consume. In robot data, the last cell of that shape is the label recording success or failure. However well organized the trajectories, the video, and the sensor logs are, if that cell is wrong the attempt is used wrongly as a reward, wrongly as a filter, and wrongly as an evaluation score. Right now the thing filling that cell is shifting from people to models. Which means the target list for data diagnostics has to include not only the data but the tool that produced the label. That is why, when DataClinic opens a dataset, it also asks whether the labels came from a human, a simulator's success predicate, or a VLM.
For anyone responsible for quality, the most valuable part of this paper is not the leaderboard but Appendix D. When a tool arrives claiming 80.6%, and 79.7% of the validation set that produced that number were failures, an empty rule that makes no judgment at all scores 79.7%. A score does not carry only the tool's skill. It carries the composition of the board it was scored on. The proposition that quality is the correctness of a value and equally the verifiability of the procedure that produced it translates, here, into a single sentence: an auto-labeler's score cannot be read without the board it was scored on.
The second thing this paper shows is that the same tool takes a different value the moment it steps one pace outside its home dataset. All five specialists did, and even the one that drew level with its base separated once its two home slices came out. That single line is the reason a vendor's performance table has to be re-measured on your own floor.
What makes this practical is how light the starting point is. The class ratio of a validation set can be counted without running a model, and the constant one-sided score is one division. Those two numbers already read half of any performance table you are handed. Cross-validation outside the home dataset comes next, then the breakdown by evidence type. Tasks decided by whether an object moved and tasks that turn on whether contact was established came apart at 0.72 and 0.52 for the same tools. If your work looks more like the latter, the vendor's average does not describe your floor.
Label quality is discussed actively across robot data today. Labeler quality is not. In the paper's phrasing, the quality of the judge itself is rarely evaluated extensively before it is integrated into the pipeline. If what to feed a robot was about the composition of the data, and what a success rate alone cannot show was about the limits of a metric, this piece stands between them. What do you measure the measuring tool with? The sentence worth taking from this paper is that a tool which manufactures labels needs the same grade of validation as the labels themselves.
References
Primary sources
- 1.Navasardyan, Z., Danielyan, T., & Davtyan, H. (2026). FailBench: How Reliable are VLMs at Judging Robot Task Success? arXiv:2609.03611v1 [cs.RO], 2026-09-03. (Primary source for this article: main text §1–§7 and Appendices A–D.)
- 2.Metric AI Lab. FailBench project homepage. Accessed 2026-09-05. (Code, dataset, and leaderboard all listed as coming soon.)
- 3.Metric AI Lab. metricailab.com. Accessed 2026-09-05. (Stated research areas of robot failure detection and benchmark science, and an in-house failure detection tool under development.)
The five purpose-built detectors evaluated
- 4.Pacaud, T., Garcia, R., Chen, S., & Schmid, C. (2025). Guardian. arXiv:2512.01946. (French WILLOW lineage. Also the origin paper for the ur5fail and bdv2fail sources.)
- 5.Lee, T., Wagenmaker, A., Pertsch, K., Liang, P., Levine, S., & Finn, C. (2026). RoboReward. arXiv:2601.00675. (Stanford and UC Berkeley. Origin paper for the roboreward source.)
- 6.Zeng, W., et al. (2025). ViFailback. arXiv:2512.02787. (Test split of 445 failures and 55 successes. We could not confirm this paper's affiliation or scale, so neither is used in the body text.)
- 7.Lu, W., Ye, X., Ye, J., Tao, Y., Yang, S., & Zhao, H. (2025). RoboFAC: A Comprehensive Framework for Robotic Failure Analysis and Correction. arXiv:2505.12224. (Led by Shanghai Jiao Tong University. 9,440 failure trajectories and 78,623 QA pairs; +34.1 percentage points over GPT-4o on its own benchmark, and a 29.1% average relative improvement across four tasks when inserted into a real pipeline.)
- 8.Grislain, C., Rahimi, H., Sigaud, O., & Chetouani, M. (2025). I-FailSense. arXiv:2509.16072. (Sorbonne ISIR. Listed in FailBench as FailSense-Calvin-3B.)
Source datasets named in the body
- 9.Fang, H.-S., et al. (2024). RH20T. arXiv:2307.00595, ICRA 2024. (About 110,000 teleoperated trajectories, recorded with RGB-D, 6-axis force-torque, and audio.)
- 10.Sliwowski, D., et al. (2025). REASSEMBLE. arXiv:2502.05086, RSS 2025. (Contact-rich assembly on NIST Assembly Task Board 1; 516 failures among 4,551 segments. Event camera, force-torque, and microphone are recorded alongside.)
- 11.Atreya, P., et al. (2025). RoboArena. arXiv:2506.18123, CoRL 2025. (Seven institutions, seven policies, roughly 600 episodes. Designed as double-blind pairwise ranking.)
- 12.Selvaraj, N. M., et al. (2026). armnetbench. arXiv:2607.24481. (12 tasks on single-arm and bimanual SO-101 cells. Distinct from Amazon's ARMBench, which Metric AI Lab's homepage mentions separately.)
- 13.Liu, Z., et al. (2023). REFLECT: Summarizing Robot Experiences for Failure Explanation and Correction. (The public real-robot portion of RoboFail is FailBench's reflect slice.)
Judge models whose specifications appear in the body
- 14.Google DeepMind (2025). Gemini 3 Flash model card. 2025-12-17. (Macro-average leader among the 13.)
- 15.Gemma Team (2026). Gemma 4 Technical Report. arXiv:2607.02770. (31B dense, Apache 2.0, weights released 2026-04-02.)
- 16.Bai, S., et al. (2025). Qwen3-VL Technical Report. arXiv:2511.21631. (2B, 4B, and 8B Thinking variants all appear in the panel.)
- 17.OpenAI (2024). GPT-4o System Card. arXiv:2410.21276. (Released May 2024, the oldest model in the panel.)
- 18.Wang, Y., et al. (2026). Hy-Embodied-VLM-1.0. arXiv:2607.12894. (Tencent. The most recent model in the panel.)
Earlier Pebblous articles
- 19.Pebblous (2026). AgiBotWorld Labels the Robot's Fumbles. 2026-06-22.
- 20.Pebblous (2026). Collapsing Two Benchmark Pairs Moved 22 of 51 Physical AI Models. 2026-08-28.
- 21.Pebblous (2026). Preterm Birth Prediction Fell to AUROC 0.493 Under Patient-Level Splits. 2026-08-21.
- 22.Pebblous (2026). Copying One Camera Eight Times Left 720 Robot Verdicts Unchanged. 2026-09-04.
- 23.Pebblous (2026). The LLM Judge Bias a Rating Scale Floor Can Manufacture. 2026-08-29.
- 24.Pebblous (2026). The Humanoid That Outran Bolt Could Not Hammer a Nail. 2026-08-30.
- 25.Pebblous (2026). We Mixed in Flawless Data, and the Robot Got Worse. 2026-07-17.
- 26.Pebblous (2026). What Do You Feed a Robot? 2026-08-01.
- 27.Pebblous (2026). The policy passed the skill test. The audit still found every deleted demonstration. 2026-08-25.