Executive Summary
This article follows a question that refuses to return a single number: how strongly do Americans oppose a data center in their own area? Between the spring and the summer of 2026, inside a window of about four months, eight national surveys went into the field in the United States, and local opposition was recorded anywhere from 49% to 75%. In the same March, one survey wrote 49% and another wrote 71%. Opinion was not the only thing that scattered. What each survey asked, which answer boxes it read out loud, and how close to home it pointed all differed from one instrument to the next.
Ask what people are for, and the picture sharpens. In a survey of more than three thousand adults, the proposal that won the widest agreement was not "stop building." It was that if the grid has to be reinforced, the company doing the building pays for it. The judgment that data centers deliver employment and tax money to the places that host them landed at the bottom of every item tested. What people are asking for looks less like a demand to halt artificial intelligence and more like a demand about who receives the bill.
That demand matches what a research team heard firsthand over eighteen months in Pennsylvania. Electricity bills, property values, what two earlier industries left behind after they came and went, and the fact that the people at the negotiating table have signed nondisclosure agreements and cannot speak. Four strands begin in four different places, and at the end of them the researchers met the same counterpart. The last stop is less comfortable. Nobody has yet measured the size of this fight with a single ruler.
Opposition in two surveys fielded the same March
Same country, different question
Support for making builders pay for grid upgrades
Above capping new construction (62%)
Projects with every phase-one permit, out of 100-plus proposals
Pennsylvania state count, August 2026
Range of counts for data centers in Pennsylvania
Seven counters, as of July–September 2026
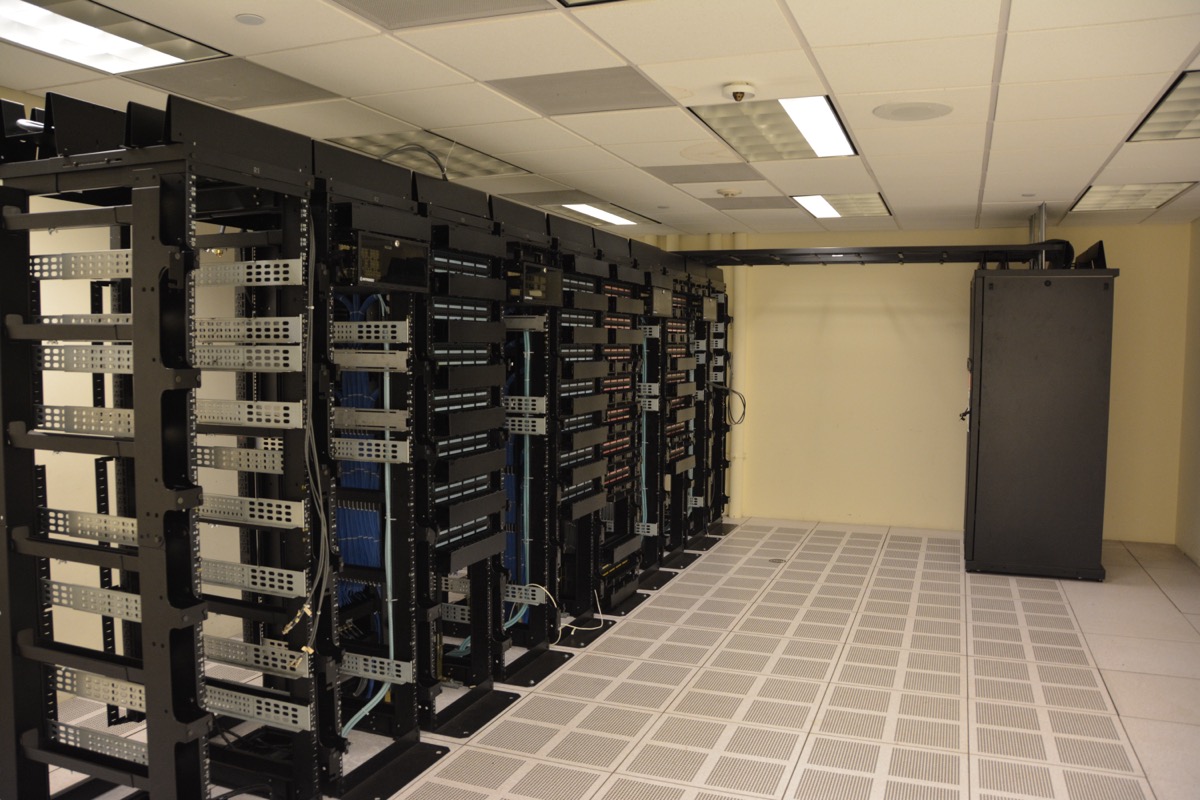
Same Season, Same Country, Answers from Forty-Nine to Seventy-Five
A TechCrunch article published on September 22, 2026 opens this way: "Surveys of public opinion say that more than 60% of Americans favor limiting new data centers, particularly in their communities." The piece hangs that one sentence on links to three surveys. Open the three in order and something odd shows up quickly. They did not measure the same thing. Two asked whether the respondent supports a data center going up where they live. The third asked whether the respondent supports a policy that limits how many new data centers can be built. The first is an opposition rate; the second is a policy approval rate. The moment the two are bundled into one sentence, it stops being clear what the 60% is a share of.
Widen the frame from three surveys to eight and the gap widens with it. The table below lines up the eight national surveys fielded in the United States between February and August 2026, ordered by field date rather than release date. The two rightmost columns carry the details that matter later: whether respondents were read a "neither" box, and how the survey was administered. Those two columns turn out to be where the answers split.
| Survey | Field dates | Respondents | What it asked | Oppose | Support | 'Neither' box | Mode |
|---|---|---|---|---|---|---|---|
| Annenberg, wave 1 | 2026-02–03 | not disclosed | New data center in my area | 49 | 21 | Offered | Online + phone |
| Gallup | 2026-03-02–18 | 1,000 | AI data center in my area | 71 | 27 | Not read out | Phone |
| Reuters/Ipsos | 2026-06-03–08 | 4,531 | Data center in my community | 57 | 14 | Not specified | Online |
| Annenberg, wave 2 | 2026-06-16–07-19 | 1,320 | New data center in my area | 61 | 14 | Offered (25% chose it) | Online + phone |
| AP-NORC/EPIC | 2026-07-06–24 | 3,424 | Policy: limit the number built | 8 | 62 | Offered (29% chose it) | Not confirmed |
| Fox News | 2026-07-17–20 | 1,003 registered voters |
Data center for AI in my area | 70 | 30 | Forced choice | Phone + online |
| Heatmap Pro | 2026-08-08–13 | 2,045 registered voters |
New data center near me | 75 | not disclosed | Not specified | Text · web |
| UMass Poll | 2026-08-21–26 | 1,000 | AI data center in my local community | 65 | 11 | Offered (24% chose it) | Online |
Values confirmed against each survey's own topline or release. Only the AP-NORC/EPIC row asks a different kind of question. The other seven put it as whether one should go up where the respondent lives; that one put it as whether a policy should cap how many get built. They sit in the same column without being the same quantity.
The first two rows are the ones that snag. The Annenberg Public Policy Center's first wave recorded 49% opposition between February and March 2026, and Gallup, asking from March 2 to 18, recorded 71%. Their field periods overlap. The 22-point gap between them is hard to read as public opinion flipping inside a single month.
1.1A different question measures a different thing
Four things separate the two surveys. First, Annenberg read respondents a "neither" option and Gallup did not read one out. What Gallup's own methodology footnote says about handling "don't know" could not be confirmed from the primary document, so the accurate phrasing is not "it withheld the option" but "it did not explicitly read out a third choice." Second, Annenberg asked about a "data center" and Gallup asked about an "AI data center." Third, one ran mostly online and the other by phone. Fourth, the two questions point at different distances.
The fourth item can be checked inside a single survey. Reuters/Ipsos asked the same respondents three times, moving the distance each time. Opposition to new data center construction in general came in at 45%, narrowing it to "in my community" raised it to 57%, and narrowing further to "within 10 miles of my home" raised it to 59%. The closer the question gets to the respondent's back yard, the higher opposition climbs. The eight surveys in the table each set that distance differently.
1.2The neutral box alone does not account for the 22 points
Of the four candidates, the first one, the neutral box, looks the most promising. It seems natural to assume that offering a third choice drains people from both sides and pulls the opposition figure down. The survey methodology literature does not simply grant that assumption. A preregistered experiment by Elkjær and Wlezien, published in Political Science Research and Methods in 2024, randomly assigned 4,810 US respondents across eight policy items, varying only whether a "don't know" option was offered. The authors report the result cautiously: "we observe an average treatment effect of 1 percent (p = 0.12) in the expected direction, but it (also) fails to reach statistical significance." The largest single-item effect was 3 points.
The same paper also spells out when the effect grows. It grows when respondents know little about the issue and the issue carries low salience. Effects reached 5.6 points on an infrastructure bill item, 7.2 points on abortion, and 10 points on estate tax. Data centers in the spring of 2026 fit that description precisely. This is exactly the stretch in which Heatmap Pro's tracking series shows "not sure" rising from 15% to 21%. So the honest landing is this. The conditions for the neutral box to bite were present, but how much of the 22 points belongs to it cannot be separated out from what has been published.
1.3Read the table down its columns and the side that collapses is support
Read only the opposition column and the values scatter from 49 to 75, leaving a reader with no fixed point. Run a finger down the support column of the same table and a much cleaner contrast appears. In the surveys that explicitly read out a "neither" option, support sits between 11% and 21%: Annenberg wave 1 at 21%, Annenberg wave 2 at 14%, UMass at 11%. In the surveys that effectively forced a choice between two options, the figures are 27% and 30%: Gallup at 27%, Fox News at 30%. Roughly double.
Read that way, what the neutral box actually does becomes visible. It does not shave the opposition side; it shaves the support side. A sizable share of what forced-choice surveys tally as "support" is soft support that walks out through a third door as soon as one is opened. One caution has to stop the argument here. The eight surveys also differ in population. Fox News and Heatmap Pro asked registered voters; UMass and Annenberg asked all adults. Gallup ran by phone and most of the rest ran online. The reading goes as far as "this is how it reads," and pushing it to "this is the cause" would be this article performing the move it flagged at the start of this section.
1.4None of which means opinion held still
Saying the instruments wobbled is not the same as saying opinion stayed put. Exactly one survey in the table measured the same item repeatedly: the tracking series run by Heatmap Pro, a climate and energy outlet that commissioned it in house. In September 2025 that series had support at 43% against opposition at 42%. Eleven months later, in August 2026, opposition stood at 75%, with "strongly oppose" alone above 60%. That the sponsor is an outlet editorially critical of data centers belongs in the record alongside the numbers, but the fact that the same ruler recorded that much movement between two readings still stands. Annenberg's opposition figure also rose 12 points between its two waves, and the release called that "the largest shift on any AI question measured in these surveys."
Heatmap Pro is the only outfit in the table that asked about data centers more than once, but AP-NORC asked an adjacent item twice with identical wording. Concern about the environmental impacts of the artificial intelligence industry rose from 41% in September 2025 to 53% in July 2026. That item is useful because of the company it keeps: other industries sat in the same grid. Cryptocurrencies went from 29% to 28%, meat production from 29% to 32%, air travel from 23% to 28%, all close to flat. Of the four industries the same organization asked about twice in identical wording, only artificial intelligence moved, by 12 points. The expectation that AI will do more to hurt society as a whole also rose, from 44% to 52%. It is hard to read this as anxiety inflating across the board. One item moved.
This blog has cited Gallup's 71% before. That article described the survey as "released in May," and May is the release; March is the field. That is why the table above is ordered by field date. Order it by release date and Annenberg's first wave and Gallup appear to sit in different seasons, which invites a reader to charge the 22 points to the time between them.
The Biggest Majority Chose a Rule About Who Pays
If the opposition rate swings from survey to survey, there is another angle to try. Not what people are against, but what they are for. The only policy question in the table above answers that. It is the 2026 energy survey run jointly by the AP-NORC Center for Public Affairs Research and the Energy Policy Institute at the University of Chicago. It reached 3,424 adults with a margin of sampling error of ±2.2 points, in the field from July 6 to 24. It laid out four data center policies and asked whether the respondent would support or oppose each.
Support for the four items runs as follows. What matters here is the order of first and third place. The item that drew the most support was not the one that blocks construction.
Net support (strongly plus somewhat) on item DC3 of the 2026 AP-NORC/EPIC Energy Survey. 3,424 adults, ±2.2 points. Bar length is proportional to the percentage. Net opposition on the same item ran 7%, 9%, 8%, and 20% in the same order.
"Requiring companies that build data centers to pay for the electric grid upgrades needed to support them" drew 73%. "Limiting the number of new data centers that can be built" drew 62%. Eleven points apart. The lowest item is the one that would stop new natural gas plants from being built to supply electricity to data centers, at 41%. That item also carries the highest opposition of the four, at 20%. The top two items by support are not the ones that block construction. Paying for grid upgrades at 73% and clean energy sourcing at 65% both sit ahead of the 62% for capping how many get built.
This item carries one more instance of the box from the first section. Respondents could answer that they neither support nor oppose each of the four policies, and the share that took it runs 19%, 25%, 29%, and 38% in the order of the bars above. That is where the bottom item's 41% comes from. Opposition is 20% while the share withholding judgment is 38%. The item trails not because many people rejected it but because many people had not settled on an answer. The survey also randomized the order of the items in the grid and read the response options in reverse order to half the sample, which aims at the same target. The people who designed the instrument knew first that the form of the measurement moves the answer, and controlled for it.
2.1Electricity bills top the worry list, jobs and tax revenue bottom the benefit list
The same survey asked what concerns people about the communities where data centers get built. Combining "extremely" and "very" concerned, electricity prices lead at 63%, followed by water supply at 57%, power outages at 53%, and noise at 39%. The item sitting next to it is the heart of this section. Respondents were asked how beneficial data centers are to the communities that host them across four dimensions, and the two things always placed at the front of a pitch to host one landed at the bottom.
| Beneficial to the community? | Extremely/very | Not very/not at all | Not sure |
|---|---|---|---|
| Technological advancement | 24 | 26 | 18 |
| Job creation | 20 | 34 | 16 |
| Improved infrastructure such as expanded grids | 18 | 32 | 22 |
| Tax revenue | 16 | 31 | 25 |
Item DC2 of the 2026 AP-NORC/EPIC Energy Survey, in percent. On all four dimensions, "not very / not at all" outweighs "extremely / very." Jobs run 20 against 34; tax revenue runs 16 against 31.
Twenty percent saw jobs as a clear benefit of data centers, and 34% saw no benefit there. Tax revenue runs 16% against 31%. The two items that open every siting presentation sit lowest in the respondents' own assessment. Reuters/Ipsos shows the same structure from another angle. In that survey 61% agreed that data centers are necessary, while 77% of the same respondents said they should be built in a distant area. The share worried that their electricity bills would rise was also 77%.
2.2Heavy users of artificial intelligence oppose them just as much
There is a standard rebuttal at this point. Opposition comes from not understanding artificial intelligence, the argument runs, and using it changes minds. Annenberg's second wave blocks that rebuttal head on. The release states that "opposition to local data centers is essentially flat across usage groups": 64% among non-users, 60% among light users, 60% among heavy users. A spread of four points.
In the same survey, expectations about what artificial intelligence will do to the country diverge sharply by usage. Among respondents who do not use it, 54% see a negative effect; among heavy users, only 29% do. Optimism clearly exists and it tracks usage. That optimism has a boundary, though. Matt Levendusky of Annenberg put it this way: the optimism "disappears when we ask about privacy, about jobs and about whether a data center should go up nearby."
Gallup carries a contrast running the same direction. In its survey, opposition to a nuclear power plant being built in the respondent's area is 53%, while opposition to an AI data center in the same area is 71%. Eighteen points higher. The regional pattern also cuts against the received wisdom. Opposition runs stronger in the Midwest at 76% and the South at 75% than in the West at 63%. Reading this opposition as a phenomenon of progressive-leaning regions does not work.
Put together, it comes to this. What is here is not a rejection of artificial intelligence. It is a demand about the rules that decide who receives the costs and the benefits a piece of infrastructure creates. The direction of that demand holds steady from survey to survey. What wobbled is the machinery that converts the demand into a number.
Eighteen Months in the Field Turned Up Four Strands
What a survey measures is which box people checked. Why they checked it has to be asked another way. The AI Factory, a 78-page report released on September 21, 2026 by the nonprofit research institute Data & Society, took on that question. Five researchers spent eighteen of the months of a two-year project in the field in Pennsylvania. From November 2024 to April 2026 they made four week-long trips, crossing the state by car or train through seventeen locations from Philadelphia to Pittsburgh.
Forty-four people sat for interviews. The report's methodology appendix records the composition of those 44 participants in seven categories: experts, activists and organizers, labor unions, policymakers, institutional leaders, archivists, and residents. There is a reason this article insists on the unit being counted. The same number narrows easily as it passes through news coverage and summaries, until it reads as though the team met 44 Pennsylvania residents, and once it narrows that far, what a union officer or a county official said becomes resident testimony. Change the character of the sample and you change the claims the sample can carry.
Two more disclosures before the strands. First, this team holds a critical position on the way artificial intelligence is currently being sold. TechCrunch stated as much in its article, noting that the authors are critical of the way AI has been pitched. Second, the researchers stated what their study is not. They wrote that they are not trying to measure the empirical impact of data centers but instead want to understand the way people experience the debate over their construction. So the four strands below are not a list of what data centers caused. They are a list of what people said.
The funding and the procedure belong here too. The work was supported by the Mellon Foundation; participants who were able to accept payment were compensated $50 for their time; the study received ethics approval from Pearl IRB. Interviews were audio recorded with consent, transcribed, and then coded collectively and iteratively by the team in qualitative coding software. The researchers also noted that they did not track individual projects one by one, concentrating instead on several regions and sites. Since the sixth section weighs the funding and the commissioning party behind other numbers, the funding behind the document this piece leans on is set down in the same place.
3.1First strand: the electricity bill
Electricity bills came up earliest and came up most often. The report notes that despite being a fracking hub, some Pennsylvania communities are experiencing brownouts and energy constraints, and that for households already carrying high energy bills, data centers pose a threat to their budgets. Interviewees whose work focuses on utility costs went further, saying that the high bills expected from data center development could tip Pennsylvania residents into homelessness.
"Like my electricity bill is now more than my car payment. You take all of that, it makes people full of rage. And the thing right now people are pointing some of that rage towards is data centers."
"The problem with energy affordability is data centers. And that's the thing. It doesn't matter how many solar panels we put in place right now. If you are exponentially increasing greenhouse gas emissions to fuel data centers, it doesn't matter. This is the fight. This is the environmental fight."
This is the only one of the four strands whose direction is backed by separate statistics. The average monthly electricity bill for a Pennsylvania household rose from $213 in 2024 to $257 in 2026. By the state Independent Fiscal Office's count, the residential price to compare for the billing period from June to November 2026 is 12.61 cents per kilowatt-hour, 11.9% above the same period a year earlier, the third consecutive quarter of double-digit year-over-year increases. The wholesale side is steeper. Wholesale power costs across the PJM footprint rose 75.5% year over year in the first quarter of 2026, and within that, capacity prices alone jumped 398%.
Naming the cause came from the market monitor. PJM's independent market monitor attributed 63% of the first-quarter 2026 price increase to data center demand and converted that into roughly $9.3 billion in additional costs for ratepayers to absorb over the following year. PPL, the utility headquartered in Allentown, agreed to raise residential rates by 4.9% effective July 1, 2026. For a household using 1,000 kilowatt-hours a month, that is $7.42 more, plus a new $15 monthly fixed charge. It is the utility's first distribution rate increase since 2016. The organizer's sense of it was not an exaggeration.
3.2Second strand: property values, living conditions, and a number that is missing
The second strand is property values. The report's concluding section places "threats to property values" on the list of concerns that unite this coalition, alongside strain on water and energy resources, public health risks, and increased noise and traffic. TechCrunch likewise named the worry that data centers will drive down property values as a leading motive for opposition.
This strand has no number attached. The report carries no quantitative evidence for it, and our own search for empirical research on the effect of data center proximity on housing prices turned up nothing we could confirm. The AP-NORC survey in the previous section asked about electricity prices, water, outages, and noise, but did not ask about property values. So this is as much as can be said here. Property values are firmly on the list of worries and have not been measured. That gap is itself one instance of the problem the final section takes up. On one of the items people raise most often, there is no public measurement that can tell them whether the worry is right or wrong.
3.3Third strand: the memory of two industries
The third strand differs in kind from the other three. It is not a worry about what is happening now but a memory of what already happened. Northeastern Pennsylvania built a regional economy on anthracite mining and then lost it, after which shale gas drilling arrived and left behind one more gap between promise and outcome. A local historian cited in the report puts the northeastern coal workforce at 142,000 at its peak and about 1,000 today. Over the same two decades, the number of hard manufacturing unions decreased 33 percent, replaced instead by unionized nurses, teachers, and municipal workers. What shrank was not only the count of jobs but the kind of organization that had protected them.
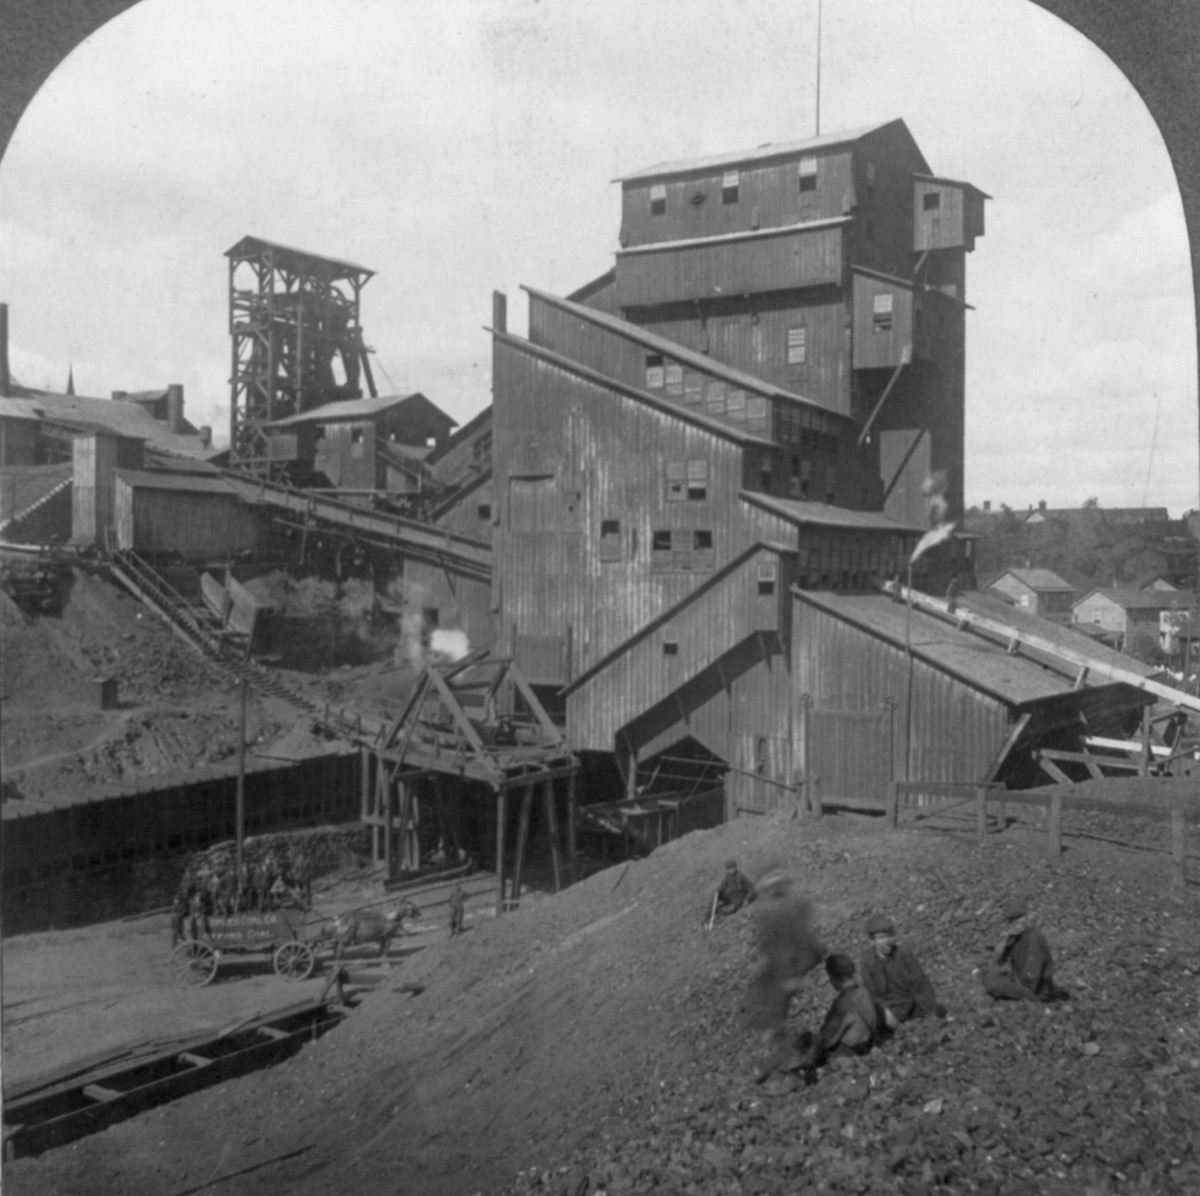
"Being here in Pennsylvania, some of the locations, especially … like northeast Pennsylvania, I think they have so much PTSD from coal mines. Then fracking came into town. … I've heard from so many people in these communities say, oh no, you're not getting me a third time. … We're hearing the same message: 'This is gonna be great for your community. This is gonna be awesome.' … I don't want to wait until they've failed us again."
This is the strand that is hardest to argue against with numbers. However large the investment totals and job estimates a developer presents, in a region that has received the same shape of promise twice, an estimate reads less as evidence than as recognition. Another line the researchers offered points at the same place. Maia Woluchem of Data & Society said that people in Pennsylvania "have incredible experience with industrial change, have deep lineages of industrial trauma, enough to sniff when things don't feel right to them."
3.4Fourth strand: the people who know cannot speak
The fourth strand is the industry's own way of doing deals. What the report adds here is brief: "Non disclosure agreements (NDAs) are part of what keeps the story hidden." Developers sign nondisclosure agreements with municipal officials while scouting sites, and the channel residents would ordinarily walk into with a question closes.
"The people they would typically talk to, those lines of communication in many instances are not open because those people have signed NDAs. That is something none of these communities are used to. Even with oil and gas, NDAs weren't really utilized that much, at least in the work that I've done in communities over the past five-plus years."
"The one thing I'm seeing across the board, across political spectrums and communities, is people upset that they feel the local power is being taken away. And they feel like it's not a democratic process. We saw this a lot with the proposed data center in Wampum, PA. As soon as people got word they started going to the municipal meetings. But all of those municipal leaders had signed NDAs. And so they would refuse to speak."
The report borrows a term from the anthropologist Amy Elizabeth Stambach for this structure and calls it a "corporate alibi," which it glosses as "a claim or evidence indicating that a person was elsewhere at the time of a crime, and, therefore, is not implicated." If an accident happens at a work site, legal responsibility sits with an Amazon subsidiary rather than with Amazon.com Inc. From a resident's position, even identifying who the counterpart in a negotiation is becomes impossible.
The instrument residents actually reached for on this strand was the public records request. In April 2026, the Concerned Citizens of Montour County released emails between the governor's office and Amazon's AWS developers in which the company complained about community pushback and threatened to pull out of its announced deals across the state. With the official channel shut, records requests took its place.
Many Strands, One Target
Laid side by side, the four strands look scattered. The person worried about an electricity bill and the person recalling the old mines are not telling the same story. So the most common way to summarize this opposition is to write that the reasons are too various to answer and stop there. Neither the report nor the article stops there. Both point at the same thing at the end of it.
The report's sentence runs like this. When a data center developer comes into town, often unannounced and under the radar, "residents who may otherwise be disengaged or disconnected have a focus for their frustrations with corporate greed, environmental destruction, rising utility costs, and disillusionment with democratic systems in a single material adversary." The researchers continue: "As an object that can be easily identified and critiqued, data centers are the material Achilles' heel for large systems of power."
What the report describes next is organizing. Over two years, thousands of people across rural areas, cities, coal towns, and suburbs showed up at town hall meetings, on Zoom, in Signal chats, and at the ballot box. The researchers write that these Pennsylvanians, "fueled by far-reaching desires and united by a common enemy," built coalitions. The summary in the concluding section is one line: "Americans feel lied to by government and by corporations. All these factors breed distrust that finds an outlet in this data center fight."
TechCrunch arrives at the same place. Immediately after calling the motives behind the activism a "patchwork quilt," the article writes: "The problem is trust." The name the researchers gave this coalition is quoted there as well. The piece reports them "calling it not bipartisan but post-partisan." It means less that Democrats and Republicans supported the same measure than that they gathered at a place where that axis does not organize the disagreement in the first place. The body of the report, though, describes the same organizing as "bi-partisan, cross-coalition organizing efforts." Two channels from the same team give the same coalition two different names, and that mismatch is the kind of thing the sixth section takes up.
4.1The diagnosis, though, is thirty years old
Treating "it comes down to trust" as something this study discovered would overstate it. Siting conflict research reached that place long ago. In a 2000 paper, Maarten Wolsink argued that the received idea of "wind power is fine but not in my back yard" is a very poor explanation of opposition, that the number of people behaving as free riders is minimal, and that the NIMBY construct itself damages wind deployment. The barrier he named was not resident attitudes but institutional capacity. In a 2005 paper, Patrick Devine-Wright concluded that the motive for opposition is not concern about spoiled scenery but the absence of control over the land use planning process and dissatisfaction with that procedure.
A 2017 review of thirty years of North American wind acceptance research put "NIMBY explanations are not valid" on its list of what the field had learned. Recent empirical work runs the same way. In a study of 300 residents in central Portugal, trust, perceptions of fairness, and substantive participation weighed far more heavily than procedural formality or technical knowledge, and awareness of the environmental impact assessment had no measurable effect.
Evidence running the other direction has to be set beside it. This literature does not support a single-cause account in which trust is the only root. In a 2013 study, David Bidwell reported that support for commercial wind projects rested largely on the economic benefits of the project. The same thirty-year review finds socioeconomic impacts strongly tied to acceptance, and noise and visual impacts strongly tied to opposition. A case study in Catalonia found NIMBY sentiment coexisting with environmental justice and procedural fairness concerns. No meta-analysis pooling effect sizes turned up in our search, so reading this as "the literature has proven it" would be one step further than the evidence goes.
4.2What is new is the object, not the diagnosis
So where does this study's contribution sit? The questions of trust and procedure confirmed over and over in wind and transmission recur with data centers, and data centers carry one property the earlier cases did not. Artificial intelligence is abstract and located nowhere. A data center lands on a map, carries a parcel number, and gets voted on in a township meeting room. That property is what the report means by "a single material adversary" and by "Achilles' heel." There is no obvious channel for protesting how a model was trained or how its training data was gathered, but there is a form to fill out to speak against a rezoning item.
The researchers attached a caution against letting any of this tip into cheerleading. Woluchem said: "We don't want to romanticize that everyone is having this kumbaya moment." In the same breath she said these fights are "incredibly organic." That means they are not a movement organized from above, and it also means they are not a movement neatly consolidated into one.
The Decision Gets Made in a Local Meeting Room
Where distrust turns into a vote is something the report states in one sentence: "Many people we interviewed talked about attending and speaking at municipal meetings about data centers, identifying these gatherings as key sites of decision-making about local development projects." Some attended to gather information and try to win a measure of transparency about development plans; others took a slot for public comment and used it to make their case against the project.
"At the local level is where we can stop these things. When people say to me, 'you're not going to stop this, like this AI thing is taking off.' And I'm like, I don't really think so. And now this big plan by the tech industry doesn't happen without these things being built. And as long as we have local control, they don't get built without local approvals. And that's where our voices are the loudest."
Whether that is an organizer's hopeful forecast or a description of a real bottleneck can be checked against the administrative numbers. They appear in the press release the Pennsylvania governor's office issued alongside the executive order signed on August 18, 2026. Four stages run from a proposal posted in a public database to a project that has actually collected its permits.
| Stage | Projects |
|---|---|
| Proposals posted in the public database | 100+ |
| In permitting discussions with the state environmental agency | 58 |
| Filed at least one permit application | 15 |
| Obtained every permit needed for phase one | 5 |
Figures confirmed in the Pennsylvania governor's office press release accompanying Executive Order 2026-05, signed August 18, 2026. The press release does not state a separate as-of date for each stage.
Five out of more than a hundred. Which segment of that funnel narrowed because of local opposition cannot be settled from these numbers alone. Financing that fell through, interconnection timelines that slipped, and developers that moved to another state all disappear at the same point. The sense of scale is clear, though. Between the number of projects announced and the number that can actually break ground there is a gap of more than twentyfold, and a good part of that gap sits inside local procedure.
5.1The institutions followed and conceded the point
That same executive order contains a clause that meets the organizer's statement exactly. The state environmental agency will not issue any permit to a project before it has secured every local approval it needs. The order further bars nondisclosure agreements related to data centers and removes data center proposals entirely from the state's permit fast-track program. Noncompliance costs a project its eligibility for the sales tax exemption on data center equipment. This blog covered the clauses and their background separately in August, so they are not repeated here.

Nor did the institutions move first. The report notes that this pushback has been cited as one reason for the governor's GRID framework, which responds to rampant concern about high utility costs. Protest over utility bills is what drew the framework out.
Timing and speaker have to be kept apart when reading the next part. The line describing that GRID framework as relying on "voluntary agreements that fail to adequately hold companies accountable" is not the researchers' own assessment but a rendering of residents' skepticism. The framework incentivizes developers to build their own power sources, and residents doubt this will work. And what that skepticism took aim at was the May guidance stage. The August executive order laid a penalty on top of it, the loss of the sales tax exemption. Blend the two moments and a criticism the report did not make gets attributed to the report.
The sequence itself belongs to this section's argument. In July 2025 the governor took the stage at the Pennsylvania Energy and Innovation Summit at Carnegie Mellon University to celebrate $90 billion in private investment. A year later the same person signed an order imposing new requirements on data center projects and removing them from a regulatory fast-track initiative. TechCrunch added one line at that point: "Someone read the writing on the wall."
5.2The room holds supporters as well
Supporters sit in the same room. TechCrunch wrote that trade unions are perhaps the greatest source of support for data center projects. Acknowledging that once built these facilities will not be major sources of employment, unions see the projects as a lifeline to rebuild their ranks. The industrial memory from the previous section runs in the opposite direction here. Having lost jobs makes one side wary and gives the other side something to hope for.
The report records that support in much more detail. The North America's Building Trades Unions celebrated a collaboration with OpenAI to support data center construction, and at the March 2026 PA Data Center Energy and Innovation Summit a panel called "Meet the Builders" seated representatives of five of the region's largest trade unions together. That panel was moderated by a senior vice president of Aon, a company that sells risk management, insurance, and resilience planning to data center developers. Nor is the union side unaware of a possible bubble. One labor leader said that if they do their jobs and state what is reasonably achievable on a real construction schedule, they can turn that curve into more of a bell curve, and that they are in a unique position to help shape it.
The same report carries testimony pointing the other way. One interviewee said that even if the promise holds that the jobs inside a data center will be union jobs, "there won't be a lot of them." Another remarked that union strength made it hard to engage with municipal leaders, who would not organize against the union. The researchers write that this configuration scrambles traditional political alliances, at times pitting the building trades against community groups organizing toward the public interest in the same room.
That industrial memory gets used by both sides is not this article's observation but something the report heard directly. An organizer in Carlisle put it this way.
"If somebody does not want a data center, or a natural gas processing plant, or whatever, they can very easily invoke Pennsylvania's rich history of being sort of an industrial wasteland, because we've built all these things, but what has it gotten us kind of thing, right? ... And then the people who want this stuff can say basically the same thing, like, we, you know, our steel is in the Empire State Building, and we helped win World War One, and you know, all that stuff."
The report sorts the grammar the boosters lean on into three: national identity and war, industrial nostalgia, and the revitalization of labor. The middle one is the material the organizer just described. The same history serves as grounds for opposing a project and as grounds for courting one.
Decisions in that room have already reversed projects. The report states that several projects have been stopped across the state, that Senator Katie Muth has proposed a state-wide moratorium, and that lawmakers on both sides of the aisle express their reservations about this trajectory. What the report does not contain is a project-by-project list of which ones stopped and why. The counting problem taken up later shows up right here as well. Outside the state there is a cleaner case. The city this blog covered in July, which blocked a data center by ballot, is one. That city is in California, though, and the field followed here is Pennsylvania. State institutions and power markets differ, so it is safer not to file the two as the same case. Nationally, one private tracker, Data Center Watch, says it counted 45 projects disrupted by local opposition in the second quarter of 2026. What that count is a count of is the material for the next section.
This blog has previously treated the bottleneck in AI infrastructure as electricity. What that article saw was a physical constraint of generating capacity and interconnection queues. The place this one is looking at sits one step earlier. Before it is settled whether power can be brought in, it is settled whether building on that parcel is allowed at all. And that gets settled by a show of hands in a municipal building.
There Is Still No Yardstick for Any of This
Everything up to here has carried across what the report, the surveys, and the administrative documents wrote down. This section is different. Set those materials side by side and one structure recurs in three places, and reading those three as one thing is our interpretation rather than a claim any of the sources makes. Please read it as separate.
The first section showed that the opposition rate shifts with the question. Carry that observation outside of opinion polling and the same thing is happening on a much wider field. The three kinds of numbers that tell you how big this fight is, how many data centers exist, how much was derailed by opposition, and how many jobs a new project creates, all wobble in the same manner. Not because the values are wrong, but because the definitions that produced them differ from one source to the next.
6.1First exhibit: seven counters, nine different answers
Asking how many data centers are in Pennsylvania looks like a fact-check question. Gather the places that have an answer, though, and seven counters yield nine values. Below are the counting bodies we were able to confirm and the figures they publish, with what each one counted written next to the bar.
Bar length is proportional to the count. The as-of dates range from July to September 2026 and differ from one another, and the present-day values from FracTracker and the Data Center Proposal Tracker could not be reproduced because those maps render dynamically. The figures shown are either as of the date the report cited or as published by each counter. What Aterio's 400 includes could not be confirmed.
Between 13 and 400 lies a factor of more than thirty. The interesting part is that the report itself flagged the discrepancy first: "Since these projects are fed by different community data, and define data centers in different terms, a discrepancy in what they show is to be expected." The researchers then point at the deeper need these mapping tools share. Communities want to know who the actors behind these developments are and how many data centers there are.
The reason seven counters produce nine values sits in the same place. FracTracker counts facilities in operation and proposed projects separately, publishing 219 and 41 together, and the Data Center Proposal Tracker recorded 156 projects under review in July and then 137 in September by adding active and proposed sites together. Even within one counter, changing what gets counted changes the answer. None of that makes any of these nine values fabricated. Count only what carries an OpenStreetMap tag and 13 is correct; include small leased facilities and the number runs into the hundreds. The problem is not the values but that the entity definition circulates unagreed while the values circulate freely. The body of the report adds 71 active sites and 66 proposed to arrive at 137 as its baseline, while the same report's summary writes "more than 137." Two phrasings split inside a single document.
Why it stays unsettled what counts as a data center is answered earlier in that same report. Several types live under the name. A typology of this infrastructure includes AI data centers, enterprise, managed services, colocation, cloud and edge data centers. Only one of those types comes with a numeric threshold attached. Citing the infrastructure scholar Lauren Bridges, the report defines hyperscale data centers as infrastructure containing "at least 5,000 servers, covering more than 10,000 square feet, and with over 40 megawatt (MW) capacity." No such threshold appears for the rest. That is why each counter ends up deciding for itself how far down to count.
Where these nine values came from is also written in the same report. The researchers classify these maps as one branch of the opposition. Alongside environmental groups, groups emerging from specific local fights, and groups expanding the fight into adjacent agendas such as utility costs, housing, and immigration, they set a category called civic science, and their example for it is the Data Center Proposal Tracker. That is the counter appearing twice in the chart above.
The researchers spoke with the person who built it, a former Pennsylvania resident who used her background in computer science to create the tracker. She learned that a data center was going up near her hometown, kept hearing about more proposals, and started mapping them because she could not find much information in one place. After watching one of the municipal council hearings, she added layers. Coal mines went on first. As she told the researchers, "I wanted to chart it against coal mines, because growing up in northeastern PA, coal was such a major part of our economy, and Scranton's identity." Power stations, substation locations, and power lines followed. The materials were Wikipedia and government websites, crowdsourced tips from other local residents, and FOIA requests.
The researchers borrow Tamara Kneese's term for work like this and call it counter-data. And they name one more cause of the mismatched values besides differing definitions: the data center industry's strategic opacity. So these nine values are nine answers taken with nine different rulers, and at the same time the record of individuals each filling in a place where the public ledger is blank. What this section is counting is not that the tallies are shoddy but that counting how many data centers a state holds is still being done by volunteers.
6.2Second exhibit: what "blocked" means comes first
The article that set this one going wrote in its lead that data center projects worth $68 billion were disrupted by local opponents in the second quarter of 2026. The source is a tracker called Data Center Watch. The figure has a quotable shape. A large dollar amount, a quarter attached to it, a named source. Viewed from this section, though, the number is exactly the same kind of object as the tracker list above.
Start with who runs it. Data Center Watch is a project of 10a Labs, an AI security and intelligence company. The analyst who wrote the report said they hold no financial or ideological stake in data center development, and the method combines AI tools such as large language models with human analysts to monitor local news, municipal meetings, and social groups. The funding is not disclosed. When one outlet pointed out that the relationship with 10a Labs had not been disclosed, the response was that the money does not come from AI clients, without saying who it does come from.
The meaning of the word "blocked" matters more. This tracker's definition includes cases in which a company withdraws an existing project and then files a similar new proposal at a nearby site. What that produced showed up in one trade outlet's check of the numbers. Of the $18 billion recorded as blocked in the first two years of the tally, $14.5 billion was two such withdraw-and-refile cases. Projects that moved across the road rather than disappearing accounted for 80% of the dollars. The vocabulary also wobbles by quarter. Within the same coverage, "blocked," "blocked or delayed," and "disrupted" appear interchangeably.
Comparing across quarters calls for care too. By this tracker's own count, the first quarter of 2026 held 75 projects worth roughly $130 billion, and the same counter described that as the most disruption recorded in any three-month stretch since it began tracking in 2023. The second quarter's 45 projects and $68 billion is the smaller figure. Using the second-quarter number as a peak therefore contradicts the same counter's own preceding quarter. There is one reason the figure was kept here rather than discarded. To hold the ruler it applied to opinion polling in the first section against the number that started this article.
6.3Third exhibit: ten thousand jobs hanging on a footnote
The third is the smallest and the sharpest. The developers of the Homer City redevelopment project cited in the report claim it should generate over 10,000 jobs. The report attaches a caveat right below it: "A small footnote clarifies that this number refers to 10,000 construction jobs over a five-year-period." Local community members opposing the project argue that the construction jobs will be over as soon as the facility is built, and that they may not go to state residents, since contractors commonly travel the country from project to project. Elsewhere the report puts it plainly: data centers do, once constructed, require very few employees to maintain.
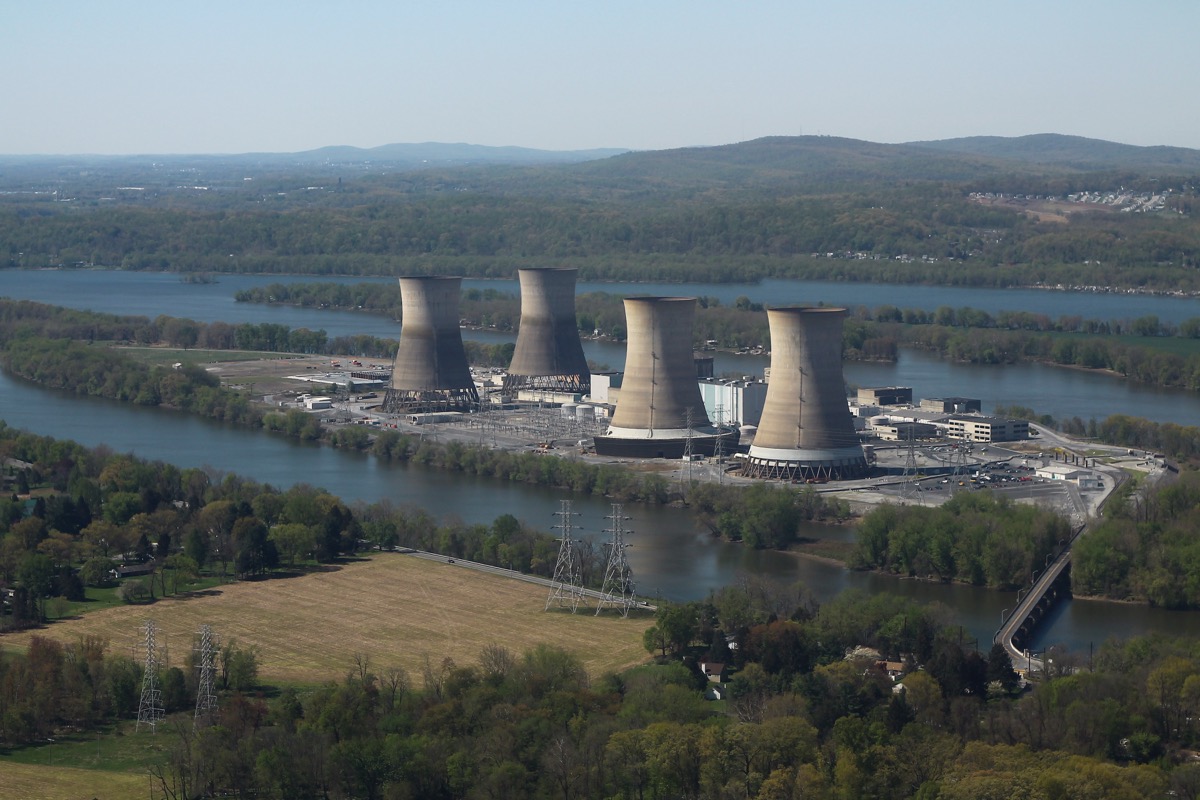
One more figure calls for the same caution. The 3,400 jobs and $16 billion that travel with the Crane Clean Energy Center project restarting the Three Mile Island reactor. That estimate comes from a study commissioned by the Pennsylvania Building and Construction Trades Council. This does not say the value is wrong. It says that copying it across as an independent estimate makes the commissioning party disappear.
6.4The three exhibits have the same shape
Set the three cases side by side and the structure matches. In the surveys, question wording and the construction of the answer options made the number. In the trackers, what counts as a data center made the number. In the project promotion, which employment over which period gets counted made the number. In all three the value was honestly computed, and in all three the meaning changes unless the definition travels with it. And in all three the definition lives in a footnote, in a methodology appendix, or in a document that is not public at all.
So this debate still has one blank in it. There is no public ledger that measures, on a single ruler, what one data center leaves behind in a community and what it takes away. Electricity prices have separate statistics backing the direction, and permitting progress is counted by the state, but property values have no measurement, facility counts differ by definition, and the scale of what opposition derailed comes from a counter that lets the word move. If you were drawing a cost sheet for artificial intelligence computation, this says there is a column on it that has not been named yet. An empty column does not mean the cost is absent. It only means someone else is writing it into their own ledger.
Why Pebblous Is Watching
The problem this article has been following is not confined to data centers. It has the same shape as a problem Pebblous meets repeatedly in AI-Ready Data work. The three passages below are not about a product. They are about how the structure the preceding sections displayed reappears in data quality practice.
7.1Does the label set have a "hold judgment" box?
What the first section showed was not a change in opinion but a change in numbers produced by the form of the measurement. Section 1.3 lays out the shape of it. Whether a third door stood open decided whether the same thoughts of the same people got written down at one figure or at nearly double it.
This happens daily in annotation work. Whether the taxonomy carries a "hold judgment" or "not applicable" box decides the distribution of the same source data. Without the box, ambiguous cases get pushed into one side or the other, and the proportion pushed that way sets the boundary the model learns. Ambiguous cases cluster near the boundary, so that forced assignment shakes the middle of the decision surface rather than the tail of the distribution. A distribution is not a transcription of reality. It transcribes reality together with the shape of the form used to transcribe it.
7.2Schema validation does not reach this layer
The numbers in the sixth section cut sharper. The count of data centers in one state runs from thirteen to four hundred, and the report itself wrote down the reason. Each counting body decides differently what to call a data center. This is the first chapter of any data quality textbook. A count taken before the entity definition is agreed is not yet a count.
What deserves attention is which layer the failure occupies. All nine lists the seven counters produced are schema-valid. No required field is empty, no type is mismatched, no key is duplicated. Run a tool that checks null rates, uniqueness, and value ranges and all nine pass. And there are still nine answers. Among the checks we have been running, none asks whether the thing this row counts is the same thing that file counts. When this happens in training data, we call it model bias, much later.
7.3When you take a number, do you keep the question too?
The second exhibit in the sixth section is the ground for this paragraph. Depending on how far one tracker stretched the word "blocked," a project that moved to the parcel next door was counted as a project that had been stopped. The number was not wrong. The word was wide.
For an organization building AI infrastructure or building services on top of it, the question this article hands back is single. On what definition were the external numbers we use in decisions made? The line "60% of Americans are opposed" goes straight into an investment judgment or a siting strategy, and that 60% is an average across questions that measured different things. Whether you store the question wording and the answer options alongside the number, or copy over the result only, is the fork. This is not a matter of research hygiene but of how far provenance goes into the design.
There is only one position Pebblous can claim in this article. That it has practical experience in keeping, next to a value, the record of the definition that value was built on. As a small example, articles on this blog ship with the provenance record of the pipeline that produced them. Which stage was handled by which model and which checks it passed goes into the page configuration. We take the view that a reader should be able to re-examine the numbers written here.
Sections one through five carry across what was confirmed directly in each survey's own topline and release, the full 78 pages of the report, the Pennsylvania governor's office press release, and the originating article. English quotations appear here as they stand in the originals. The sixth section is this article's reading of those materials read together, and the seventh moves that reading over to data quality. What could not be confirmed is on the record too. We did not find empirical research on property values, and the present-day values for some trackers could not be reproduced. Thank you for reading this far.
References
The figures in this article come from three strands. Items 1 and 2 are the report and the article this piece is built on; the report was read in full at 78 pages and the article in full. Items 3 through 9 cover the surveys in the first section's table, each cited to what the polling organization itself put out; for the two whose pages were blocked, the values were checked against another posting by the same institution. From item 10 onward come the methodology papers, the siting-conflict research, and the institutional and counting documents.
The spine of this report
- 1.Woluchem, M., Garofalo, L., de Assis Nunes, A. C., Mukogosi, J., & Sum, C. (2026). The AI Factory: Data Centers, Power, and Resistance in Late Industrial Pennsylvania. Data & Society Research Institute, 2026-09-21. datasociety.net (PDF, 78 pp.)
- 2.Fernholz, T. (2026-09-22). "Everyone can find a reason to dislike data center construction." TechCrunch. techcrunch.com
Surveys (original toplines and releases)
- 3.AP-NORC Center for Public Affairs Research & Energy Policy Institute at the University of Chicago (2026). 2026 AP-NORC/EPIC Energy Survey topline. apnorc.org (PDF)
- 4.UMass Poll (2026-09). National Public Opinion Poll. Field 2026-08-21–26, N=1,000. umass.edu
- 5.Annenberg Public Policy Center / SSRS (2026-08). "Opposition to local data centers rises sharply." The original page was blocked, so the values were checked against the University of Pennsylvania posting. almanac.upenn.edu
- 6.Gallup (2026-05-13). "Americans Oppose Data Centers in Their Area." Field 2026-03-02–18, N=1,000. news.gallup.com
- 7.Reuters/Ipsos (2026-06). June 2026 poll, N=4,531, KnowledgePanel. ipsos.com
- 8.Fox News Poll (2026-07). Beacon Research + Shaw & Company Research, 1,003 registered voters. foxnews.com
- 9.Heatmap Pro / Embold Research (2026-08). 2,045 registered voters. Commissioned in house by a climate and energy outlet. heatmap.news
Survey methodology
- 10.Elkjær, M. A., & Wlezien, C. (2024). "Estimating public opinion from surveys: the impact of including a 'don't know' response option in policy preference questions." Political Science Research and Methods.
- 11.Krosnick, J. A., et al. (2002). "The Impact of 'No Opinion' Response Options on Data Quality: Non-Attitude Reduction or an Invitation to Satisfice?" Public Opinion Quarterly, 66, 371–403.
- 12.Schuman, H., & Presser, S. (1981). Questions and Answers in Attitude Surveys. Academic Press.
Siting conflict and acceptance literature
- 13.Wolsink, M. (2000). "Wind power and the NIMBY-myth: institutional capacity and the limited significance of public support." Renewable Energy.
- 14.Devine-Wright, P. (2005). "Beyond NIMBYism: towards an integrated framework for understanding public perceptions of wind energy." Wind Energy.
- 15.Rand, J., & Hoen, B. (2017). "Thirty years of North American wind energy acceptance research: What have we learned?" Energy Research & Social Science. osti.gov
- 16.Bidwell, D. (2013). "The role of values in public beliefs and attitudes towards commercial wind energy." Energy Policy.
Institutions and counting
- 17.Commonwealth of Pennsylvania (2026-08-18). Executive Order 2026-05, press release. pa.gov
- 18.Data Center Watch (10a Labs) (2026). Q1 and Q2 2026 reports. Its definition of "blocked" and who operates it are examined in section 6.2. datacenterwatch.org
- 19.Judge, P. DatacenterDynamics. "Group claims $64bn in US data center projects impacted by local opposition in last two years." A check on Data Center Watch's definition of "blocked." datacenterdynamics.com
Adjacent Pebblous articles
- 20.Pebblous, "AI Hit a Wall This Summer, and It Wasn't Chips or Money." report/ai-datacenter-power-wall-2026
- 21.Pebblous, "Pennsylvania's Blanket Ban on Data Center Nondisclosure Agreements." blog/pennsylvania-data-center-nda-ban
- 22.Pebblous, "Monterey Park Bans Data Centers by Ballot." blog/monterey-park-data-center-ban
- 23.Pebblous, "Nature Urges Scientists to Move AI Off Mega Data Centres." blog/ai-mega-datacenter-open-weight-shift