Executive Summary
This report follows one sentence back to the charts it came from. Over a single weekend in late October, the line that AI has delivered zero financial payoff to corporate America outside tech traveled around the world. It opens a five-chart daily note by Torsten Slok, chief economist at Apollo Global Management. To settle the first question straight away: Slok's figures are all correct. The gap sits between what the charts show and what the headline says, and four choices fit inside that gap.
We downloaded the original chart images and read them off the axes. The widely quoted "starts at about $550,000" is not where the line begins but the floor at the end of a three-year decline, and the profit margin of the S&P 493 (the S&P 500 minus the Magnificent 7) now sits slightly above its pre-pandemic level. The spending concentration table has seven rows; coverage carried the top two or three. The bottom rows record the same concentration for line items that have nothing to do with AI, and that table and the chart after it come not from large listed companies but from the customer base of Ramp, a US corporate card firm. The five charts move across three different populations, and only the first two of them cover the S&P 493.
Nine days earlier, Jeremy Pearce of the Federal Reserve Bank of New York recomputed a metric of the same name from listed-company filings and reached the opposite conclusion: three times the 2010s rate. The two analysts held source data of the same kind. What differed was the price deflator, the population, and what exactly was being measured. That much is fact. What follows is interpretation. "The payoff is zero" and "a company-wide income statement cannot resolve an effect this small" are different pieces of arithmetic, and the second is all the present evidence will carry. Anyone who wants to tell an executive team "it is working here" has to fill in four boxes before reaching for a bigger number: when the measurement starts, what gets called by that name, whether the group that did not adopt was recorded too, and who is being measured.
1.6% / 0.9% a year
Growth in revenue per worker since Q1 2019, Magnificent 7 versus S&P 493
Big Tech is about 1.8 times faster. That gap is real. "One rises and the other is zero" is not
9.5% → 10.3%
S&P 493 profit margin, 2019 to the latest point
Up about 0.8 points, above the pre-pandemic level. In between came a 6.5% trough and an 11.7% peak
91.8%
Share of non-AI SaaS spending taken by the top 10% of firms
It sits further down the very table that carries the 99.5% AI figure. The control group was printed alongside
2.2% a year
Growth in revenue per worker for 2019–2025 as the New York Fed computes it
The 2010s rate was 0.7% a year. A metric of the same name gave the opposite answer nine days apart
How five charts became one sentence over a weekend
Apollo Global Management's Daily Spark is a chart note its chief economist publishes every weekday. The 24 October 2026 edition ran to five charts with a short opening paragraph. In character it is closer to a daily memo than to a research report. What loaded a short memo with the weight of a research program was not Slok but the coverage that carried him.
Set the note's first sentence next to its last. They do not say the same thing.
First sentence — "Despite massive investments and widespread hype around artificial intelligence, the technology has delivered zero financial payoff to corporate America outside of tech."
Last sentence — "The bottom line is that the AI story will be decided in the S&P 493, not the Mag 7, and so far, there is no evidence that revenue growth or margins are improving outside the tech sector."
The Magnificent 7 here means Apple, Microsoft, Nvidia, Amazon, Alphabet, Meta and Tesla; the S&P 493 means the other 493 members of the S&P 500. The split exists to strip out the way Big Tech earnings lift the index as a whole. Back to the two sentences: the first asserts that there is no payoff, the second observes that there is no evidence of improvement. "Zero payoff" and "no evidence ... improving" are not the same claim. The one that traveled was the first. Bloomberg's headline read "AI Provides Zero Payoff to S&P 493 Outside Tech." In Korean-language coverage, AI Times carried the note while flagging that a payoff of zero and a payoff nobody can see are different things, and that the note supplies no figures on how much was invested, which business functions adopted AI, or how much was saved. That distinction is what section 6 of this report picks up. Slok himself steps back to the more careful position inside his own note.
The five charts are also not a record of one group. Sorting out which chart covers whom puts everything that follows in its place. The table below is the map for this whole report.
| Chart | What it shows | Population | Source line |
|---|---|---|---|
| 1 | Revenue per worker | S&P 500 listed companies (split into Magnificent 7 and S&P 493) | Bloomberg, Macrobond |
| 2 | Profit margin | Same as above | Bloomberg, Macrobond |
| 3 | Total factor productivity and output per hour | The entire US nonfarm business sector | Federal Reserve Bank of San Francisco, US Bureau of Labor Statistics |
| 4 | AI spending concentration | Ramp customers (more than 85,000 businesses, mostly small and mid-sized) | Ramp chief economist |
| 5 | How firms are funded | Same as above | Ramp AI Index |
The five charts in the Apollo Daily Spark of 24 October 2026, sorted by the population each one covers. Ramp is a US corporate card and spend management company; charts 4 and 5 draw on card transactions from its customers.
With the map open, one thing stands out immediately. The note closes on "the AI story will be decided in the S&P 493," yet the last two of the five charts do not cover the S&P 493 at all. Chart 3 is the whole US economy; charts 4 and 5 are card transactions at small and mid-sized American firms. Only the first two charts actually measure the group the conclusion names. Sections 2 through 4 of this report follow those three populations one chart at a time.
Two of the five charts have a history behind them. As far as we could verify, the concentration table appears to have run already in an Apollo note dated 24 September, and the productivity chart in another dated 5 October. We could not confirm either against Apollo directly, so we put it no more strongly than that. Reusing charts is ordinary practice in analyst notes and is no fault in itself. What does stay with you is the closing line of the 5 October note: "The productivity payoff from AI remains a forecast rather than an observation." Nineteen days before the sentence that traveled, the same author wrote that.
Start the line in 2019 and the picture changes
The first choice is the baseline date. Chart 1 plots revenue per worker: revenue divided by headcount, deflated to Q4 2019 prices. Coverage mostly carried a single sentence about it. The seven Big Tech firms rose from roughly $550,000 in 2022 to roughly $800,000 in 2026, while the other 493 have not moved from about $525,000 since 2019. Open the original image and follow the gridlines, and neither half of that sentence matches the shape of the lines.
The Magnificent 7 line does not begin in 2022. It begins at about $697,000 in Q1 2019. The $550,000–$560,000 range is not a starting point but the Q1 2023 floor (about $565,000), the bottom of a three-year decline. That decline has nothing to do with AI. It is the tail end of the period when Big Tech hired heavily after the pandemic, and a growing denominator pushes revenue per worker down. The table below holds the values we read off the original. These are gridline readings, so every figure is approximate.
| Point on the line | Magnificent 7 | S&P 493 |
|---|---|---|
| Q1 2019 (where the line starts) | ~$697,000 | ~$493,000 |
| Q1 2020 (pandemic spike) | — | ~$528,000 |
| 2021 (S&P 493 trough) | — | ~$464,000 |
| Q4 2022 (S&P 493 peak) | — | ~$548,000 |
| Q1 2023 (Magnificent 7 trough) | ~$565,000 | — |
| Latest point | ~$785,000 | ~$527,000 |
Gridline readings from the original image of chart 1 in the Apollo Daily Spark of 24 October 2026. The last label on the horizontal axis is Q1 2026, but the lines run past it, so we call the final point "latest" rather than pin it to a quarter. Three research tracks read the values independently and agreed to within five units.
Drawn as lines, the same values show how far apart the two groups actually sit. The figure below starts its vertical axis at zero. Apollo's original starts at $450,000, and that crop makes the gap between the two lines look wider than the ratio warrants. Neither choice is wrong. Truncating an axis is routine in financial charts; the choice just changes the impression the picture leaves.
A sketch joining the readings in the table above. It does not carry every intermediate quarter, and the vertical axis runs from zero so that the ratio between the two lines shows as it is.
Take the whole line and the arithmetic changes. From Q1 2019 to the latest point, the Magnificent 7 are up about 12.6%, which works out to roughly 1.6% a year. Measured from the Q1 2023 floor, the same line is up about 38.9%. Same line, same end point, a number more than twice as large. The widely quoted "$550,000 to $800,000" uses the second baseline.
The S&P 493 side works the same way. Saying it "has not moved since 2019" erases everything in between. The line jumped once in Q1 2020 on the pandemic spike, fell to about $464,000 in 2021, and climbed to about $548,000 by Q4 2022. Trough to peak is about 18.1%, over a stretch when the post-pandemic reopening and cost pass-through overlapped. End to end it is about 6.9%, or roughly 0.9% a year. The line is not flat. It went up, came back down, and now sits a little above where it started.
To be fair about it: the Magnificent 7 did grow faster. That is true. At 1.6% a year against 0.9%, they grew about 1.8 times as fast, and this report does not dispute the gap. What it disputes is the binary of "one rises and the other is zero." A gap of 1.8 times and a claim of zero are different assertions, and the charts support the first.
2.1A flat line carries less information than it seems to
Pebblous adds one point that is not in Slok's note. Revenue per worker has revenue on top and headcount underneath. For the figure to rise, revenue has to grow or the workforce has to shrink. If the first route AI takes into a company's income statement is labor savings, then revenue per worker is the metric where that effect should surface earliest.
The denominator, though, has barely moved. In a study of US Census Bureau data, 66% of firms that had adopted AI said they did so to augment their workforce, while 2% said the goal was to cut employment. If headcount holds steady and the line stays flat, what the flatness tells us narrows to "nothing visible on the revenue side either." That is a different sentence from "AI did nothing." Read a metric past the range of what it can carry, and from that point on it is the reader talking, not the chart.
'Stuck' is a word someone chose by eye
The second choice is definition. Chart 2 plots the two groups' profit margins quarter by quarter, and coverage rendered those lines as "stuck at 30% versus 10%." Both numbers are about right at the end points. The trouble is "stuck." That word is not printed on the chart; it is what someone chose after looking at the slope. Follow the gridlines and different numbers come out.
| Point on the line | Magnificent 7 | S&P 493 |
|---|---|---|
| 2015 (where the line starts) | ~11% | ~8.4% |
| 2019 | — | ~9.5% |
| Q2 2020 (pandemic trough) | — | ~6.5% |
| Q1 2022 | ~22.4% | ~11.7% (series high) |
| 2023 | ~13.9% (Q3) | ~9.3% |
| Latest point | ~29.8% | ~10.3% |
Readings from the original image of chart 2 in the Apollo Daily Spark of 24 October 2026. The 2019 value for the Magnificent 7 is omitted because the research tracks disagreed widely on where that point sits.
The S&P 493 margin runs from about 9.5% in 2019 to about 10.3% at the latest point. That is a gain of roughly 0.8 points, leaving it above its pre-pandemic level. In between it fell to about 6.5% in Q2 2020, then hit the series high of about 11.7% in Q1 2022, slid back to about 9.3% in 2023, and has climbed to where it now stands. The shape is a deep valley followed by a high ridge.
The figure below adds the Magnificent 7 line. The difference in height is the first thing you see, but the part worth attention is the shaded band in the middle rather than the gap. For both groups, the largest movements cluster there.
Drawn the same way as the figure above. The Magnificent 7 line connects only the points we could fix with confidence, and the shaded band covers 2020 to 2022.
The Magnificent 7 side yields something more consequential. The step up in this group's margin falls between 2020 and 2022, from about 11% to about 22.4%, a doubling that happened before ChatGPT launched and before enterprise AI adoption began. The line then dropped to about 13.9% in Q3 2023 before climbing to about 29.8% at the latest point. For both groups, the large moves came first and AI came after. Chart 2 is hard to use either as evidence of an AI effect or as evidence against one.
Chart 1 starts in Q1 2019 and chart 2 starts in Q1 2015. Two charts in the same note use different baseline years, which means you cannot assume that two panels sitting side by side are being read on the same scale. And whether the "profit margin" in chart 2 is net, operating or gross margin is not stated on the chart. That blank matters again in section 5: the margins the New York Fed computed over the same period are gross and operating margin, and under a different definition the same company in the same quarter produces a different number.
The control group is three rows down the same table
The third choice is the control group. The fourth panel in the note is a table showing, line item by line item, how much of each category of spending the top 10% of firms account for. Coverage carried the top two or three rows: the top decile takes 99.5% of spending on model serving and inference, and 95.6% of the money going to OpenAI and Anthropic. Both figures are printed in the table exactly that way, and both are correct. The table, though, has seven rows.
| Spending category | Top 10% of firms | Bottom 90% of firms |
|---|---|---|
| Model serving and inference | 99.5 | 0.5 |
| Neoclouds | 99.0 | 1.0 |
| Cloud computing | 95.7 | 4.3 |
| OpenAI + Anthropic | 95.6 | 4.4 |
| SaaS (excluding AI) | 91.8 | 8.2 |
| Paid advertising | 91.9 | 8.1 |
| Customer relationship software | 84.2 | 15.8 |
All seven rows of chart 4 in the Apollo Daily Spark of 24 October 2026. The three rows in orange are the AI categories coverage mostly quoted; the three bold rows at the bottom are the categories that have nothing to do with AI. "Neoclouds" are the newer cloud providers that rent out GPUs.
For software spending with no AI in it, the top 10% still take between 84% and 92%. The three AI categories (model serving and inference, neoclouds, OpenAI plus Anthropic) average 98.0%; the three non-AI categories (SaaS, paid advertising, customer relationship software) average 89.3%. The gap is 8.7 percentage points. These are unweighted averages of three rows each, and we say so.
99.5% is higher than 91.8%, which is true. But the difference runs to single-digit percentage points, and the larger fact in the same table sits elsewhere. Concentrated spending is not a feature of AI; it is the normal distribution of corporate software spending. To prove "only a handful of firms use AI" from this table, the same logic would have to yield "only a handful of firms use customer relationship software." It was Apollo that printed the control group in the same table. That is why this re-check was possible from outside.
This table leaves out three things as well. It carries no units, no collection period, and no statement of what "top 10%" is the top 10% of. Ranked by total spending, by spending in that category, or by company size, the same slot fills with different firms. The problem is less the size of the numbers than the fact that you cannot reconstruct whose share they are.
4.1The note itself says the big spenders sit outside the S&P 493
The fifth panel sorts firms by how heavily they spend on AI and shows how each band is funded. Among the heaviest spenders, 80.4% of the top 1% are venture-backed companies. At the median firm the figure is 13.1%. Eight in ten carrying venture money means the firms driving AI spending are not large listed corporations.
The dollar amounts point the same way. For September 2026, Ramp puts monthly AI spending per employee at $15.70 for the median firm, $813.43 for the top 10%, and $9,567.53 for the top 1%. Median to top 1% is a factor of about 609. Same country, same month, same data set, and a three-digit multiple between the ends of it.
The return on money you never spent is not zero; it is undefined. That no AI effect shows up in S&P 493 financial statements is closer to a premise than to a conclusion, because the spending that would form the numerator is concentrated outside that group. Slok's own purpose with this chart was presumably different. Read as evidence that AI is still confined to a very small slice of the economy, the chart holds up. What it cannot do is support the zero in the opening sentence.
Three conditions have to travel with every figure in this section. First, the data behind charts 4 and 5 are Ramp customer transactions. Ramp is a US corporate card and spend management company; by its own published count it serves more than 85,000 businesses, most of them small or mid-sized. This is not a tally of large listed firms, so rendering it as "99.5% of American companies" would be committing the very thing this report objects to. Second, "venture-backed" does not extend to saying that the venture money was spent on AI. It describes how the firm is funded, nothing more. Third, Ramp has been reported to exclude spending that runs through free tools or personal accounts, a share thought to be substantial. We could not confirm this directly, so we attribute it to the reporting.
Nine days earlier, the New York Fed read the same metric the other way
The fourth choice is the population, and an experiment showing what that choice does happens to be sitting in public. Nine days before Slok's note, on 15 October 2026, a post by Jeremy Pearce went up on Liberty Street Economics, the Federal Reserve Bank of New York's blog. The metric carries the same name: revenue per worker. The source data are of the same kind: listed-company filings. The conclusion was the opposite.

| Metric | 2010–2019 | 2019–2025 |
|---|---|---|
| Real revenue per worker (Compustat listed firms) | 0.7% a year | 2.2% a year |
| Gross margin | 34% | 37% |
| Operating margin | 16% | 18% |
Jeremy Pearce, Liberty Street Economics, Federal Reserve Bank of New York, 15 October 2026. Compustat is a financial database of listed companies. The two margin rows are levels at either end of the period, not growth rates.
A metric of the same name becomes "essentially standing still for seven years" in one account and "running at three times the 2010s rate" in the other. Pearce's calculation has growth in revenue per worker rising from 0.7% a year to 2.2% a year, a multiple of 3.1. Neither analyst was rebutting the other, and neither misread their data. The two accounts part company in three places.
| Where they part | Slok (Apollo) | Pearce (New York Fed) |
|---|---|---|
| Price deflator | One deflator for everything, Q4 2019 base | Industry-specific output prices |
| Population | S&P 500, financials included | Compustat manufacturing and services, excluding finance, real estate, utilities, agriculture and the public sector |
| What is computed | The slope of a level (dollars) on a chart | An annual growth rate (%) |
| Margin definition | Not stated on the chart | Gross margin and operating margin |
The fourth row is the blank noted in section 3. Because the definition behind Slok's margin is absent from the chart, the two analyses cannot be lined up on that axis at all.
Take the deflator first. Deflating by industry-specific output prices trims revenue growth in industries where prices rose steeply; deflating everything to a Q4 2019 base applies one yardstick across all industries. The population matters just as much. Whether finance, real estate and utilities are in or out decides which bundle of companies the phrase "the average US listed company" actually points to. And computing a growth rate is a different exercise from eyeing the slope of a level on a chart. The first produces a number; the second produces a word. "Stuck," in section 3, was a word produced the second way.
Two things have to be said alongside this. First, Pearce does not attribute the acceleration to AI. What he reports is a correlation with R&D intensity: firms whose R&D-to-revenue ratio was 10 points higher in 2019 saw operating markup growth roughly 0.7 points higher over 2019–2025. He leaves causation to later work. Holding Pearce up as a rebuttal to Slok would commit the error this report is trying to avoid. Second, Pearce's sample does not carve out the Magnificent 7 either. Big Tech is mixed into his 2.2% a year. The population problem belongs to neither side alone, which is why this report does not end with a winner.
Anyone quoting these numbers runs into a trap. The value 2.2% appears twice in this argument, attached to two different metrics. One is Pearce's revenue per worker at 2.2% a year over 2019–2025, which arrives with the context of being 3.1 times the 0.7% of the 2010s. The other is the US Bureau of Labor Statistics figure for output per hour, up 2.2% in Q2 2026 against the same quarter a year earlier, which arrives with the context of being double the 2010s average of about 1%. The two landing on the same number is a coincidence. Blend them and one figure appears to speak for both metrics, so this report names the metric every time it writes 2.2%.
A payoff of zero and a payoff you cannot see are different things
Having followed all four choices, one question is left: how much can the present evidence actually carry? This section puts a number on that ceiling. The answer, stated up front, is that quarterly macroeconomic indicators are not an instrument capable of resolving an AI signal at its current size.
6.1A rough measure of how big the signal is
The scale shows up in three numbers. First, in the US Census Bureau survey, 23.8% of firms reported using AI (two-week reference period ending 4 October 2026). Weighted by employment the figure is 32%, and among firms with 250 or more employees it is about 37%. Second, of the firms that have adopted, 57% use AI in three or fewer business functions. Third, AI spending per employee at the median Ramp customer runs to about $16 a month, or roughly $188 a year. All three point the same way. The number of firms using AI, the number of functions it touches inside a firm, and the money going into it are all still small. The surface a company-wide income statement has to register is that narrow.
Hold the last of those three against the S&P 493's revenue per worker (about $527,000) and $188 a year comes to less than 0.04%. That comparison, though, sets two different populations against each other and is therefore not a precise ratio. Ramp's customers are small and mid-sized firms; the S&P 493 are large listed ones. So the figure is used here as an order of magnitude, not a ratio. Writing that down is the method this report has been arguing for all along. Divide two numbers from different populations without stating the conditions, and this report would be doing the thing it objected to in section 1.
The macro estimates land on the same order of magnitude. In Daron Acemoglu's revised estimate, the cumulative ten-year effect of AI on total factor productivity is 0.53% to 0.66%. Annualized, that is 0.05 to 0.07 points a year. Utilization-adjusted total factor productivity, meanwhile, swings between roughly plus 2% and minus 2% within a single year, a band of about 4 points. Divide that band by 0.05 to 0.07 points a year and the signal being hunted is somewhere between a sixtieth and an eightieth of the noise. This is a rough upper-bound estimate with its assumptions on the page, not a figure for precise use. The order of magnitude, though, does not move. Looking for a signal that size in quarterly indicators is like trying to read a few millimeters of water-level change on a surface with waves running across it.
6.2Whether productivity shows a signal depends on which series you pick
The third panel in the note covers productivity across the whole US nonfarm business sector. The second choice, definition, comes back here. Three separate series travel under the name "productivity," and the three give different answers.
- Utilization-adjusted total factor productivity is negative in both Q1 and Q2 2026. This series is revised often, so we do not quote it to a decimal place.
- Unadjusted total factor productivity is up about 1.1% over the last four quarters combined.
- Output per hour from the Bureau of Labor Statistics rose 2.2% in Q2 2026 against the same quarter a year earlier, double the 2010s average of about 1%.
Which of these chart 3 uses is not stated in the note. Our three research tracks each guessed differently and did not converge, so this report does not assert an answer either. What can be recorded is the blank itself. Whether the productivity statistics contain an AI signal flips depending on which series the question names.
6.3A case where one definition doubled the number
There is no need to leave "definitions move numbers" at the level of principle. On 17 November 2025, the US Census Bureau's Business Trends and Outlook Survey (BTOS) changed its AI question. Until then it asked whether a firm used AI in producing goods and services; since then it asks whether a firm uses AI in any business function. The reported adoption rate roughly doubled. Same survey, same firms, different definition.
That is why this report does not compare figures from before November 2025 directly with figures from after it. Writing "adoption doubled in a year" would paper over a break in methodology. This case is the lucky one: the statistical agency announced the change itself. Internal corporate metrics rarely leave that kind of notice behind.
6.4How to use the J-curve without turning it into an indefinite deferral
The "it is too early" objection has history behind it. Electric motors took about 40 years to show up in the productivity statistics, and computer capital took more than 25 years after the integrated circuit. The productivity J-curve set out by Erik Brynjolfsson, Daniel Rock and Chad Syverson explains that a general purpose technology initially pushes measured productivity down, because the cost of building complementary intangible assets is paid first and the output arrives later. By that precedent, saying 2026 is early is not wrong.
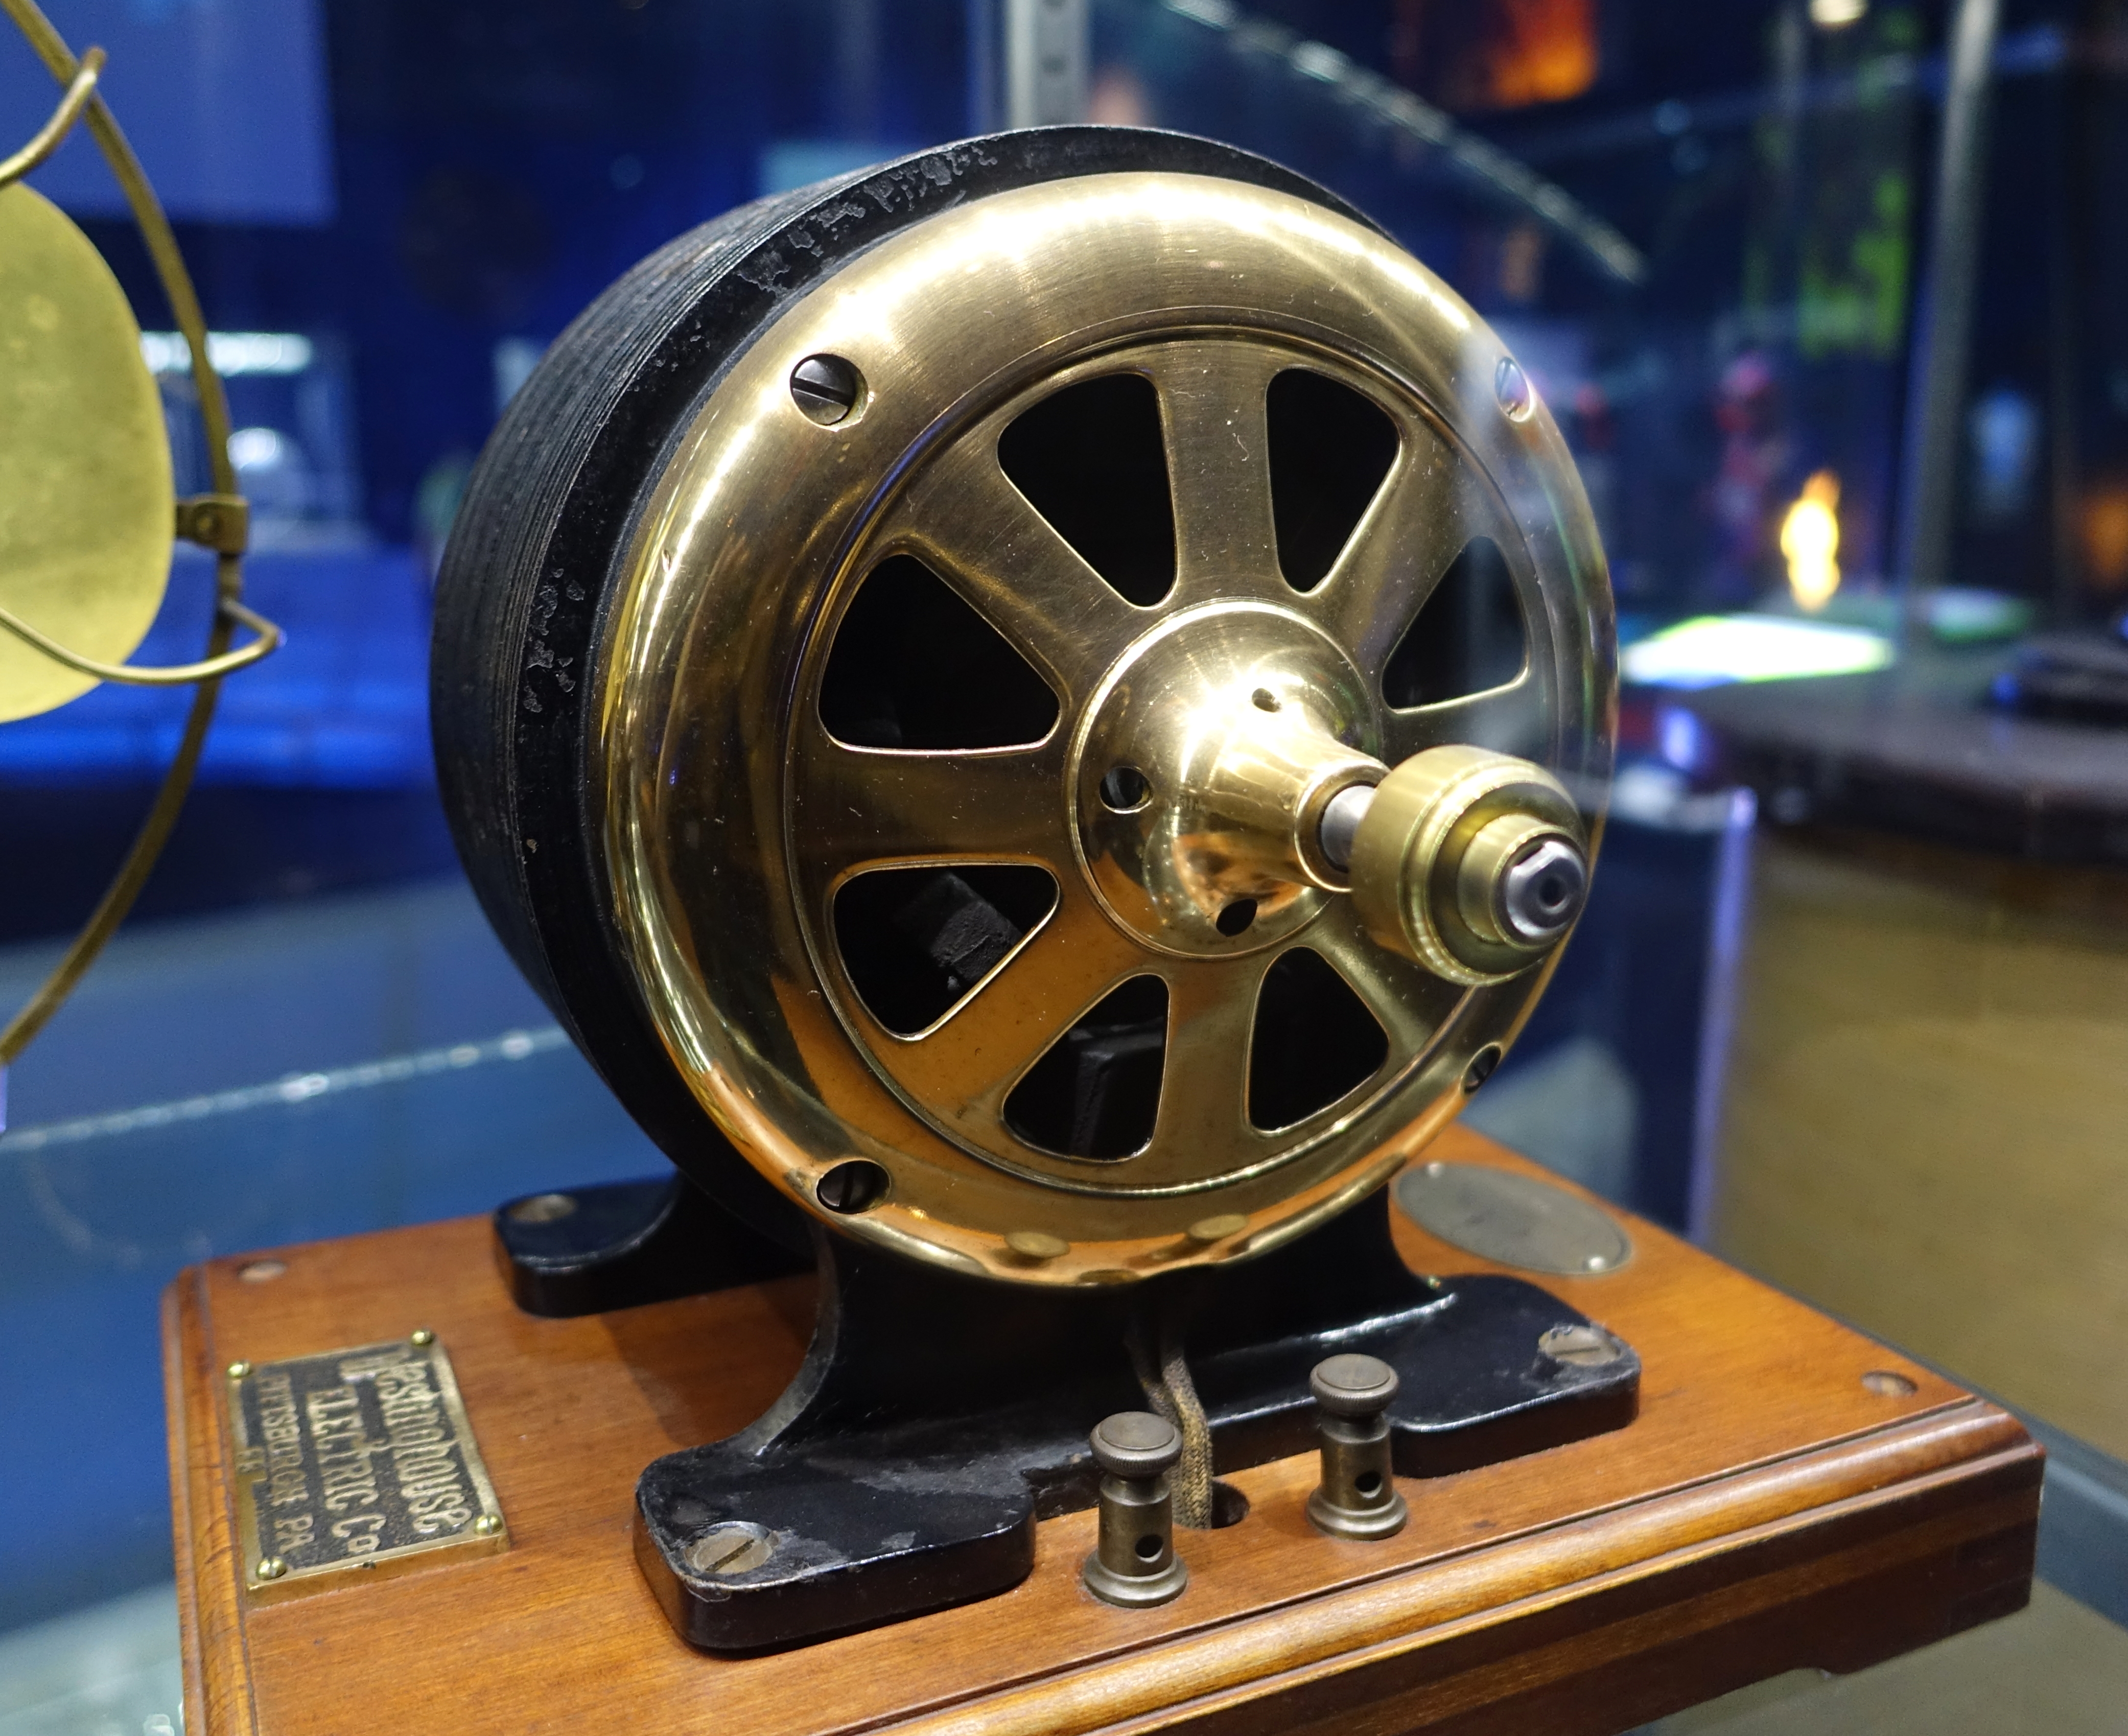
The hypothesis has to carry its falsification condition with it, though, and the authors of the J-curve supply one: if the investment does not produce economically meaningful intangible assets, the technology is not a general purpose technology. What holds the hypothesis up is evidence of complementary intangible investment, not the passage of time. If investment keeps flowing while new work processes, retraining and organizational redesign leave no measurable trace over a long stretch, then it is the hypothesis that falls, not the clock that needs more time.
6.5A four-box checklist
What a reader can actually take away from this argument is not a conclusion but a checklist. Copy out the boxes Slok and Pearce filled in differently and you get four of them. Whatever AI performance figure lands on your desk, checking whether these four boxes are filled tells you quickly how much that figure can hold up.
| Box | What it asks | Where it showed up in this argument |
|---|---|---|
| Baseline | When does the measurement start? | About $697,000 in 2019 against about $565,000 at the 2023 floor |
| Definition | What gets called by that name? | "Stuck" versus +0.8 points, the changed survey question, three productivity series |
| Control group | Was the group that did not adopt recorded too? | The bottom three rows of the concentration table |
| Population | Who is being measured? | The S&P 500, the whole US economy, Ramp's customers |
| Denominator (an extra box) | Headcount, cases handled, or hours worked? | Section 2.1, where the denominator of revenue per worker barely moves |
The first four boxes map onto sections 2 through 5 of this report, one each. The fifth is an addition of our own.
In practice it comes down to one instruction. Move the reporting unit down to the place where the work changed. A company-wide income statement controls none of these four boxes: the fiscal year sets the baseline, accounting standards set the definitions, there is no control group to begin with, and the population is the entire legal entity. Recording one team, one task, and one team that has not adopted yet is far smaller and says far more. The unit of measurement Pebblous proposed in Rippling's employee scorecard, which puts rework rate next to AI spend, carries straight over here.
6.6The evidence on the other side is not there yet
Fairness requires checking the opposite direction too. Overturning Slok's conclusion would take a non-Big-Tech listed company in the S&P 493 disclosing an AI effect as a cost saving, a headcount, or a number of cases handled. Within the scope of our search, no such disclosure turned up. What turned up were self-reported surveys. In a McKinsey survey, 37% said AI had affected operating profit; in a Deloitte survey, two-thirds reported efficiency gains while 20% reported revenue growth. Both are responses. Neither is a measurement.
An absence is also a finding, and we are not going to manufacture a case to balance the ledger. What this absence says, though, is not "AI has no effect" but "public disclosure has no slot for it yet." A company cannot disclose what it has not measured, and measuring it requires the four boxes to be filled first.
An English-language analysis that read the same table to the end already exists. A piece on The Writing King quoted all seven rows of the concentration table and made a similar case. Its headline, though, is that Torsten Slok is wrong, and this report does not say he is wrong. What is at issue here is not right and wrong but four choices.
Why this matters to Pebblous
A metric of the same name, source data of the same kind, nine days apart, opposite conclusions. In that scene from section 5, neither analyst made a mistake, and three settings were all that differed.
7.1A diagnosis reproduces only if its conditions are published before its result
Stating those settings is exactly what DataClinic does when it diagnoses a dataset: which population was taken, what the figures were normalized against, which point in time serves as the baseline. Publishing the conditions a score was produced under is harder than publishing the score, and it is what separates a diagnosis that can be reproduced from one that cannot. The argument of October 2026 demonstrated the difference as though it were a public experiment. Change the conditions and the same source data yields opposite conclusions.
7.2A control group is a collection design, not an analysis technique
There is exactly one reason the concentration table in section 4 could be re-checked from outside: the three AI rows and the three non-AI rows sat in the same table. When the control group is on record, the table can answer questions its authors never meant to ask. If the data a company collects about its own AI performance keeps only the side that adopted and not the side that did not, no analysis technique brought in later can recover the comparison. A control group is not something you insert at the analysis stage. It is a column you have to leave behind when you design the collection.
7.3The open ground is defining and recording the conditions of measurement
"Does AI work?" looks like a question about models and is really a question about measurement design. What decides the answer is not which model you run but the population the performance is recorded in, the definition it is recorded under, the point it is measured from, and the control group it is recorded against. The market for choosing models is already crowded. The ground where those conditions get defined and left on record is still empty, and that ground is what Pebblous has been pointing at with the phrase AI-Ready Data.
Two earlier cases sit close to the frame used here. A metric whose label does not match what it counts is examined in our report on a16z's AI charts and the group named on the axis, and a ratio published without its denominator in our report on Anthropic's falling share of junior hires. This case has a different texture. Every value plotted on the charts is correct. What slipped is the words laid on top of them and the four choices those words skipped.
Sections 1 through 6 report what we found in the original Apollo Daily Spark charts, in public material from the New York Fed, the Census Bureau and the Bureau of Labor Statistics, and in the coverage. Where Pebblous added arithmetic of its own or read a meaning into the figures, as in sections 2.1 and 6.1, we said so at that point, and section 7 is interpretation throughout. Please keep the two apart as you read. The same reason is why every chart reading is marked approximate, why the final data point is left unpinned to a quarter, and why the population is restated beside each Ramp figure. Writing down what each number is a number of, every time you move one, is tedious work. The zero came out of a place where that tedium was skipped. Thank you for reading this far.
References
Sources for the figures in the body, grouped by kind. Items 1 through 6 are the note this report examines and the coverage that carried it; every chart reading comes from the original images in item 1. Items 7 through 13 are the public statistics and academic literature used for comparison. Item 14 is flagged as vendor data.
Primary — the Apollo notes and the coverage
- 1.Apollo Global Management, "No Signs of AI Payoff Outside the Tech Sector", Daily Spark, 24 October 2026. apollo.com — the primary oracle for this report. The first and last sentences, the five charts, the seven rows of the concentration table and the funding figures all come from here. The readings in sections 2 and 3 were taken by downloading the original chart images on this page and reading the gridlines.
- 2.Apollo Global Management, "No Signs of AI in the Productivity Data", Daily Spark, 5 October 2026. The line quoted in section 1, "The productivity payoff from AI remains a forecast rather than an observation," closes this edition. It is the likely source of the productivity chart, though we could not confirm that with Apollo directly.
- 3.Apollo Global Management, "AI Adoption Is Spreading, AI Spending Is Concentrating", Daily Spark, 24 September 2026. Apparently the first edition to carry the concentration table, again not confirmed directly.
- 4.Bloomberg, "AI Provides Zero Payoff to S&P 493 Outside Tech, Apollo Economist Says", 25 October 2026. bloomberg.com — the route by which the first sentence traveled, as described in section 1.
- 5.AI Times, October 2026. aitimes.com — Korean-language coverage that carried the note while noting in the same piece that a payoff of zero and a payoff nobody can see are different things.
- 6.The Writing King, "Apollo's Zero AI Payoff Claim: Why Torsten Slok Is Wrong", October 2026. An earlier English-language analysis that quoted all seven rows of the concentration table. As noted in section 6.6, the argument overlaps but the conclusion is of a different kind.
Public statistics and academic literature
- 7.Jeremy Pearce, "Revenue per Worker Is Up. Are Firms Getting a Larger Share?", Liberty Street Economics, Federal Reserve Bank of New York, 15 October 2026 (SSRN 7616958). The whole table in section 5 and the R&D intensity correlation are drawn from this post, as is the passage leaving causation open.
- 8.Daron Acemoglu, "The Simple Macroeconomics of AI", NBER Working Paper 32487 (revised version). The cumulative ten-year TFP effect of 0.53–0.66% in section 6.1 is the revised figure. The first version's 0.55 and 0.71 are not used.
- 9.Erik Brynjolfsson, Daniel Rock and Chad Syverson, "The Productivity J-Curve: How Intangibles Complement General Purpose Technologies", American Economic Journal: Macroeconomics, 2021. The electric motor and computer capital precedents in section 6.4, and the falsification condition, are taken from this paper.
- 10.Kathryn Bonney et al., "The Microstructure of AI Diffusion: Evidence from Firms, Business Functions, and Worker Tasks", CES-WP-26-25 / NBER Working Paper 35141. The 66% and 2% adoption motives in section 2.1 and the 57% using AI in three or fewer functions in section 6.1 come from here.
- 11.U.S. Census Bureau, Business Trends and Outlook Survey (BTOS). The 23.8% adoption rate in section 6.1 (two-week reference period ending 4 October 2026), the 32% employment-weighted figure, the roughly 37% among firms with 250 or more employees, and the 17 November 2025 question change in section 6.3 are all carried by this survey.
- 12.Federal Reserve Bank of San Francisco, Total Factor Productivity (Fernald) series. The utilization-adjusted and unadjusted series in section 6.2 are both from this dataset. Because the series is revised often, the body does not quote it to a decimal place.
- 13.U.S. Bureau of Labor Statistics, Productivity and Costs, Q2 2026. The 2.2% year-over-year rise in output per hour and the 2010s average of about 1% were read off this release.
Vendor data
- 14.Ramp, AI Index (September 2026). The monthly AI spending per employee in section 4.1 ($15.70 median, $813.43 top 10%, $9,567.53 top 1%) and the underlying data for charts 4 and 5. These are transactions from the customers of a US corporate card and spend management company, and they are not a tally of large listed firms.
Related Pebblous reports
- 15.a16z's AI charts and the group named on the axis — picked up in section 7.3.
- 16.Rippling's employee scorecard, which puts rework rate next to AI spend — picked up in section 6.5.