Executive Summary
This article reads the part of AMD's $8.2 billion acquisition of World Labs, announced on September 28, 2026, that the press walked past. Most coverage filed the deal as a chip company hiring a star AI researcher. Read the AMD press release to the end, though, and the list of assets being acquired closes with "technology for robotic learning and simulation." Follow World Labs' own writing and you find where that technology came from. A company called SceniX, which World Labs bought two months earlier.
What that engine produced went public in July, in a single blog post. Policies learned entirely in simulation, with no real-world training data, transferred directly to five kinds of physical robot. Not one success rate appears in the prose. Open the figure and the situation changes. The axes carry success-rate ticks, the legend names the two policies under evaluation as models built by NVIDIA and Physical Intelligence, and the horizontal axis is labeled post-training iterations. The chart says what the text does not.
In the same post World Labs rewrote the standard for quality. A simulation worth using does not have to match the real success rate; it has to lead you to the same decision you would reach in reality. That is a reasonable relaxation. The trouble comes next. A metric that scores exactly this proposition has existed since 2024, and the lab that built it is the one Fei-Fei Li came from. World Labs did not use it, and did not release the tooling that would let anyone else measure the same way. When the party that builds the generator also holds the yardstick, the seat left empty is the independent measurer's.
Error left by 100 real trials
Half-width of the 95% confidence interval near a success rate of 0.9. World Labs ran 100 real trials per checkpoint. Pebblous calculation
Benchmarks and baselines cited in the robotics post
A full-text search of the source page returns zero hits for benchmark, baseline, rank correlation, and cited literature alike
From the SceniX deal to the AMD announcement
The gap between July 21, 2026, when World Labs bought the robot simulation company SceniX, and the day AMD announced
Simulated trials per real trial
2,000 simulated against 100 real trials per checkpoint. This holds for the ALOHA cube-handover task, and it counts evaluations, not training data
The $8.2 billion is not a settled price
The $8.2 billion in the headline is not what AMD will actually pay at closing. No cash changes hands; the consideration is entirely AMD common stock, and the number of shares to be exchanged has not been fixed. The Form 8-K covering the merger agreement AMD signed on September 26, 2026 says so in the company's own words.
"the number of shares to be issued … is not known"
AMD, Form 8-K (amd-20260926), signed September 26, 2026 · The same document states that the share count will be set from the volume-weighted average price over the ten trading days ending two trading days before closing.The announcement landed at 4:05 p.m. Eastern on September 28, after the regular session had closed. Closing is scheduled for the end of 2026, subject to regulatory approval and the usual conditions. Until then AMD will run World Labs separately from its semiconductor business, CNBC reported. The legal entity is World Labs Technologies, Inc., headquartered in San Francisco.
Which item the 8-K was filed under is worth reading too. There is exactly one: Item 3.02, unregistered sales of equity securities. Not Item 1.01, which reports entry into a material agreement, and the exhibit list carries no merger agreement. So the break fee, the regulatory-approval covenants, the retention terms, the treatment of existing investors' stakes are simply absent from the public record. The issuance is not a public offering either. The same filing cites Section 4(a)(2) of the Securities Act of 1933 and Rule 506 of Regulation D. Half the reason this article will keep saying "not disclosed" sits right here. The document that would carry those terms was never filed, so there is nothing to read. Even the figure the 8-K gives is "approximately $8.2 billion…subject to customary adjustments," which hangs an adjustment clause on the total itself.
1.1What the Xilinx precedent shows about the spread
How far apart the announced price and the closing price can drift in an all-stock deal is answered by AMD's own history. The Xilinx acquisition was announced on October 27, 2020 at roughly $35 billion and closed on February 14, 2022. The accounting purchase consideration at closing was $48.8 billion, the figure recorded in the FY2022 Form 10-K. That is 39.4% above the announcement.
Which makes the widely repeated line about AMD's "second-largest deal ever" a comparison with mismatched axes. Articles that put Xilinx at $49 billion are using the closing figure, while World Labs' $8.2 billion is an announcement figure. Compare announcement to announcement and it is $35 billion against $8.2 billion. The ranking does not change, but any sentence that sets the two numbers side by side and derives a multiple is multiplying and dividing values measured at different moments.
Put the two deals in one table and the mismatch shows. The last row of the table below is the least-reported number in this article.
| Item | Xilinx | World Labs |
|---|---|---|
| Announced | 2020-10-27 · about $35B | 2026-09-28 · about $8.2B |
| Form of consideration | All AMD common stock | All AMD common stock |
| Closed | 2022-02-14 | Expected end of 2026 |
| Accounting consideration at closing | $48.8B | Not determined |
| Move from announced price | +39.4 % | Not determined |
| Shares issued | 429 million | Not set · about 13.5M at the 9/28 close |
Table 1. Xilinx values come from AMD's FY2022 Form 10-K and the 2020 announcement; World Labs values come from the September 28, 2026 press release and the Form 8-K. The $48.8 billion for Xilinx is the $48.5 billion fair value of 429 million AMD shares plus $275 million in replacement equity awards, struck at the February 11, 2022 closing price of $113.18. The 13.5 million shares for World Labs is $8.2 billion divided by the September 28 close, so the number actually issued will move with the share price through closing.
Read the first row against the last and a picture emerges that runs against the intuition. By announced price Xilinx is roughly four times World Labs. By share count the gap is thirty-two times. AMD stock was $113 at the Xilinx close and is above $600 now, so the cost of paying the same money in stock fell along with the rise. This comparison carries one caution as well. The 429 million Xilinx shares were actually issued at closing, while the 13.5 million for World Labs is a conversion at the September 28 close. AMD's dilution works out to 0.83%, $8.2 billion over the market capitalization at that close.
Market cap   1,632,000,000 shares × $607.87 = $992B
Dilution     $8.2B ÷ $992B = 0.83 %
Share count  $8.2B ÷ $607.87 = about 13.5M shares
vs. Xilinx   429M shares ÷ 13.5M = about 32×
Shares outstanding come from AMD's Form 10-Q as of June 27, 2026, with no treasury stock. The price is the September 28 close. All three values fix that one closing price, so they differ from the ten-day weighted-average method the 8-K specifies.
1.2The day the stock priced the news was September 29
The most common date error in writing about this deal sits here. AMD stock fell 3.61% on September 28, but the announcement came after that day's close. The drop was a broad pullback in semiconductor names, not a reaction to this deal. The first regular session to price the news was September 29. The stock rose as much as 1.3% intraday that day before fading to close at $607.57, down 0.05% and effectively flat. Analyst reaction was broadly favorable, according to multiple outlets. Rosenblatt and Stifel kept buy ratings and BofA raised its target to $720.
1.3How heavy is $8.2 billion for AMD
A dilution figure of 0.83% makes the deal look small for AMD shareholders. On the income statement the impression is different. The $8.2 billion equals 71% of AMD's FY2026 second-quarter revenue of $11.5 billion, and 1.66 times the $4.928 billion of R&D spending in the first half of that year. This is a deal that puts roughly seven-tenths of a quarter's revenue on one lab, and it is larger than half a year of research budget.
The ladder on the World Labs side is short too. When the company came out of stealth in September 2024, its valuation was reported at about $1 billion, and the $1 billion round led by Autodesk on February 18, 2026 was discussed at $5 billion. That $5 billion first appeared in a Bloomberg story dated January 23, 2026, headlined "Fei-Fei Li's AI Startup World Labs in Funding Talks at $5 Billion Valuation," which World Labs neither confirmed nor denied. The February round announcement carried no valuation either. Saying that $8.2 billion is 1.6 times that figure is accurate, but the denominator is a reported number and the numerator is a conversion at announcement, so the multiple rests on two layers of uncertainty.
Another figure needs flagging here. Some tertiary sources put the valuation of that round in the $1.2 billion range, but that figure is the cumulative capital World Labs has raised since founding. Move it into the valuation column and the number changes meaning. The named investors in the February round include AMD itself along with Autodesk, Emerson Collective, Fidelity, NVIDIA, and Sea. That list appears verbatim on the World Labs blog.
The robot-training engine came from SceniX
The engine behind the robot-training capability AMD is buying was not built by World Labs. It came from another company, acquired two months earlier. That attribution is not a Pebblous inference; it is a sentence World Labs wrote about itself. And the company's name appears nowhere in CNBC, Tom's Hardware, or The Japan Times.
The starting point is the body of AMD's press release. The sentence describing what World Labs builds ends with a clause tacked on.
"World Labs develops spatial-intelligence models that generate, reconstruct and simulate interactive 3D environments from text, image and video inputs, as well as technology for robotic learning and simulation."
AMD, "AMD to Acquire World Labs to Advance the Future of AI Compute," September 28, 2026Where the asset behind that closing phrase, "technology for robotic learning and simulation," actually came from is written on the World Labs blog. The company acquired a robot simulation firm called SceniX on July 21, 2026, and a week later described in a post what that firm had been building.
"On July 21, SceniX, a robotics and simulation company, joined World Labs. SceniX has been building systems that turn real robots, environments, and interactions into simulations for policy training and evaluation, developing a real-to-sim-to-real (R2S2R) engine that turns one physical task into many controllable, reusable worlds, helping robotics teams train policy models and test changes faster, uncover failures earlier, and reduce costly experimentation on hardware."
World Labs, "Building Worlds That Train Robots," July 28, 2026R2S2R names the round trip that carries a physical setup into simulation and brings the policy learned there back out to hardware. That is the robot-training apparatus World Labs is handing to AMD, and the company itself names SceniX as the party that built the engine. Sixty-nine days passed between that post and the acquisition announcement.
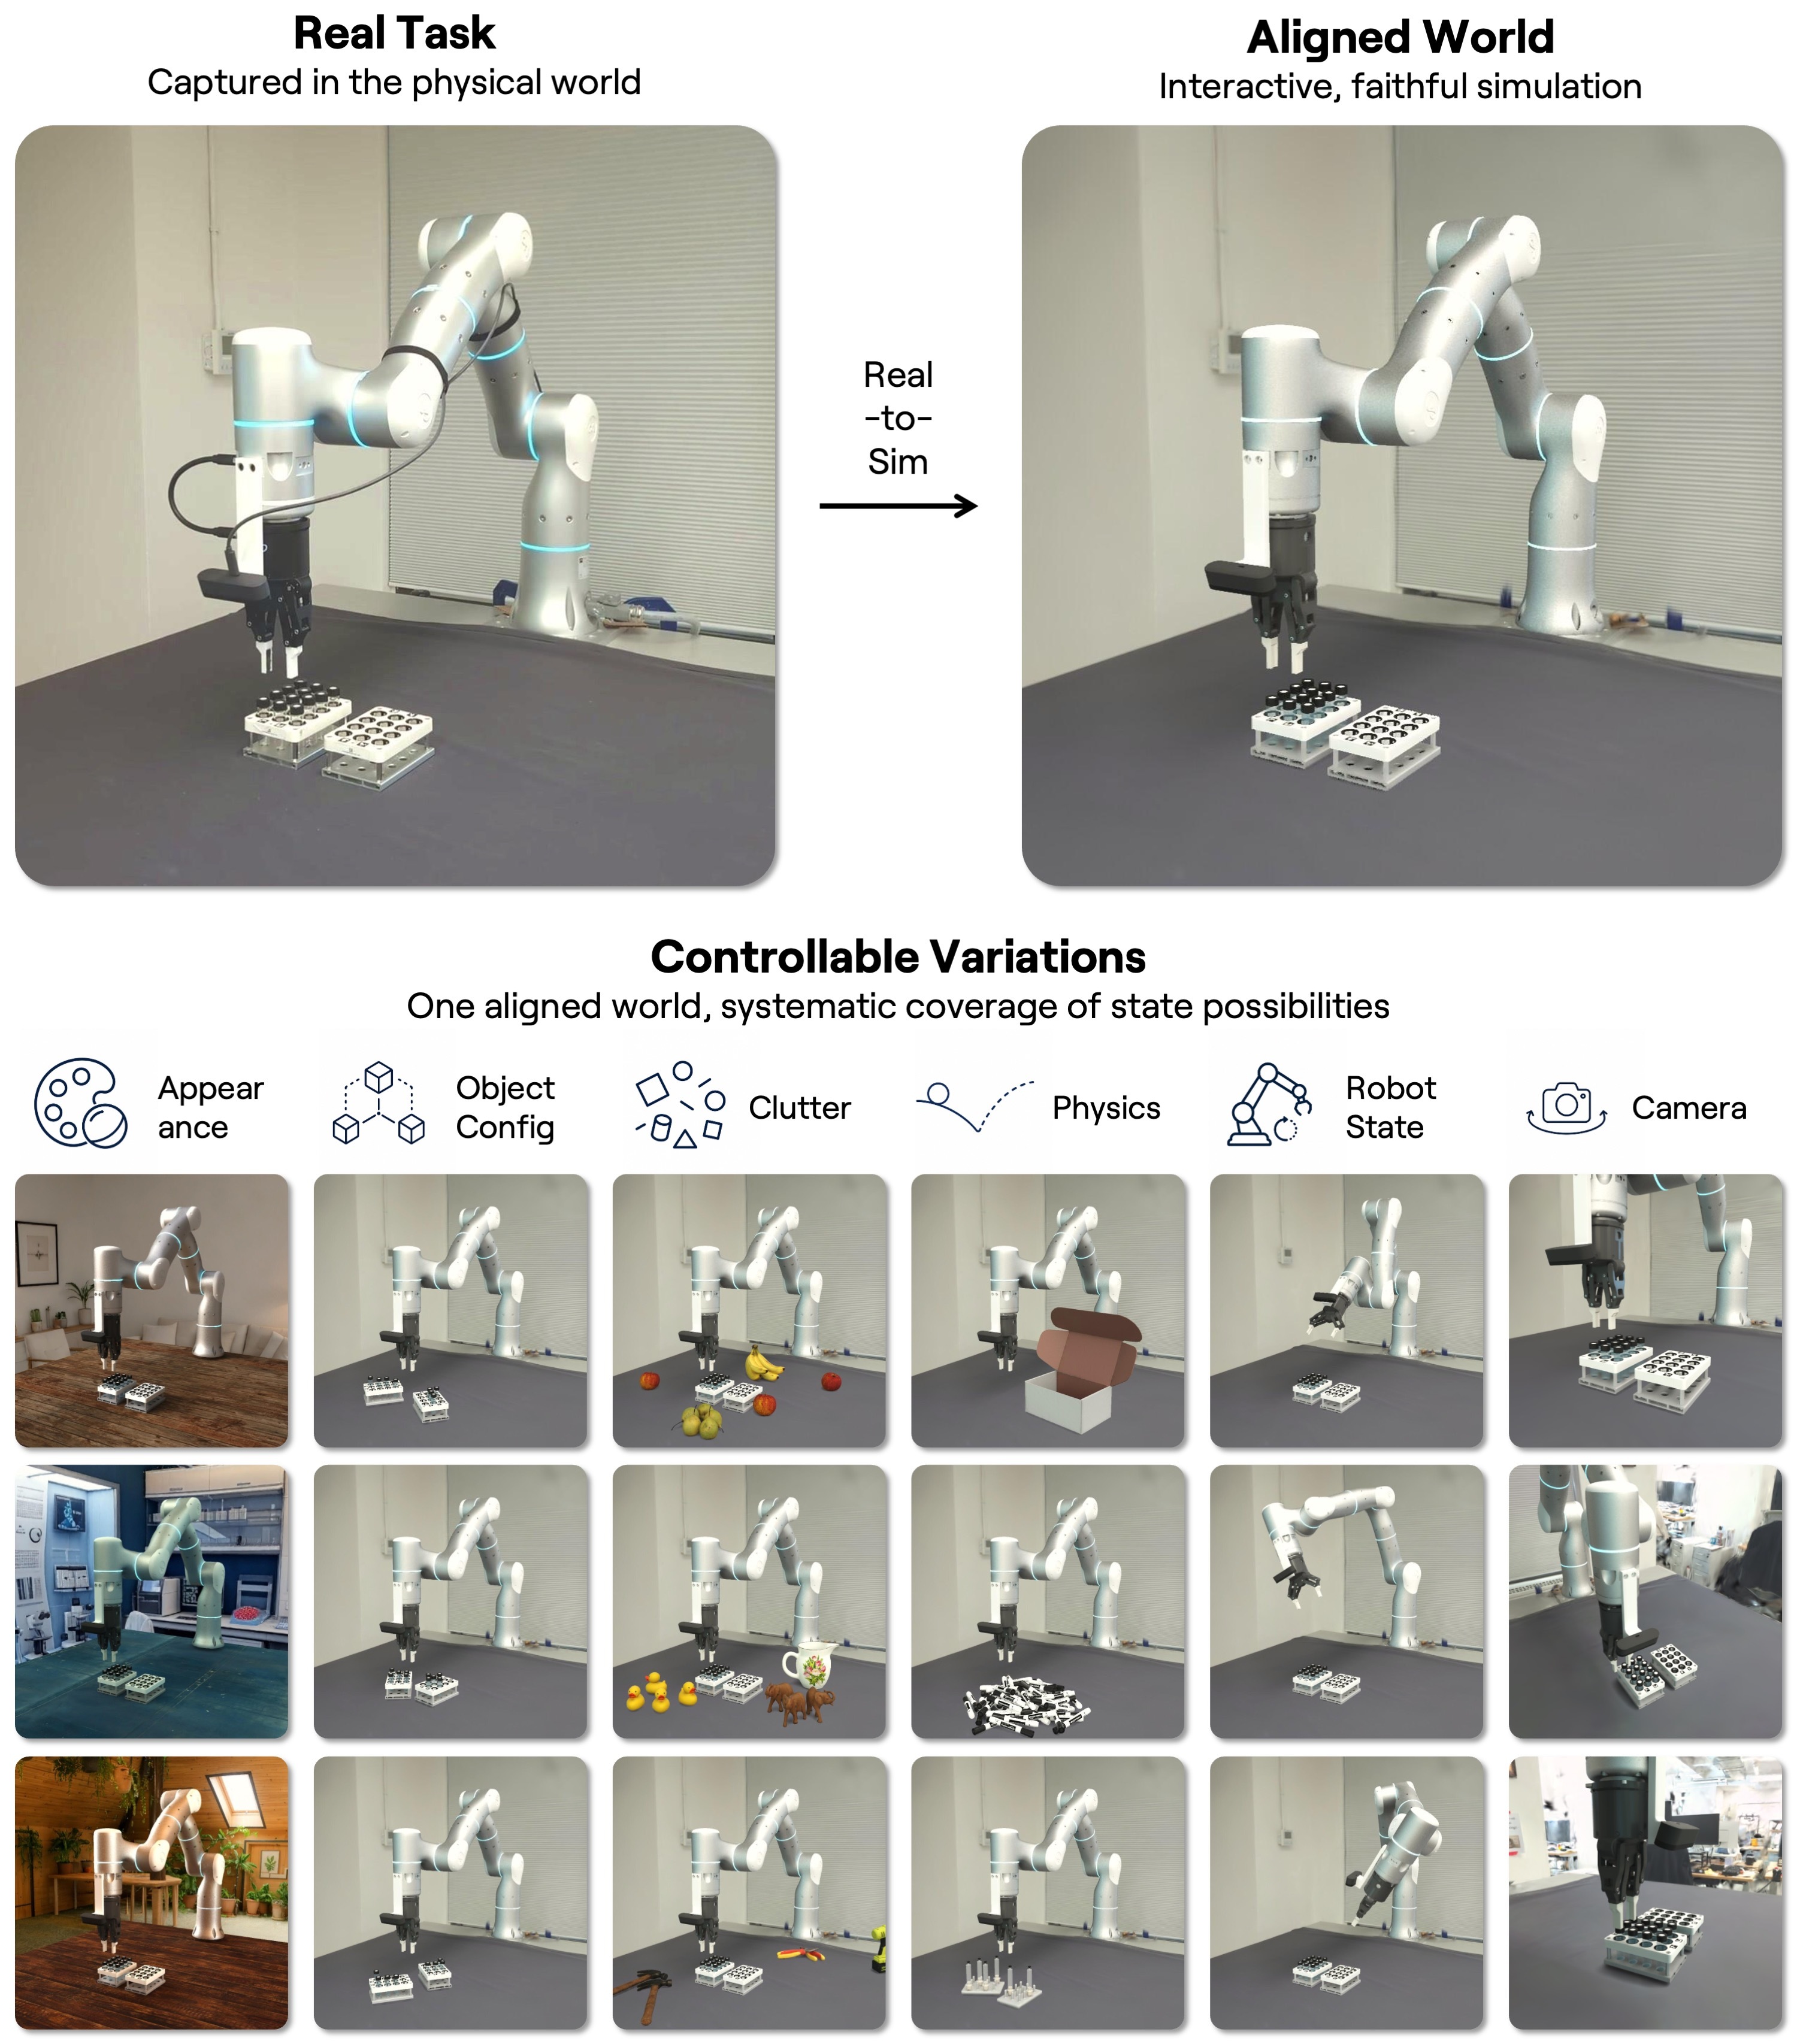
Nor does the attribution rest on the July post alone. The same sentence reappears in the piece Fei-Fei Li published under her own name on the day of the announcement. Listing what the company had built since its 2024 founding, she writes that "with the acquisition of SceniX, we're building towards an industry leading capability for robotics simulation." On the day the company passes to AMD, its CEO names SceniX as the source of the robotics capability. The document that omits the name is the AMD press release.
2.1Four things inside sixty-nine days
Lay the four events out by date and it becomes clear which way the center of gravity tipped. A week separates the SceniX acquisition from the R2S2R release, and less than four weeks separate the Atlas release from the AMD announcement. The moment the company turned toward robotics and the moment it announced the sale fall inside the same quarter.
Figure 1. A timeline transcribed directly from the publication dates on the World Labs blog. Horizontal spacing is proportional to the actual intervals. From the R2S2R release to the AMD announcement is 62 days; from the Atlas release to the AMD announcement, 27 days.
The July 21 SceniX announcement is itself almost empty. The whole thing runs about 230 words, and what it discloses is the company's name plus the phrase "a robotics company." No founders, no team size, no deal terms, no description of the technology. The post closes on its own terms: "We'll share more soon about some of the early technologies SceniX has built." That soon turned out to be the R2S2R post a week later.
2.2AMD turned toward robotics in the same week
Looking only at World Labs, the July pivot reads as one company's business. Overlay what AMD did that same week and the picture shifts. On July 23, 2026, AMD held its annual Advancing AI 2026 event at Moscone Center in San Francisco and launched a processor for robots there: the Ryzen AI Embedded X100 series. The first application area the company lists is robotics, with humanoids and surgical robots given as use cases. Customer samples began shipping in June and volume production is scheduled for the fourth quarter. The same event introduced a robotics partner network and an integrated Physical AI platform.
Set the dates side by side and it reads like this. On July 21 World Labs buys a robot simulation company, on the 23rd AMD launches a robotics chip, on the 28th World Labs publishes its robot-training results. All within one week. No coverage overlaying those two rows of dates turned up.
The two companies had not met for the first time that week either. Fei-Fei Li's post on announcement day records the history of the relationship. She writes that World Labs has worked with AMD since its earliest days, and that over the past year the two ran a deep technical partnership optimizing model training and inference on AMD GPUs. The company blog's acquisition notice uses the same sentence. That piece also says AMD CEO Lisa Su was an early investor, without distinguishing whether that was in a personal capacity or through the company. The shortest answer to why a chip company bought a world-model lab sits here. The lab was already a customer running on that company's GPUs, and the two moved in the same direction in the same month.
2.3It is also a reunion with a former colleague
SceniX was co-founded by Yunzhu Li and Changxi Zheng, both professors at Columbia University. Yunzhu Li's background explains this chain from another angle. After Peking University, he earned his doctorate at MIT CSAIL under Antonio Torralba and Russ Tedrake, then did a postdoc at the Stanford Vision and Learning Lab. His own homepage records that stretch verbatim: "Postdoc at the Stanford Vision and Learning Lab (SVL), working with Fei-Fei Li and Jiajun Wu." Changxi Zheng holds a Cornell doctorate and works on computer graphics and physical simulation, with fluids, contact, and sound as his subjects.
So World Labs buying SceniX was a purchase of technical assets and a recall of former collaborators at once. That lineage returns in section 4, because people out of the same lab built the evaluation metric for robot simulation.
What is confirmed about SceniX ends there. Company databases record a New York firm founded in 2024 with fewer than twenty employees and no publicly recorded funding round. Those values are third-party aggregations that the company has never published. The price World Labs paid is also undisclosed, and no outlet reporting even an estimate turned up.
2.4Which of its own three boxes is being sold
Four months before the AMD announcement, World Labs published a piece splitting world models into three categories, sorted by what they output. A renderer produces pixels for a human to look at, a simulator produces state a machine can compute over, and a planner produces actions. The company named the renderer's limit itself: "The model carries no explicit understanding of three-dimensional structure." Which means an output can look plausible and still be physically impossible.
Of the three, it called the simulator the linchpin, on the grounds that both visual appearance and the consequences of action derive from it. That self-definition becomes the frame for reading the acquisition. The weight in AMD's list of acquired assets rests not on the side that makes video for people to watch but on the side that makes state for machines to compute. A question about data quality stands exactly on that boundary, because the company itself drew the line between the world that looks good and the world that can be computed.
Success rates missing from the text, present in the chart
World Labs did publish success rates. It published them inside a figure rather than in prose. The body of the R2S2R post contains not a single percentage, but download the chart image sitting midway through it, zoom in, and the values are there on the axes and in the legend. The numbers in this section come from reading that image directly, and the reading error is stated alongside them to mark them as readings.
3.1What opening the image gives you
The chart is a single 4327×2027-pixel PNG captioned "Charts comparing policy performance in simulation and on real hardware." It has three panels. The left one is a scatter plot with simulated success rate on the horizontal axis and real success rate on the vertical, both ticked from 0.0 to 1.0 at intervals of 0.2. The middle holds two sets of learning curves, and the right is a spatial map of successes and failures plotted by cube position. Counting points gives sixteen in the scatter and eight on the learning curves.
The most valuable thing in the figure is not the ticks but the legend, which carries the names of the policies under evaluation: GR00T N1.6 and π0.5, that is, NVIDIA's robot foundation model and Physical Intelligence's vision-language-action model. Neither name appears anywhere in the body of the R2S2R post. The prose says only "across policy architectures." Searching the source HTML end to end confirms it. Reading the piece tells you nothing about what World Labs evaluated; you have to open the chart. No outlet reported those two names either.
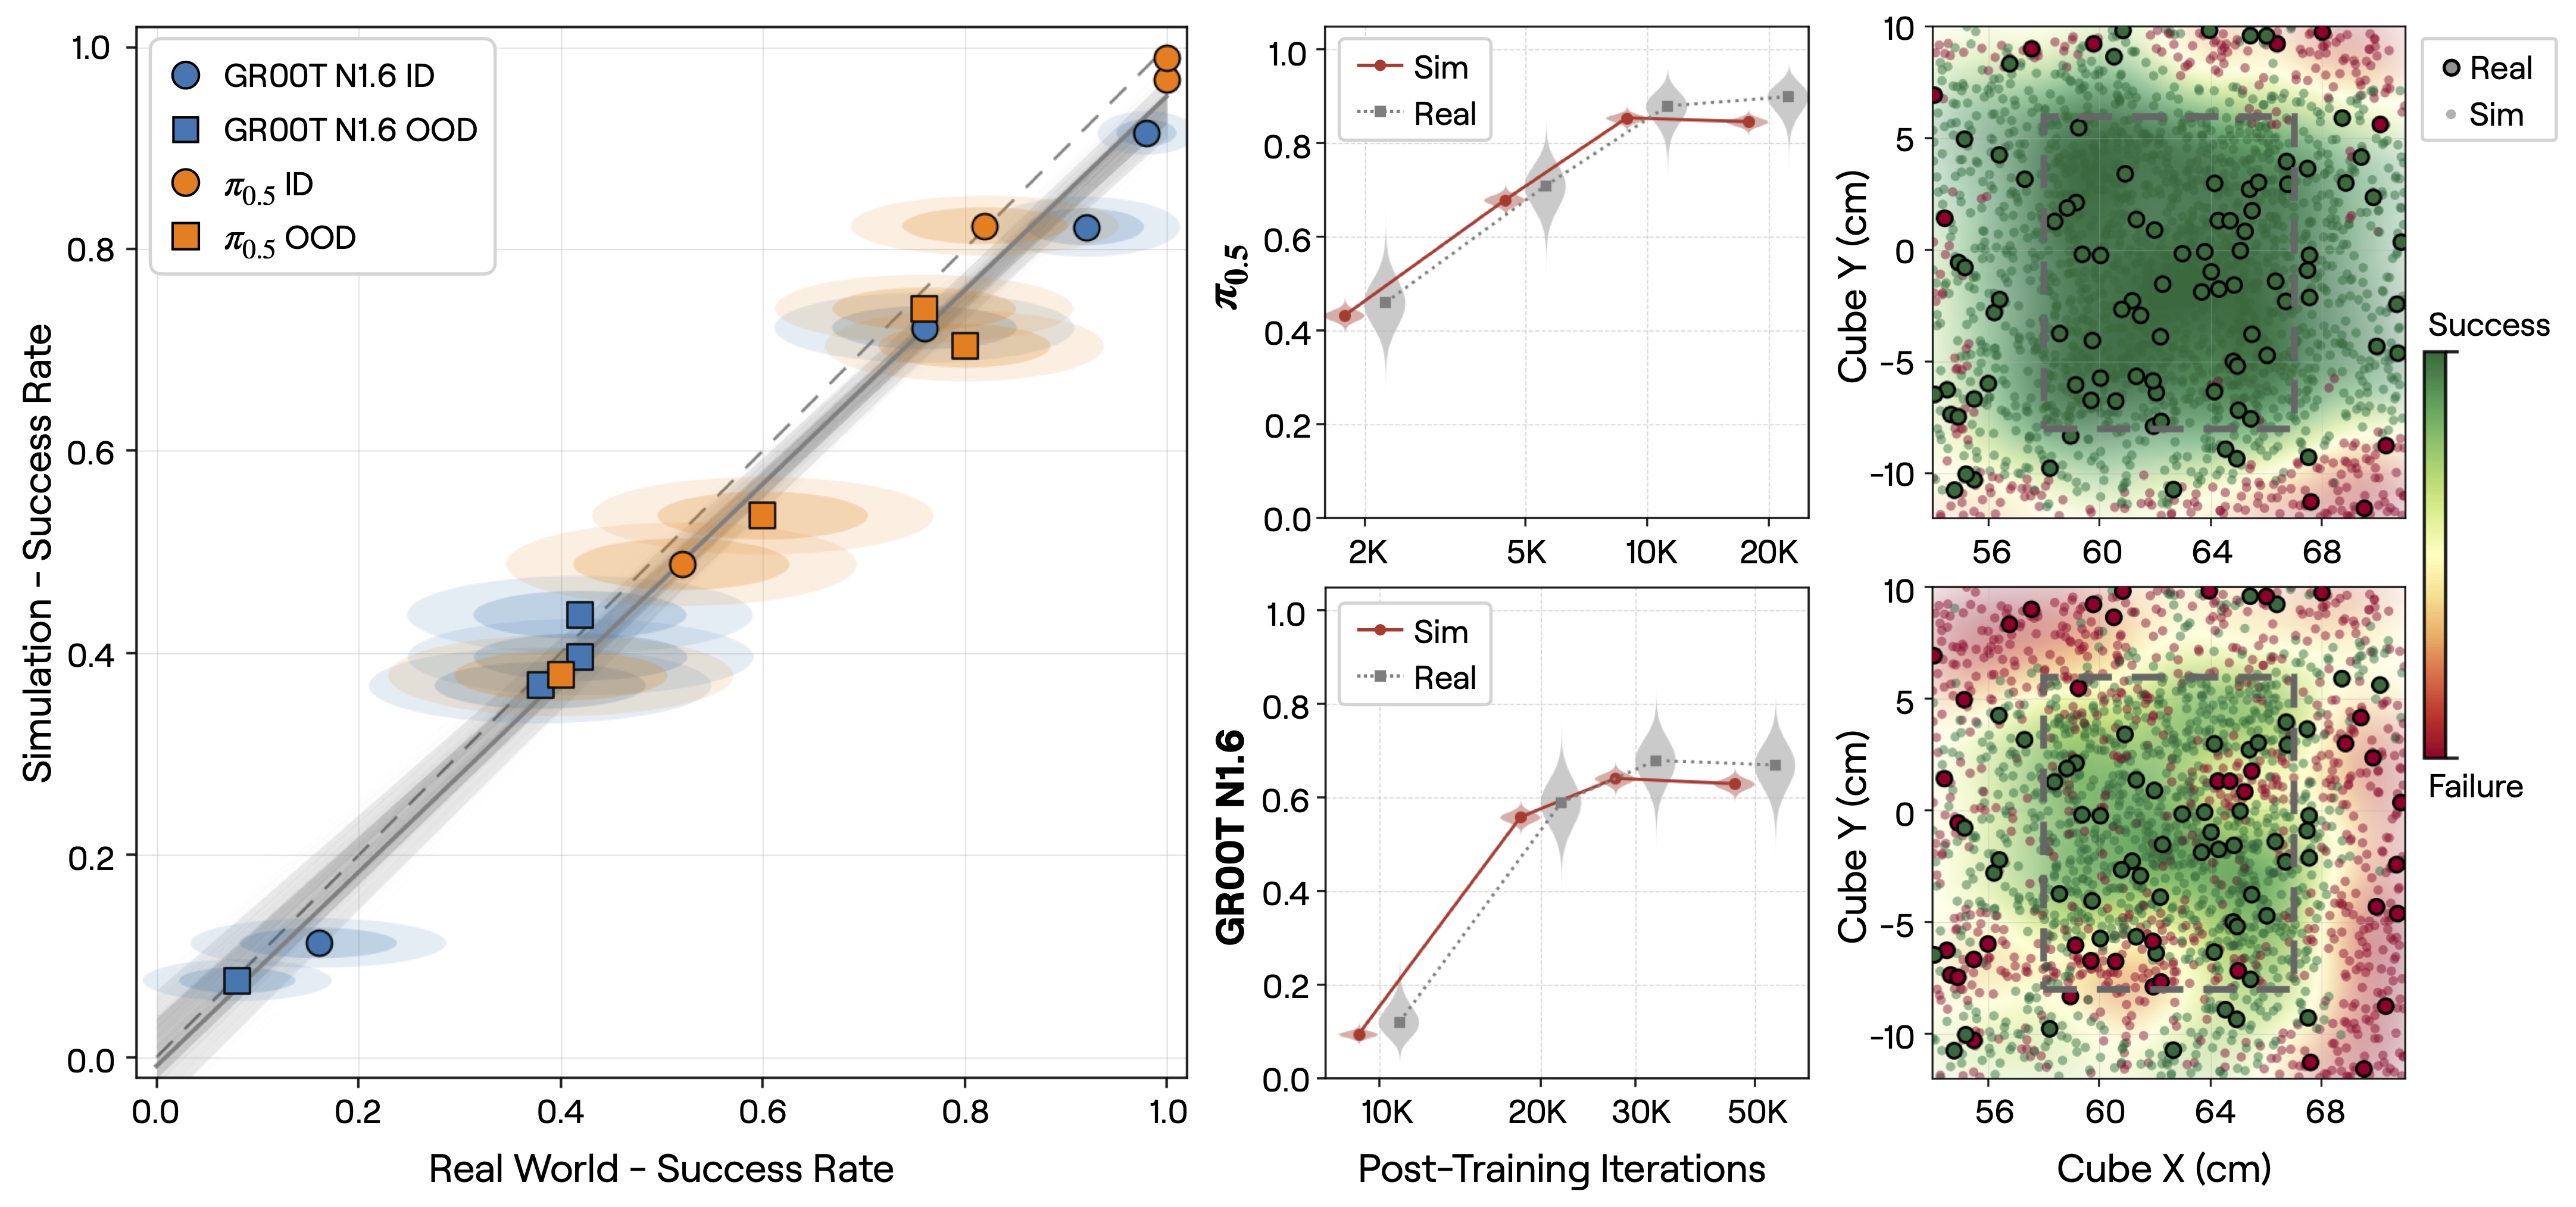
Reading the eight measured points on the learning curves off the ticks gives the table below. Reading error runs to about a tenth of a tick, roughly 0.01 to 0.02.
| Policy | Post-training iterations | Sim success rate | Real success rate |
|---|---|---|---|
| π0.5 | 2K | 0.43 | 0.46 |
| π0.5 | 5K | 0.675 | 0.71 |
| π0.5 | 10K | 0.855 | 0.88 |
| π0.5 | 20K | 0.845 ↓ | 0.90 ↑ |
| GR00T N1.6 | 10K | 0.09 | 0.12 |
| GR00T N1.6 | 20K | 0.56 | 0.59 |
| GR00T N1.6 | 30K | 0.64 | 0.68 |
| GR00T N1.6 | 50K | 0.63 | 0.67 |
Table 2. Values read off the ticks after magnifying the chart image in the World Labs R2S2R post. World Labs did not write these as numbers; Pebblous read them, so the second decimal place falls inside the reading error. The iteration counts are transcribed from the figure's horizontal axis label, Post-Training Iterations.
The first thing that catches in this table is not the last row but the name of the horizontal axis: Post-Training Iterations. The body uses the same word. "ID refers to cube positions within the distribution used to post-train the policy." And both policies named in the legend are models pre-trained on real robot data. NVIDIA's model card says GR00T N1.6 was trained on a mixture that includes "real captured data," and Physical Intelligence's official repository says its public checkpoint is "pre-trained on 10k+ hours of robot data."
That much is what four primary sources each set down. The next paragraph is a Pebblous interpretation stitching those facts together. Over the range the figure covers, "zero real-world training data" reads as a zero in the post-training stage, because real data is already inside the two base policies. Whether the same post's "trained entirely in simulation" refers to the whole pipeline or only to the post-training step is something World Labs did not state. What can be confirmed stops at the fact that the piece never drew the distinction.
Another passage in the same post supports that reading. The company cites autonomous driving as the precedent where simulation worked. But the sentence runs: "some of the most successful L3 or L4-level self-driving cars running on the road today are powered by models trained using both real-world driving and simulation data." Both, it says. The precedent the company chose to argue for simulation's power is a mixture of real and synthetic.
The wording also wavers once inside the same piece. The body says "zero" and the conclusion says "minimal." The two sentences sit side by side below.
"The policies shown here were trained entirely in simulation, with zero real-world training data, and transferred directly to diverse real robot platforms."
Body text"Sim-to-Real uses those worlds to train policies with minimal real-world training data, uncover failures, and predict performance on hardware."
Conclusion of the same postWhich one is accurate has not been stated. Rather than pick one and assert it, note only that both sentences live in the same document.
3.2At the end of the curve the two lines part
Return to the fourth row of Table 2. Between 10K and 20K iterations for π0.5, the simulated success rate falls from 0.855 to 0.845 while the real rate climbs from 0.88 to 0.90. One of the claims World Labs makes is that its simulation predicts whether improvement during training will carry over to hardware, and on the very measure that claim targets, the directions part.
Also, at all eight measured points the simulated rate sits below the real one. That is not randomly scattered error but underestimation leaning one way. By World Labs' own standard this is not a defect, since the company wrote that matching the success rate exactly is unnecessary. Still, the direction of the bias never flips across any of the eight points, and that one-sidedness belongs in the record.
The important thing is not to read this passage as saying the claim is wrong. The real-world spread in the scatter plot is wide enough that the two values do not separate statistically. That they cannot be separated is this article's argument, and turning it into a number is the work of section 4.
3.3The Atlas table has the same shape
A summary that does not match the values in its own table is not confined to the robotics post. Atlas, released on September 1, came with a summary claiming strength across standard benchmarks. Extract every value from the chart on that page and six of seven cells are best in row, with one second. The metric is point-map reconstruction error, where lower is better.
| Benchmark | Atlas | Pi3X | π³ | VGGT-Ω 1B | Depth Anything 3 | MapAnything |
|---|---|---|---|---|---|---|
| Average | 25.3 | 28.7 | 34.7 | 36.4 | 39.3 | 47.7 |
| DTU | 8.6 | 11.1 | 16.2 | 9.7 | 11.9 | 18.2 |
| ETH3D | 9.3 | 18.7 | 25.4 | 11.4 | 23.8 | 34.8 |
| KITTI | 60.0 | 60.2 | 74.8 | 101.4 | 93.3 | 115.3 |
| NRGBD | 6.5 | 13.3 | 17.5 | 10.5 | 11.3 | 20.2 |
| 7-Scenes | 37.8 | 39.3 | 44.4 | 45.2 | 50.8 | 47.4 |
| T&T | 42.4 | 42.4 | 47.0 | 40.2 | 55.1 | 60.8 |
| ScanNet | 12.4 | 15.7 | 17.4 | 36.6 | 29.0 | 37.0 |
Table 3. Every value extracted from the SVG chart on the World Labs Atlas release page. The metric is point-map reconstruction error (AbsRel ×10−3), where lower is better. Orange marks the lowest value in each row. All seven values are World Labs' own evaluation, not third-party verification. T&T is Tanks and Temples, and in that cell VGGT-Ω 1B beats Atlas.
The headline is an average of 25.3 against 28.7. Confirm that the average is a plain arithmetic mean over seven cells, then recompute each cell's contribution, and the source of the gap shows itself. Of the 3.39 average margin over the runner-up Pi3X, 68.4% comes from two cells, ETH3D and NRGBD. KITTI, which carries the largest error magnitude, is effectively a tie at 60.0 against 60.2 and contributes 0.8% of the margin, and T&T is an exact tie, contributing zero.
Average check   177.0 ÷ 7 = 25.286 → 25.3      200.7 ÷ 7 = 28.671 → 28.7
Average margin  23.7 ÷ 7 = 3.39
Cell shares     ETH3D 9.4 (39.7 %)   NRGBD 6.8 (28.7 %)   ScanNet 3.3 (13.9 %)
                DTU 2.5 (10.5 %)     7-Scenes 1.5 (6.3 %)  KITTI 0.2 (0.8 %)   T&T 0.0 (0.0 %)
Pebblous recalculation. All six columns were re-averaged and match the values as printed.
Average seven values on wildly different scales with equal weights and this is the structure you get. The large-valued cells dominate the level of the average but contribute almost nothing to the margin, while two small-valued cells produce nearly all of it. Read the average alone and it looks like across-the-board superiority; open the cells and it looks like superiority concentrated in two of them. Neither description is false, but the impressions they leave differ.
A reason to look at this table once more arrived on announcement day. In her own piece Fei-Fei Li described Atlas as "outperforming state of the art results even by specialized models," a sentence claiming it beat the best results specialized models had posted. In Table 3, Atlas misses first place in exactly one of seven cells, and the model it yields that cell to happens to be the specialized VGGT-Ω 1B. The discrepancy is one cell wide, but that one cell holds the very comparison the sentence aimed at.
Five human-preference comparisons are reported for video generation that follows a camera path. Voters chose Atlas 75% of the time against MiniMax H3, 81% against Gemini Omni Flash, 86% against Happy Horse 1.1, 93% against FLUX 3, and 94% against Seedance 2.5. The number of voters, how they were recruited, and how the tasks were composed were not stated. Like Table 3, these rates are an in-house evaluation.
A hundred real trials cannot separate two checkpoints
The answer key that would confirm the rank-preservation claim is far sparser than the simulation it is meant to check. The evaluation protocol World Labs published is 2,000 simulated and 100 real trials per checkpoint. That 20-to-1 ratio reads as a symbol of cost savings, but nowhere does the post say what resolution 100 trials buys. Once that resolution is in hand the ratio reads differently.
"Each checkpoint is evaluated on 2,000 simulated trials (1,000 ID and 1,000 OOD) and 100 real-world trials (50 ID and 50 OOD)."
World Labs, figure caption in the R2S2R post · This sentence applies to exactly one task, the ALOHA bimanual cube handover. For the other four platforms and five tasks, only qualitative results such as an hour of continuous operation without intervention are reported. The tasks carrying that one-hour note include cable tidying, power-cord routing, test-tube transfer, and separating markers from pencils, and the cube handover with the stated trial counts is not among them. The tasks with numbers and the tasks shown running continuously do not overlap.4.1A hundred trials leave 6 to 10 percentage points of error
A success rate is a proportion, and the uncertainty in a proportion is set by the number of trials. Taking the normal approximation to the binomial proportion, the half-width of the 95% confidence interval works out as below. The formula is written out as used.
CI half-width       1.96 × √(p(1−p)/n)

Real 100, p=0.9     1.96 × √(0.09/100)   = ±5.9 pp
Real 100, p=0.5     1.96 × √(0.25/100)   = ±9.8 pp
Real  50, p=0.9     1.96 × √(0.09/50)    = ±8.3 pp
Real  50, p=0.5     1.96 × √(0.25/50)    = ±13.9 pp
Sim 2,000, p=0.85   1.96 × √(0.1275/2000)= ±1.6 pp
Sim 1,000, p=0.9    1.96 × √(0.09/1000)  = ±1.9 pp
Pebblous calculation. Split into ID and OOD, the real sample for each condition is 50 trials, so the lower two rows apply. The success-rate inputs are the readings from Table 2.
Apply that error to an actual decision and the result is unambiguous. To see whether the difference in real success rate between two adjacent checkpoints separates statistically, use the confidence interval on the difference of two independent proportions. Its half-width is 1.96 × √(2p(1−p)/n).
| Comparison | Actual difference | Difference needed to separate | Verdict |
|---|---|---|---|
| π0.5 real, 10K (0.88) vs 20K (0.90) | 2.0 pp | 8.7 pp | Cannot separate |
| GR00T N1.6 real, 30K (0.68) vs 50K (0.67) | 1.0 pp | 13.0 pp | Cannot separate |
Table 4. Pebblous calculation. With 100 real trials there is no deciding which of two checkpoints is better. The normal approximation degrades when n and p are small, so the 10K-iteration point for GR00T N1.6, whose success rate sits near 0.1, is excluded from this test. Both comparisons above fall between 0.6 and 0.9, where the approximation holds.
So the 20-to-1 ratio has to be read the other way around. Run the simulation 2,000 times and you measure to within 1.6 pp, but the answer key that would confirm that precision wobbles by 6 to 10 pp. The mismatch at the end of the curve from section 3, the stretch where simulation went down and hardware went up, is exactly the stretch this sample cannot adjudicate. The resolution of verification is tied to 100 real trials.
To read this fairly you have to look at what World Labs said it would do with this sample. The post names two uses, and the two need different resolution. One is screening. The company wrote that it culls a large share of checkpoints before hardware testing and spends expensive real evaluation only on the most promising policies. For separating two checkpoints as far apart as 0.09 and 0.56, 100 real trials are plenty. At that spacing a 6 pp error does not matter.
The other use is the problem. The same post says the simulated evaluation tracks both improvement and stagnation across training. The original reads "tracks improvements and plateaus across checkpoints." Calling something a plateau is a claim that the difference is near zero, and that claim holds only once you have the resolution that would have caught a difference had there been one. The threshold at which 100 real trials separate two checkpoints is 8.7 pp. Below it, a plateau and a genuine 8.7 pp improvement look identical. The 10K-to-20K stretch for π0.5 in Table 2 sits precisely there. A sample that is generous for screening falls short for calling a plateau.
Laid over the whole pipeline, these sample sizes show where the neck narrows. In the diagram below, filming the physical setup is the input at the far left, and the place the zero-real-training-data claim attaches is the policy-training stretch on the right.
Figure 2. The stage names are transcribed from the description in the World Labs post, and the sample sizes come from that post's figure caption. The error values are Pebblous calculations.
4.2Academia has been putting a number on this claim since 2024
The proposition World Labs argued qualitatively, that simulated evaluation preserves real-world ranking, already has a standard measuring instrument. It is SIMPLER, released in May 2024, a paper written by sixteen researchers from UC San Diego, Stanford, UC Berkeley, and Google DeepMind, which ran roughly 1,500 paired real-and-simulated evaluations over two robots and six public policy checkpoints.
SIMPLER set up two metrics: MMRV, which measures the degree of rank violation, and the Pearson correlation coefficient. The paper defines both in the caption to its Figure 3.
"Illustration of Mean Maximum Rank Violation (MMRV, range [0, 1], lower is better) and Pearson correlation coefficient (Pearson r, range [−1, 1], higher is better) for assessing the correlation between policy performances in real-world and simulation, as well as the overall quality of simulated evaluation pipelines."
Li et al., "Evaluating Real-World Robot Manipulation Policies in Simulation," arXiv:2405.05941Why MMRV was built separately overlaps exactly with this article's argument. The paper spells out for itself where the Pearson coefficient alone fails.
"Pearson correlation does not reflect the range of values it is computed over. Thus, for policy sets that lie within a narrow range of real-world performances, r may change drastically based on small real-world performance differences, which can often be attributed to the inherent noise in real-world evaluations."
Same paper. Elsewhere it writes that r is "overly sensitive to minor noise in evaluations when different policies perform similarly in the real world."The failure mode academia named in 2024 shows up intact at the end of the curve in the World Labs figure. Real-world performance is bunched into a narrow range, and the small differences inside it could come from the noise of real evaluation. SIMPLER built MMRV for exactly that stretch, and it produced actual values. In the real-versus-sim comparison on BridgeData V2, MMRV is 0.014 and Pearson r is 0.890. The baseline that ranks policies by validation loss without simulation averaged MMRV 0.375, against SIMPLER's 0.143. Those two numbers are what show simulated evaluation ranking better than validation loss.
None of these metrics appear in the R2S2R post. An exhaustive search of the source HTML returns zero hits for benchmark, zero for baseline, and zero each for Spearman, Kendall, and MMRV. There is no reference list, no paper link, no code repository link. The word SIMPLER never appears.
4.3The people who built that metric are in the next seat
It is hard to argue the metric went unused because nobody knew about it. Fei-Fei Li is a co-author of WorldScore, the first unified benchmark for world generation, and its senior author Jiajun Wu is also a co-author of SIMPLER. And as section 2 showed, SceniX's Yunzhu Li worked with both of them at the Stanford Vision and Learning Lab. Three strands meet in one lab.
| Person | On the metric-building side | On the company side |
|---|---|---|
| Fei-Fei Li | WorldScore co-author | World Labs co-founder and CEO → AMD EVP and chief scientist |
| Jiajun Wu | WorldScore senior author · SIMPLER co-author | Remains at Stanford |
| Yunzhu Li | — | SceniX co-founder → World Labs → AMD |
Table 5. WorldScore is arXiv:2504.00983; it evaluates 3,000 test examples across 19 models along three axes, controllability, quality, and dynamics. Yunzhu Li's Stanford history was confirmed on his own homepage. A search of the whole Atlas release page returns zero hits for WorldScore.
There is no reason to read this contrast as hypocrisy. Companies use their own metrics all the time, and an existing benchmark may not cover a company's own task. What remains recordable is one thing. A usable metric existed, the people who built it were inside the company, it went unused, and as a result no third party can reproduce or cross-check the result with the same instrument.
One more comparison of scale belongs here. DROID, one public corpus of real-world data, holds 76,000 trajectories and 350 hours, collected over twelve months by fifty people across thirteen institutions. That trajectory count is 38 times the 2,000 simulated evaluations behind a single R2S2R checkpoint. Reading that comparison calls for care not to mix categories. DROID's 76,000 is the size of a training corpus, and the 2,000 is a count of evaluation trials. Set them side by side and read it as simulation replacing real data, and you are matching values from different levels.
Both companies promised an 'open ecosystem,' but the asset is still application-only
The open ecosystem AMD says it will strengthen and the actual openness of the asset it bought do not line up. The mismatch holds without adding any interpretation. Three primary sources fill the table with sentences each of them published in its own place.
Start with AMD. The phrase "open ecosystem" appears three times on a single press release: in the subhead, in the strategy line in the body, and in the quote from CEO Lisa Su.
"Acquisition brings leading AI model research expertise to AMD, helping to shape future AI infrastructure and strengthen the open AI ecosystem."
Subhead of the AMD press release · The body reads, "The acquisition advances AMD's strategy to deliver AI infrastructure for an open ecosystem.""Building the compute platforms for the next generation of AI requires a deep understanding of how models are evolving. … Together, we can use that insight to develop the hardware, software and systems that will power the next generation of AI and strengthen the open AI ecosystem."
Lisa Su, chair and CEO of AMDFei-Fei Li's quote in the same press release does not contain the word open. She writes that model research, systems, and compute require close collaboration, and that joining AMD brings the resources and engineering capability to accelerate the research, and there it ends. On the company blog and in her own piece that same day, though, the situation is different. World Labs wrote that it is committed to building an end-to-end open AI ecosystem spanning "hardware, software, platforms, and widely accessible open models," and Fei-Fei Li wrote that she is committed to delivering "the best open models and platforms." The promise to release open models is not AMD's alone. It is what the company being acquired wrote under its own name on announcement day. Which makes the table below not an exhibit of hypocrisy but a record of the day that promise started.
Next is what World Labs actually opened. Atlas went out as early access by application with selected partners, as the company itself stated. No weights, no code, no training or synthetic datasets, no evaluation tooling. The benchmark numbers from section 3 are all in-house evaluations, with no route for anyone else to measure under the same conditions.
Third is a competing product addressing the same problem. In its Cosmos 3 technical report of June 22, 2026, NVIDIA described its release scope this way.
"To accelerate open research and deployment in Physical AI, we make our code, model checkpoints, curated synthetic datasets, and evaluation benchmark available under the Linux Foundation's OpenMDW-1.1 License."
NVIDIA, "Cosmos 3: Omnimodal World Models for Physical AI," technical report, June 22, 2026The table below runs item by item, one column per source, so what is open and what is closed line up.
| Item | What the AMD release says | What World Labs actually opened | NVIDIA Cosmos 3 |
|---|---|---|---|
| Wording | "strengthen the open AI ecosystem" | — | "accelerate open research" |
| Model weights | — | Early access by application | Released (OpenMDW-1.1) |
| Code | — | None | Released |
| Training and synthetic datasets | — | None | Released |
| Evaluation benchmark | — | None | Released |
| Robot policy checkpoints | — | None (the models evaluated belong to others) | Cosmos3-Nano-Policy-DROID |
| Third-party evaluations cited | — | In-house human preference voting | Artificial Analysis · RoboArena · PAI-Bench |
Table 6. All three columns come from primary sources. The World Labs column is the Atlas release page; the NVIDIA column is the Cosmos 3 technical report. The released checkpoints include the Cosmos3-Super and Cosmos3-Nano families, and the released synthetic datasets are SDG-PhyxSim and SDG-RobotSim.
The sharpest cell is not weights but the evaluation benchmark. NVIDIA released even the tooling that lets others check its own work, and World Labs did not release the tooling that would let anyone check its results. Yet the phrase "open ecosystem" sits in the AMD press release.
AMD's open ecosystem is not merely talk, though. The robotics processor from section 2.2 runs on Linux and the ROCm software stack, uses standard frameworks such as PyTorch and ONNX, and the company put its tooling for porting CUDA code to ROCm forward as grounds for avoiding vendor lock-in. At the software layer it does stand on the opening side. So the gap the table above points at is not the software layer. It is the model and evaluation layers. And those two layers are exactly what this acquisition brings inside AMD.
There is one thing to add to that contrast. NVIDIA makes its money on chips, so its incentive to open models is large: getting world models widely used is the same thing as selling more accelerators. So the contrast is not a story about NVIDIA being virtuous but a story about business structure setting the scope of release. And AMD is a chip company too. Which is why the open question in this deal is which way the gap between the phrase "open ecosystem" and an application-only asset gets closed.
A related point cannot be asserted either way. NVIDIA is on the investor list for the February 2026 World Labs round, which invites the inference that it will receive AMD stock in an all-stock deal. But how existing investors' stakes are handled is something neither AMD nor World Labs has stated. Team size and the commercial fate of Marble, Atlas, and World API are likewise unstated.
5.1A first clue to a question an earlier article asked
On September 21 Pebblous published The Data Supplier Doesn't Know What the Data Is For, on the problem of a data vendor not knowing what target it is building toward. The argument was that the bottleneck is not the volume of data but the aim, and the third item on the checklist handed to readers read: "Does the supplier know before starting how we will evaluate the delivery? Keeping the scoring sheet hidden until the end means the next round will not improve."
This episode gives that question its first concrete answer. World Labs hung its scoring sheet out in public. It stated in prose what makes a simulation worth using and what has to be matched to pass. On that count, the gap the earlier article regretted has been filled. But the scores produced with that sheet live only inside a figure, and the tooling that would let anyone else score with the same sheet was not released. The checklist from that earlier piece becomes the lens for reading this one.
Why this matters to Pebblous
The place this acquisition touches has the same shape as the place Pebblous keeps meeting in data-quality work. The three passages below are not a product pitch. They look at how the structure the earlier sections exposed shows up again in practice.
6.1With no raw material to filter, "ready" gets redefined
AI-Ready Data has meant sorting what was collected, labeling it, and filtering out the defects. Once the floor a robot will step on, the cable it will pick up, and the lighting it will stumble in arrive as model output rather than recorded measurement, that order inverts. There is no original to filter, and what was generated is the original. Judging readiness comes before sorting.
If DataClinic is a tool for diagnosing defects in a dataset, then in synthetic environments the definition of the defect to diagnose has to be rebuilt first. The definition World Labs wrote, the condition that a simulation need only lead you to the same decision reality would, is the most concrete answer currently on the table in this industry. It is a proposition worth taking a position on, whether that position is acceptance or rebuttal.
6.2A quality metric that dropped from cardinal to ordinal
Translate World Labs' redefinition into the language of metrics and it is a drop from cardinal to ordinal. You only have to get right which of two policies is better; how well either performs can be wrong. That relaxation lifts development speed a great deal, because real-world evaluation is the most expensive resource there is.
There is a cost. An ordinal metric collapses along with the distribution when the distribution shifts. If both training and evaluation happen in worlds from the same generator, then in the situations that generator missed there is no guarantee even the ranking survives. And as section 4 computed, the sample confirming the ranking is 100 real trials per checkpoint, and those 100 cannot separate adjacent checkpoints. The distance between the rank-preservation claim and the sample that confirmed it is the least-known value in this deal.
6.3Next year's pitch, and the line to ask back
The pitch robotics, autonomous driving, and logistics-automation customers will get next year will look something like this. Cut your real-world collection, train in generated environments, and spend hardware evaluation only on your top checkpoints. Economically it is a powerful offer. What a practitioner has to ask about is not the price but the acceptance terms.
Pebblous does not have to imagine the shape of that pitch. The R2S2R post already wrote it down. The company itself wrote that aligned simulation can be evidence of becoming "a primary source of training experience for real-world robot deployment, not merely a supplement to hardware data," and followed it immediately with a sentence about the enormous economic implications of the technology. The same post says R2S2R works independently of policy and embodiment, so customers running different robots, sensors, and policy stacks can be served by one system, and says the demonstration tasks were drawn from customers. The pitch is already on paper.
- What shows that the generated environment resembles our worksite closely enough? Fidelity or decision equivalence, and which of the two yardsticks sets the pass mark?
- How many real trials confirmed that rank preservation holds on our task too? How many percentage points of error do those trials leave?
- Does responsibility for finding the situations the generator missed sit with the supplier or with us?
- Does tooling for a third party to measure the same result come with it?
Evidence that those four questions are not excessive sits on the buyer's side of this deal. In its July robotics processor launch, AMD put forward a figure of up to 3.4 times the real-time reliability of a competing product, and printed the conditions in the footnote. The benchmark was commissioned by AMD, the measurement ran on a consumer mini PC configured to the X199 specification, and the comparison was against an NVIDIA Jetson AGX Thor developer kit. It also recorded the institution that ran the measurement, the publication date, and the report's address. That is the practice of writing down for yourself the conditions your own number came out of. The layer missing from the R2S2R post is exactly that layer.
The fourth question is the one this episode answered last. A chip company bought a world-model lab, the world-model lab bought a robot simulation company, and with that the generator and the verifier moved under the same roof. The practice of footnoting conditions and the practice of keeping the scorecard inside a figure are now in the same company too. Which one survives is the thing to watch in this acquisition. Everything up to here is fact confirmable by dates and documents. Which seat in that structure is left empty is for the reader to judge.
What could not be confirmed is recorded too. The success rates from the R2S2R figure are values Pebblous read by magnifying the image, so the second decimal place falls inside the reading error, and World Labs did not publish them as numbers. No statement from the a16z conversation is quoted. The video's auto-generated captions are machine transcription and no original transcript is public, so verbatim checking was impossible; what was verified stops at the video description and chapter list a16z published. A remark by an AMD executive about competing with customers came by way of an analyst post, so it is not used here. Precedents for all-stock deals beyond Xilinx, and the regulatory review schedule including China, were not researched. Because the merger agreement was not attached to the 8-K, the closing conditions and the treatment of existing investors' stakes cannot be confirmed from the public record. SceniX's employee count and funding history are third-party database aggregations, not figures the company published. Thank you for reading a long article.
References
The evidence behind this article runs in four strands. Items 1 through 6 are AMD filings, press releases, and product announcements, the source of the deal terms, the Xilinx precedent figures, and the robotics processor timeline in section 2.2. Items 7 through 14 are World Labs' own primary sources, from whose sentences and figures the readings in section 3 and the SceniX attribution in section 2 come; that attribution appears in two places, the July post and the CEO's September letter. Items 15 through 18 are the academic anchors for section 4, and from item 19 on come industry technical documents, press coverage, and an earlier Pebblous article. The confidence intervals in section 4 and the cell-by-cell contributions in section 3 were computed by Pebblous, with the formulas shown in the body.
Primary corporate filings and press releases
- 1.AMD. (2026-09-28). AMD to Acquire World Labs to Advance the Future of AI Compute. AMD Newsroom / Investor Relations. Source of the subhead, the Lisa Su and Fei-Fei Li quotes, and the verbatim asset description.
- 2.AMD. (2026-09-26). Form 8-K (amd-20260926). SEC. The undetermined share count, the ten-trading-day weighted-average formula, and the private-placement authority cited.
- 3.AMD. (2026). Form 10-Q, FY2026 Q2 (period ended 2026-06-27). SEC. Shares outstanding of 1.632 billion, revenue of $11.5 billion, R&D expense of $2.528 billion.
- 4.AMD. (2022). Form 10-K, FY2022. SEC. Xilinx purchase consideration at closing of $48.8 billion, 429 million shares issued, applied share price of $113.18.
- 5.AMD. (2026-07-23). AAI 2026: AMD Delivers Leadership Heterogeneous Compute for Physical AI. AMD Newsroom. The robotics application areas for the Ryzen AI Embedded X100 series, June sampling and Q4 production schedule, and the Advancing AI 2026 launch. The event date and venue were confirmed in AMD's April 28, 2026 release "AMD Announces 'Advancing AI 2026'" (July 23, Moscone Center, San Francisco).
- 6.AMD. (2026-07-23). From Benchmarks to Behavior: Rethinking Performance in Autonomous Robotics. AMD Blogs. The 3.4× real-time reliability figure and the conditions in its footnote (commissioned by AMD, measured on a mini PC configuring a Ryzen AI Max+ 395 to the X199 specification, compared against an NVIDIA Jetson AGX Thor developer kit, published by Open Navigation LLC on 2026-07-23).
World Labs primary sources
- 7.World Labs. (2026-07-28). Building Worlds That Train Robots. The R2S2R post. The readings in Table 2 come from the chart image in this piece (
wlt-ai-cdn.art/videos/2026-robotics-blog/diagram-2.png, a 4327×2027 PNG). It is also the source of five verbatim quotations. - 8.World Labs. (2026-07-21). World Labs Acquires SceniX. About 230 words in full. No founders, team size, terms, or technology are stated, and it closes on "We'll share more soon."
- 9.World Labs. (2026-09-01). Atlas: A World Model for Spatial Intelligence. The values in Table 3 were extracted exhaustively from the text nodes of this page's SVG chart. The five human-preference figures and the early-access-by-application description are on the same page.
- 10.World Labs. (2026-06-03). A Functional Taxonomy of World Models. The renderer, simulator, and planner categories and the passage calling the simulator the linchpin.
- 11.World Labs. (2026-02-18). Series B round announcement. The $1 billion raised and the investor list (AMD, Autodesk, Emerson Collective, Fidelity, NVIDIA, Sea). No valuation is stated.
- 12.a16z. (2026-07-28). Fei-Fei Li on Spatial Intelligence and Robotics (Martin Casado · Fei-Fei Li · Yunzhu Li, 42 min 21 sec). The conversation the R2S2R post links directly. youtube.com · Only the video description and chapter list were checked; no statement is quoted.
- 13.World Labs. (2026-09-28). World Labs is Joining AMD. The acquisition notice. Source of the account that the model-training and inference-optimization partnership on AMD GPUs began last year, and of the verbatim "widely accessible open models."
- 14.Li, Fei-Fei. (2026-09-28). To Seek a Newer World. Her own newsletter, the CEO's letter that the acquisition notice links as "here." The second primary source for the SceniX attribution, and the place that carries the AMD collaboration since the company's earliest days, the account of Lisa Su as an early investor, Atlas "even by specialized models," and the commitment to deliver open models.
Academic
- 15.Li, X., Hsu, K., Gu, J., Pertsch, K., Mees, O., Walke, H. R., Fu, C., Lunawat, I., Sieh, I., Kirmani, S., Levine, S., Wu, J., Finn, C., Su, H., Vuong, Q., & Xiao, T. (2024). Evaluating Real-World Robot Manipulation Policies in Simulation (SIMPLER). arXiv:2405.05941. The MMRV and Pearson definitions and values were confirmed directly in the PDF body and tables. arxiv.org
- 16.Duan, H., Yu, H.-X., Chen, S., Fei-Fei, L., & Wu, J. (2025). WorldScore: A Unified Evaluation Benchmark for World Generation. arXiv:2504.00983 (v2 2025-11-29). 3,000 test examples across 19 models. arxiv.org
- 17.Khazatsky, A., et al. (2024). DROID: A Large-Scale In-the-Wild Robot Manipulation Dataset. arXiv:2403.12945. 76,000 trajectories, 350 hours, thirteen institutions, twelve months.
- 18.Open X-Embodiment Collaboration. (2023). Open X-Embodiment: Robotic Learning Datasets and RT-X Models. arXiv:2310.08864. The reference point for real-world corpus scale.
Industry technical documents
- 19.NVIDIA. (2026-06-22). Cosmos 3: Omnimodal World Models for Physical AI (technical report). The verbatim OpenMDW-1.1 license passage and the list of released checkpoints, datasets, and evaluation benchmark.
- 20.NVIDIA. GR00T-N1.6-3B model card. Hugging Face. The description of mixed training data including "real captured data."
- 21.Physical Intelligence. openpi repository README. "pre-trained on 10k+ hours of robot data."
- 22.Yunzhu Li's personal homepage. The verbatim record of the Stanford Vision and Learning Lab postdoc and the MIT CSAIL advisors.
Press
- 23.CNBC. (2026-09-28). AMD acquiring Fei-Fei Li's World Labs AI firm in deal worth $8.2 billion. Source for the separate operation before closing. The passage about planning chip requirements years ahead from next-generation model research is the reporter's characterization, not AMD's official wording.
- 24.Bloomberg. (2026-01-23). Fei-Fei Li's AI Startup World Labs in Funding Talks at $5 Billion Valuation. The first report of the $5 billion valuation, which World Labs neither confirmed nor denied.
Earlier Pebblous article
- 25.Pebblous. (2026-09-21). The Data Supplier Doesn't Know What the Data Is For. On the problem of the spec a data vendor is meant to hit going undisclosed; the checklist quoted in section 5.1 is in that piece. blog/world-model-secrecy-data-spec