Executive Summary
There is no shortage of indexes for how far AI reaches into an occupation. What the technology can do in principle. What of that has become a usable product. What people have tried out. All three ask the same question: does AI touch this work? A team at KAIST asked a fourth one. Did a worker hand the work over? Their evidence is not a chat log. It is the agent configuration files people have written and published in open repositories. A configuration only exists because someone wrote down the goal, the procedure and the tools in advance, and once written it runs again and again. So it is not a record of having tried something. It is a record of having committed to it.
The map that comes out of that data barely touches the computerization risk map drawn in 2017. The overlap is far below what you would expect from shuffling the two lists at random. Delegation tracked whether the tools already reach a job far more closely than it tracked where people have actually been observed using AI. Writing a configuration costs effort, so people spend that effort only where the technology dependably works. And the curve peaks around bachelor's-degree occupations and falls away on both sides. The fall at the bottom has an explanation: the tools cannot yet do that work. The fall at the top does not. The tools reach it, and it was not handed over.
The authors set two readings side by side and refuse to choose. Either that work cannot be written down in advance, or it can be and professionals are declining, slowing the rate at which their own work gets codified. Their data cannot separate the two. Either way, the line being drawn is not about capability. It is about whether the work can be specified in advance. Read that way, this is not a map of jobs AI has eaten. It is a boundary between work that has already become data and work that has not.
Four numbers this report rests on
These four carry the argument. The first two say what the map is made of and how far it diverges from the old one. The third is the evidence that what moves this index is the reach of the tools rather than socioeconomic position, and the fourth is the size of the hole that reach does not fill.
53,515
agent specifications analyzed
What survived filtering from 117,887 collected, matched all-to-all against 17,951 task statements
0.05
overlap with the 2017 risk list
Jaccard index. Two unrelated lists would be expected to land at 0.23 to 0.33 (this report's estimate)
57.8%
of the variation explained by availability alone
More than the 34.9% from a model with wages and education combined
−0.018
shortfall for master's-level occupations
Against bachelor's-level occupations, surviving the availability control. Roughly 12% of the full AAI range
A Fourth Layer of AI Exposure
Attempts to measure what AI does to work have run along three tracks for the last decade. The first asked what the technology can do in principle. Felten and colleagues mapped progress in AI capabilities onto job requirements. The second kept only the part of that potential that had turned into something you can actually buy and use. Eloundou and colleagues took as their test whether a large language model could cut the time to complete a task by at least half. The third went straight to the logs, counting how often each kind of work shows up in real conversations, as Anthropic's economic index does.
The paper's argument is that all three are variations on one question. Its own sentence: "each measures how far AI could or does touch an occupation's work, not whether a worker has committed the work to it." They measure how far AI reaches into the work. They do not measure whether the worker handed it over. The fourth layer the authors propose is delegation.
The four layers line up like this. The first three each correspond to an established family of measures; only the last is new here.
| Layer | What it measures | Representative work |
|---|---|---|
| Capability | The technical ceiling | Felten et al. 2018, 2019 |
| Availability | The part of that ceiling that became a product | Eloundou et al. 2024 |
| Observed use | What people have been seen using | Handa et al. 2025, Massenkoff & McCrory 2026 |
| Delegated | What a worker has committed to AI | This paper's proposal |
Splitting the first three apart is itself a claim. Earlier work separated use from the rest, the authors note, but it did not pull availability out of capability. What is possible in principle and what has become a thing you can pick up are different questions, and folding them together makes it impossible to tell a job the technology cannot do from a job for which nobody has shipped a tool. Why that distinction matters comes back as the conclusion in section 5.
1.1Why chat logs will not do
The obvious objection: if you want to know whether people have handed work to AI, why not read the conversations? The authors give two reasons. First, sessions and tasks do not line up one to one. One session mixes several jobs; one job is scattered across several sessions. Second, a prompt carries no commitment. A one-line question might be an experiment, used once and never again.
A configuration file is different on four counts, by the authors' account. The user wrote it. It describes what the work is at roughly the same level of abstraction as a job description. It costs effort to produce. And once produced it runs repeatedly. The third and fourth points do the real work: effort means people do not write one for just anything, and repetition means this is not a one-off trial.
Figure 1 of the paper draws the four layers as nested boxes. The caption reads "Four nested layers … Each layer is nested within the one before it". The diagram below follows that structure, with one warning attached. This is a conceptual containment, not an ordering confirmed in the data. Whether delegation actually behaves that way is settled in section 4. It does not.
The conceptual containment of the four layers, redrawn by Pebblous from Figure 1 of the paper. Whether the delegated layer really sits inside the observed layer in the data is checked in section 4.
Matching 53,000 Config Files to Job Descriptions
The paper introduces the file format in a sentence and moves on, as something a marketplace happens to collect. But the lineage of the format is what tells you where the sample is skewed. It starts on 16 October 2025, when Anthropic released Agent Skills. Two months later, on 18 December, the format was opened as a vendor-neutral specification, and within 48 hours Microsoft's VS Code and OpenAI's ChatGPT and Codex CLI were reading the same files. By March 2026 the list of tools supporting it had reached 32, including Gemini CLI, JetBrains Junie, AWS Kiro and Block Goose.
One skill is one directory. At the top of its SKILL.md sits a YAML front matter block with a name and a description; below that come the execution instructions. The guidance is to stay under 500 lines, and because the format loads progressively, an agent reads only 30 to 50 tokens per skill at startup.
It is also worth being exact about where the corpus comes from. The marketplace the paper used is not a store where users upload files. It is a service that crawls public repositories, GitHub above all, and indexes the skill.md files already sitting there. As of mid-2026 it had indexed 2.6 million of them from roughly 320,000 repositories and 230,000 contributors, the paper reports. The authors acknowledge that the contributor base skews toward technically sophisticated early adopters, while adding that the skills themselves span nearly the whole occupational range, from highly specialized work to routine administrative chores.
Two things follow. The good news is that the corpus is not tied to a single vendor. The bad news is that the format was born inside coding agents and spread through developer tooling. That is why the crowd of technical writers, computer programmers, information systems managers, user support specialists and software developers in the top 20 delegated occupations, which we will get to shortly, cannot be read purely as a property of the work being measured. Add to that the interval between the specification going public and the paper being submitted: about ten months. The observation window is that short.
2.1Two streams meeting in a funnel
The measurement is a matching of two streams. On one side, agent specifications. On the other, O*NET task statements. Both lose a substantial share along the way. On the specification side, files with descriptions under 100 characters or without execution instructions drop out, and GPT-4o-mini then screens what remains for work relevance. On the task side, 846 statements without importance ratings drop out, taking 26 occupations with them entirely.
The sampling funnel. Do not read the 2.6 million indexed files and the 53,515 used in the analysis as one number. The "roughly 18,000" in the abstract refers to the 18,797 task statements in total; the figure that actually enters the calculation is 17,951.
2.2The AAI is not a count
There is one common way to misread this index, and blocking it first is what makes every later number legible. The Agentic Adoption Index does not count how many agents exist for a given task. It takes one task statement, compares it against all 53,515 items in the corpus one by one, and averages those 53,000-odd cosine similarities. Not the top few. Not the number above some threshold. The authors' phrasing is "averaging its cosine similarity across all skill descriptions in the corpus". Those task-level means are then averaged again, weighted by O*NET importance, to give the occupation-level AAI.
One more adjustment goes into the weighting. Because occupations differ in how many task statements they carry, the importance weights are normalized to sum to one within each occupation. That structurally prevents a long task list from inflating a score on its own.
Which is why the values are confined to a band between 0.041 and 0.192. The mean is 0.11, and the middle half sits between 0.10 and 0.13. Even one perfectly matched agent for a given task is buried under 53,000 unrelated specifications and barely moves the number. The authors say as much: the index is "designed for comparison across occupations rather than interpretation on an absolute scale". Reading an AAI of 0.19 as "19% of the work is automated" gets it completely wrong.
2.3Why re-measure when the labels were already there
One methodological choice stands out. The marketplace already tags around 90% of its skills with O*NET occupation codes. Aggregating those labels would have been far simpler. The authors did not. To see how a single skill spreads across several occupations, they judged, you have to measure everything against everything. They chose computation over trusting the labels.
For robustness they swapped the embedding model. Occupation-level AAI values built with the 384-dimensional all-MiniLM-L6-v2 correlate with those from the larger all-mpnet-base-v2 at a Pearson coefficient of 0.91. Note what that does and does not cover: it is a correlation between aggregated occupation scores, not a claim that individual sentence pairs receive the same similarity. It vouches for the stability of the ranking, not for the meaning of the absolute values.
It Does Not Overlap the 2017 Risk Map
The first thing to do with a new index is hold it against an old one. The comparison chosen here is Frey and Osborne's 2017 list of computerization risk, the starting point of most automation debate since. How much does the delegation map overlap with it? Start with the faces at either end.
| Most delegated | AAI | Least delegated | AAI |
|---|---|---|---|
| Management analysts | 0.192 | Oral and maxillofacial surgeons | 0.041 |
| Technical writers | 0.182 | Tapers (drywall finishing) | 0.041 |
| Natural sciences managers | 0.176 | Automotive glass installers and repairers | 0.047 |
| Computer programmers | 0.175 | Podiatrists | 0.047 |
| Production, planning and expediting clerks | 0.172 | Roofers | 0.048 |
The table shows five on each side, but read down to twentieth place and one entry catches the eye. Nineteenth is first-line supervisors of construction trades and extraction workers, at 0.161. This is not purely an information-sector list. Even a field occupation rises if the center of gravity of the job is scheduling, reporting and documentation. What the index separates looks less like industry and more like the shape of the work.
A number not in the paper, added here for a sense of scale. According to the US Bureau of Labor Statistics Occupational Employment and Wage Statistics for May 2025, those top five occupations employ about 1,535,000 people in the United States alone: 898,280 management analysts, 390,160 production, planning and expediting clerks, 108,690 natural sciences managers, 92,230 computer programmers and 45,500 technical writers. Median annual wages run roughly $102,000, $60,000, $167,000, $100,000 and $90,000 in that order. Delegation is not concentrated in some fringe of the labor market.
The other end behaves differently. Oral and maxillofacial surgeons number only 4,910 nationwide, small enough that the wage statistics show the median above the mean, an inversion common in thin samples. Treat that occupation's numbers as illustrative rather than representative.
Put both ends on one axis and the character of the index becomes visible before any statistic is quoted.
Drawn with the axis starting at zero. The gap between top and bottom is nearly fivefold, yet the values themselves are trapped in a narrow band between 0.041 and 0.192. This is where you can see with your own eyes that the index is a mean similarity, not a proportion.
Before any index is computed, simply overlaying the two maps already shows something. The paper scatters 748 occupations with computerization risk on the vertical axis and delegation on the horizontal. Occupations that shared a risk grade in 2017 spread widely along the delegation axis. Within the low-risk cluster, oral surgeons, prosthodontists and podiatrists sit at the very bottom of delegation while management analysts, industrial engineers and natural sciences managers sit at the very top. The high-risk cluster splits the same way: roofers and tire builders below, technical writers and statistical assistants above. A single cell of the old map held occupations with opposite properties.
3.1What an overlap of 0.05 means
The formal comparison ran like this. The 748 occupations were split at the median of AAI into two groups of 374, and the overlap between the high-delegation group and Frey and Osborne's high-risk group was measured with the Jaccard index, the size of the intersection divided by the size of the union. The result was 0.05.
Stop there and it reads as "not much overlap." But knowing how low 0.05 is requires a baseline. What would the Jaccard index be if the two groups were drawn with no relation to each other at all? One side is exactly half the population, so the arithmetic is easy. Below are estimates we computed for this report.
| Assumed share at high risk | Expected Jaccard if the two are unrelated |
|---|---|
| 30% | about 0.231 |
| 40% | about 0.286 |
| 47% (the figure usually quoted) | about 0.320 |
| 50% | about 0.333 |
Whatever assumption you plug in, the answer lands between 0.23 and 0.33. The observed 0.05 is more than four times below even the lowest of those. The two maps are not merely unrelated. They overlap less than random tagging would produce. Turned away from each other is the accurate description. Where one map marks danger, the other systematically looks elsewhere.
One piece of support for that estimate. The distribution of automation probabilities Frey and Osborne produced is bimodal, with a peak at each end. Most occupations cluster near 0 or near 1, so setting the high-risk cutoff at 0.7 or at 0.8 barely changes how many occupations qualify, which makes the sensitivity table above conservative rather than generous. One caveat on the 47% that everyone quotes: it is a share weighted by employment, not a count of occupations. The original sentence is that 47% of total US employment falls in the high-risk category, and of the 702 occupations only 70 were hand-labeled.
The authors report that the weak overlap is not confined to the occupation level. Group by industry sector or by state and the two maps diverge just the same. When a result holds across changes of aggregation, it becomes hard to dismiss as noise in one index. The three figures cited as evidence, however, live in supplementary material that is not attached to the current public version, so this item rests on the body text alone.
3.2The comparison itself has not aged well
Which map, then, is right? As it happens, the 2017 map already has a report card. In 2022 the Information Technology and Innovation Foundation checked Frey and Osborne's 2013 predictions against actual employment change from 2013 to 2021. Insurance underwriters, flagged as maximum risk, grew 16.4%. Recreational therapists, the canonical minimum-risk case, shrank 8.9%. The correlation between risk score and actual employment decline came to roughly −0.26. That analysis is a think tank report rather than a peer-reviewed paper, which is worth stating plainly.
The methodological critique is older still. When OECD researchers reapplied the same approach at the task level rather than the occupation level, the average high-risk share across 21 countries fell to 9%. Judging a whole occupation automatable or not, they argued, inflates the estimate by construction. That figure reaches us through a secondary citation.
So 0.05 admits two readings. The new map refutes the old one, or the two maps were measuring different things from the start. The second is closer to right. The 2017 criterion was repetitive, routinized manual work; where agents are pushing in now is analysis, documentation and coordination, work made of information. Two different kinds of job shared a risk grade, so the rankings come apart wholesale.
It Tracks Capability, Not Observed Use
Diverging from the old map does not tell you what the new index is. So the authors correlated it, by rank, with a representative measure from each of the three layers. This is the part of the paper that will be quoted most often.
How the comparators were chosen is on the record too: each had to target current language models or agents, to sit on a different layer using a different method, and to produce a score comparable at the occupation level. One measure per layer met all three conditions. Their scales, however, have nothing in common. The availability measure spreads across the full 0 to 1 range with a median of 0.43. The observed-use measure has a median of 0.01, a bottom quartile pinned at zero, and a tail stretching right to 0.51. The capability measure runs from 0 to 69.42. With scales that incommensurable you can only compare ranks, which is why Spearman correlations were used. Keep the flattened observed-use distribution in mind when the 0.374 arrives.
| Layer | Comparison measure | Spearman ρ |
|---|---|---|
| Capability | Reinforcement learning suitability (Tomei & Klein Teeselink) | 0.673 |
| Availability | Exposure rubric (Eloundou et al.) | 0.623 |
| Observed use | Composite usage measure (Massenkoff & McCrory) | 0.374 |
Read it precisely. The first two are not far enough apart to rank. That is the authors' own wording: the index correlates "about equally" with the capability and availability measures, with "only a small gap" between them, while its correlation with observed use is "comparatively weaker". The structure is (capability ≈ availability) versus observed use, not capability first and availability second.
The first two bars should be read as the same height; the authors say directly that only a small gap separates them. Note also that the four measures cover different numbers of occupations (748, 606, 618, 511), so each correlation runs on a different pairwise intersection whose size the paper does not report.
4.1What the comparison measures actually are
To use these three numbers properly you need to know what sits on the other side of each. All three are easy to misjudge from the name alone.
The reinforcement learning suitability index scores the 17,951 O*NET tasks in two stages. First a binary question: does the task require physical intervention? If so it scores zero on the spot. Whatever passes is then rated 1 to 10 on eight dimensions, including how the output can be verified and how well formed it is, averaged and rescaled to a 0 to 100 range. The main rater is Gemini 2.5 Flash. The range of 0 to 69.42 that appears in this paper's table is not an oddity; it is what that 0 to 100 scale produces once tasks are aggregated to occupations.
The exposure rubric assigns each task one of three values. Zero for no exposure, 0.5 for exposure only with additional software layered on top, 1 for exposure to a language model on its own. The test was whether completion time could be cut by at least half while holding quality. One notational point needs correcting here. This paper labels the measure with the Greek letter gamma, but the original paper and the literature that follows it call it beta. Gamma is this paper's own renaming, so a phrase like "Eloundou's gamma" does not hold up.
The composite usage measure is the most easily misread. It comes from Anthropic economic research published on 5 March 2026 rather than an academic paper, and more importantly it is not a raw count of conversations. It first restricts to tasks theoretically exposed under the rubric above, keeps only those whose work-context use in Claude traffic clears a threshold, weights automation-type use at 1 and augmentative use at 0.5, and averages by task time share. Precisely stated, it measures the subset of theoretically possible work that is actually being used.
4.2Two observations of our own
What follows is not in the paper. We found it by reading the source documents behind the comparison measures, so it should not be attributed to the authors.
First, adding the usage condition lowers the correlation. As just described, the composite usage measure contains the exposure rubric inside itself. The two share components. Yet delegation correlates with the rubric alone at 0.623, and with the composite that multiplies the rubric by an actual-use condition at 0.374. Shared components and all, one extra condition pushed the correlation down. That structure hardens the claim that delegation does not follow observed use. For what it is worth, Anthropic itself reports that the rubric alone shows no relationship with Bureau of Labor Statistics employment projections while the composite does: a 10 percentage point rise in coverage goes with a 0.6 percentage point lower projected employment change for 2024 to 2034.
Second, much of this three-layer comparison may be measuring one thing three times. The team behind the reinforcement learning index states in its conclusion that its measure and the exposure rubric correlate at 0.88 across all tasks, but that the correlation collapses to 0.15 once you drop physically infeasible work and keep only what is digitally feasible. They attribute the high figure "partly due to the physical feasibility gate". And 40.7% of O*NET tasks score zero at that gate.
The paper checks the same axis once in passing. Comparing the AAI with a cognitive-ability share built from O*NET ability importance ratings yields a positive correlation, confirming that highly delegated occupations lean on cognitive rather than physical or psychomotor abilities. The coefficient is not printed in the body and the figure lives in the supplementary material. So the paper does register that the axis exists; what we add is that the axis may also be generating much of the correlation among the measures.
The bottom of the delegation map, filled with tapers, roofers and automotive glass installers, looks like the same axis showing through. A large part of why the three measures move together may be one distinction: work made of information versus work done with the body. This reading is ours, not the paper's.
There is also a counterexample to the idea that a correlation of 0.673 guarantees agreement occupation by occupation. The reinforcement learning team offers natural sciences managers as their showcase of a job with high language model exposure but low reinforcement learning suitability. In this paper the same occupation ranks third in delegation, at 0.176. Low on one index, top of the list on another.
4.3The nesting diagram does not hold in the data
Their explanation is compact. Specification takes effort, so people only spend it where the technology reliably works, which is why delegation resembles capability more than use. Then one further sentence: "Conversational records, in turn, may understate how far practitioners have committed to automating work." Chat logs may understate how deeply people have already committed to automating their own work.
Now to collect what section 1 postponed. In the conceptual diagram the delegated layer sat inside the observed layer. The data do not follow that order. Delegation sits closest to the most distant layer, capability, and furthest from the layer immediately outside it, observed use. This is not a contradiction on the authors' part. It is a gap the index opens up: a containment that holds conceptually does not hold empirically.
The Curve Peaks at the Bachelor's and Falls on Both Sides
So far we have looked at where delegation concentrates. Now for what produces that distribution. The authors line up three employment-weighted regressions: wages and education only, availability only, then everything together. Setting the three side by side is what makes the paper's conclusion visible.
They also say why the weighting is there. Counting each occupation title once gives a job with 5,000 workers the same weight as one with 900,000. Weighting by 2025 employment makes the result a statement about the distribution of the workforce rather than the distribution of a list of job titles.
| Term | Model 1 wages and education |
Model 2 availability only |
Model 3 everything |
|---|---|---|---|
| Intercept | −2.497 (0.521) | 0.092 (0.001) | −1.081 (0.404) |
| Availability exposure | — | 0.055 (0.002) | 0.046 (0.002) |
| Log wage | 0.447 (0.094) | — | 0.201 (0.073) |
| Log wage squared | −0.019 (0.004) | — | −0.009 (0.003) |
| High school or less (base = bachelor's) | −0.011 (0.003) | — | −0.002 (0.002) not significant |
| Master's or above (base = bachelor's) | −0.026 (0.005) | — | −0.018 (0.004) |
| R² | 0.349 | 0.578 | 0.621 |
| Observations | 560 | 593 | 560 |
Standard errors in parentheses. Employment-weighted least squares. Every term except the one marked otherwise is significant at the 0.1% level.
5.1Availability alone explains more than half
Model 2 is what catches the eye first. One variable, and a variable that only asks whether the tools reach the work, accounts for 57.8% of the variation in delegation exposure. That is more than the 34.9% from model 1, which has wages and education in it. Whether a substitute already exists explains delegation far better than where a job sits socioeconomically.
The authors pause to say why that is surprising. Economics of technology has a long-settled expectation that general purpose technologies do not pay off on adoption alone. Returns arrive after firms redesign processes, retrain people and reorganize themselves, which is why use always lags capability. Here one variable about whether the tools reach the work explained more than half of delegation on its own. At least in this early phase of agent adoption, those complementary investments may matter less than expected.
Two reasons are offered. First, agents are configured in natural language, so the distance between recognizing that a job could be automated and actually building the thing is short. The files examined here were written, used and published by individuals with no procurement, no integration project and no specialist intermediary in between. The steps that normally sit in the middle of enterprise technology adoption are simply absent. Second, because the technology is general purpose, it bends to the work rather than the work bending to it, which removes much of the mutual adjustment that usually slows adoption down.
Model 1 is where the shape behind this report's title comes from. The linear term on log wage is positive at 0.447 and the quadratic term negative at −0.019. A concave curve, in other words: delegation rises with wages up to a point and then falls again. Education shows the same shape. With bachelor's-level occupations as the baseline, occupations requiring high school or less sit at −0.011 and those requiring a master's or more at −0.026. Both ends are low.
The conclusion comes in model 3. Once availability is controlled for, the two education coefficients part ways. The gap for high school or less shrinks to −0.002 and loses statistical significance. The reason the bottom does not delegate is that the tools have not reached that work yet; account for how far they reach and the explanation is complete. The master's-level gap, meanwhile, survives at −0.018. The authors' sentence puts it exactly: "What makes the master's-degree gap notable is not its contribution to fit but its persistence." What makes the coefficient notable is not that it improves the fit but that it refuses to disappear.
No wage value is marked at the peak of the left-hand curve. The paper does not state one, and deriving it from the table gives very different answers depending on the model. The right-hand panel is the paper's conclusion: add availability and the gap at the bottom disappears while the gap at the top stays.
5.2Is −0.018 a large number
A regression coefficient means nothing without its units. This one is in raw AAI units, and the AAI runs from 0.041 to 0.192, a span of 0.151. So −0.018 is about 12% of the entire range. Hard to call small, hard to call enormous. The conditions matter too: it is relative to bachelor's-level occupations, and it is what remains after availability is controlled.
One tempting mistake is worth heading off. The bottom 20 in delegation include oral and maxillofacial surgeons, podiatrists, prosthodontists, dermatologists and dental hygienists. Occupations at the top of the education distribution sitting at the bottom of the index invites you to explain the master's coefficient with those cases. They belong to different levels of the argument. Those five are jobs whose substance is physical intervention, so their availability is low to begin with, whereas the −0.018 is what remains after comparing occupations of similar availability. Individual cases are not evidence for a regression result.
The wage curve also flattens substantially in model 3. The linear term falls from 0.447 to 0.201 and the quadratic from −0.019 to −0.009, roughly halving. Much of what wages appeared to do is absorbed by availability. It is less that high-wage occupations delegate more, and more that the tools had already reached the work high-wage occupations do.
The paper gives no value for where the inverted U peaks. Deriving it from the table yields about $71,000 under model 3 and about $128,000 under model 1. That those two diverge so widely is itself evidence of the absorption just described. It is our derivation, and usable only with the condition attached that it moves between $70,000 and $130,000 depending on the specification.
One thing to be clear about. The inverted U is not this paper's own discovery. The reinforcement learning team reports that their index is hump-shaped in both wages and experience, peaking at upper-middle wages and mid-career tenure. The same shape appears in a capability-layer measure. What is unique to this paper is not the shape of the curve but the finding that only the master's-level gap survives the availability control.
One more number for scale. In Bureau of Labor Statistics projections, occupations that require a master's degree or higher for entry account for about 5.0% of total employment (2.3% master's, 2.7% doctoral or professional). That is not exactly the same population as the paper's regression sample, so read it as an approximation, but it gives a sense that the unexplained hole covers something like one in twenty American workers.
Finally, two places where citation needs care. The body text gives the high-school-or-less coefficient as −0.010 where the table says −0.011, and it mentions an R² of 0.601 that appears nowhere in the table. Going by the table is the safer course. The authors also describe extended specifications in which R² reaches 0.605 with the reinforcement learning index included and 0.249 with the Claude usage measure, with the master's coefficient staying between −0.017 and −0.026 across every specification. The supplementary table behind those statements is not attached to the current arXiv version.
Work the Tools Reach but Nobody Hands Over
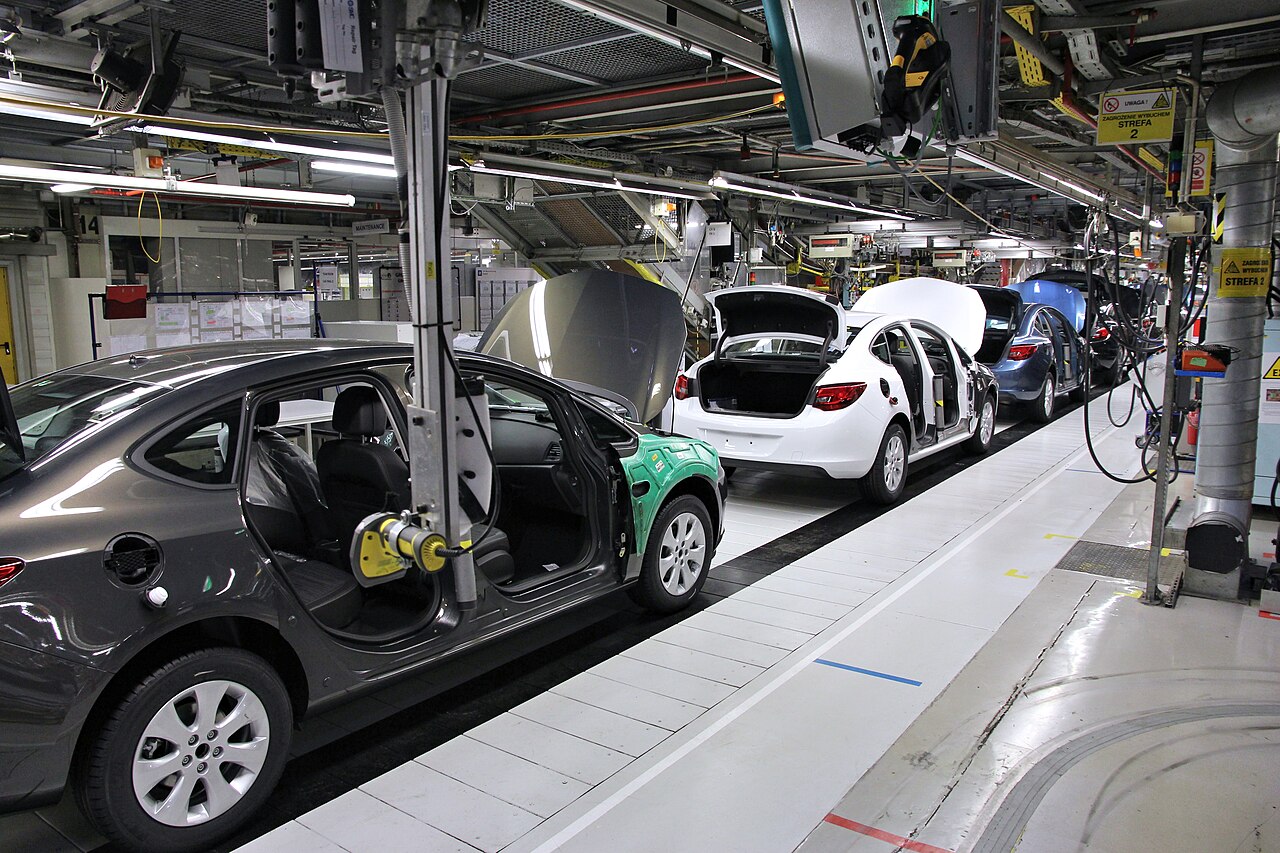
In 2015, explaining why automation was slower than expected, David Autor reached for a car windshield.
"Modern automobile plants, for example, employ industrial robots to install windshields on new vehicles as they move through the assembly line. But aftermarket windshield replacement companies employ technicians, not robots, to install replacement windshields."
David H. Autor, Why Are There Still So Many Jobs? (2015)
In the plant, a robot fits the glass. Replace a windshield after a crash and a person still does it, because the assembly line controls every condition and a repair bay controls none. Eleven years later, on a delegation map built from entirely different data, automotive glass installers and repairers sit near the bottom at an AAI of 0.047. The two measurements are independent and the alignment could be coincidence, so it should not be read causally. That they land in the same place is simply a fact.
Autor's name for that limit is Polanyi's paradox: people cannot put into words everything they know.
"there are many tasks that people understand tacitly and accomplish effortlessly but for which neither computer programmers nor anyone else can enunciate the explicit 'rules' or procedures. … 'We know more than we can tell'."
The paper never uses Polanyi's name. Citing Autor, it says only "tacit expertise, contextual judgment, and intensive interpersonal interaction, none of which is easily specified in advance". Tacit expertise, contextual judgment, intensive interpersonal interaction; none of them easy to specify ahead of time. Attaching the label is our addition.
6.1The authors back neither explanation
On why the top delegates less, the paper lays out two explanations. And it stops there.
"These occupations may be unable to specify their work in advance, or they may be able to and decline, since professionals have both the autonomy and the incentive to control the pace at which their work is codified (Abbott, 1988). … our data cannot distinguish constraint from choice."
The constraint branch follows Autor: this work cannot be written down in advance in the first place. The choice branch borrows Andrew Abbott's sociology of professions: professionals hold both the autonomy and the incentive to control how fast their work gets codified. The data cannot separate the two, as the authors themselves write. What they do offer is a way to tell later. If the shortfall at the top narrows as agents improve, constraint was the answer; if performance rises and the shortfall stays where it is, the case for choice gets stronger.
The Abbott citation needs a correction. That sentence is the authors' reading, not something Abbott wrote. His own mechanism is less about blocking codification than about asymmetry: the routinizable parts get pushed down to subordinate occupations while the inferential core is retained as the profession's own. So the accurate phrasing is not "according to Abbott, professionals slow codification" but "the authors invoke Abbott to say so."
That correction exposes a limitation the paper does not see. If professionals shed the routine parts, the work lawyers and physicians hand off piles up not in their occupation but in the support occupations next to them: paralegals, medical secretaries, bookkeeping clerks. The AAI is an occupation-level index and cannot observe that movement at all. There is circumstantial evidence pointing the same way. First-line supervisors of office and administrative support workers rank ninth in delegation, and general office clerks seventeenth.
6.2Using it and handing it over are different things
Surveys outside the paper point the same direction. Thomson Reuters' 2026 report on AI in professional services, covering more than 1,500 respondents across 27 countries, finds organizations reporting enterprise-wide AI adoption rising from 22% to 40% in a single year. Yet only 15% had already deployed agentic AI tools. A further 53% said they were planning or considering it. The share that actually tracks return on the investment was 18%, essentially flat year on year.
In the same survey, 40% of law firm respondents reported receiving demands from clients to use AI and demands not to use it at the same time. Individual usage rates vary wildly by survey. Some reports put the legal profession at 69%; narrow the definition to deliberate use of generative AI and it drops to around 30%. Depending on how the question is asked, the range runs from 26% to 92%. These figures come from secondary summaries; we were not able to read the underlying reports directly.
Which sums up as follows. Professionals use AI. They have not handed the work over. This does not contradict the paper; it is independent evidence pointing the same way, and the point where those two numbers diverge is exactly the boundary between the layers the paper describes. Flattening it into "professionals do not use AI" would be false.
The choice branch also has a concrete incentive behind it that people have pointed to for years. Under billable-hour pricing, a tool that finishes work faster cuts revenue. That is Abbott's abstract jurisdictional control landing in an accounting line. We reached this argument through secondary sources as well, so read it as a long-standing observation about incentives rather than a measured finding.
6.3But other surveys say the highly educated are more exposed
A frequent objection at this point: haven't we seen survey after survey showing that AI exposure is highest among the most educated? Indeed, Anthropic reports that workers in the top exposure quartile earn 47% more than those with zero coverage, and hold graduate degrees at 17.4% versus 4.5%, roughly four times the rate.
The two results do not conflict. They measure different units. Anthropic compares the educational attainment of individual workers between a high-exposure group and a zero-exposure group, which is in effect a contrast between knowledge work and manual work. This paper compares the typical entry-level education an occupation requires, bachelor's-level occupations against master's-level ones. That is a split inside knowledge work. The inverted U accounts for both at once: it climbs from the bottom, peaks at the bachelor's level, and comes back down above it.
6.4What this index still cannot say
The limitations are worth setting out as analysis rather than as a defensive footnote. In the list below, the first half are limits the authors state themselves; the second half are ones we added after checking the surrounding material.
| Limitation | Detail |
|---|---|
| Early adopter skew | Stated by the authors: read this as a measure of early adopter activity, not of adoption across the workforce |
| Not causal | It points to where early practitioners are attempting to automate their own work, not to where automation has already happened. No displacement or unemployment implication can be drawn from it |
| Blind to execution | The authors' second stated limit. It captures who attached an agent to which work, but not how that agent decomposes the work or in what order it proceeds. The method may differ substantially from how a person did it, and seeing that requires execution traces rather than descriptions |
| Blind to new work | Resting on a static O*NET task list, it captures only what automation displaces and structurally cannot capture what it creates. In Acemoglu and Restrepo's terms it sees the displacement effect but not the reinstatement effect, and the authors note that filling the gap requires sources that update themselves, such as job postings or agent operation logs |
| Missing supplementary material | The work-relevance classification prompt and the robustness checks are cited five times as living in supplementary material that the current public version does not include |
| Coding agent skew | The file format was born in coding agents and spread through developer tooling. Whether the concentration of IT and documentation occupations at the top is a property of the work or of the tool cannot be separated |
| A ten-month window | About ten months separate the public specification from the paper's submission. The authors' own line about the short shelf life of any point-in-time exposure measure applies first of all to their own index |
| The corpus is not curated | One security audit study examined 2,500 real skills and found that over 90% of the most popular ones failed its criteria. Pipelines that automatically convert open-source repositories into skill files already exist, so files no human wrote can be in the mix |
| Occupation-level blind spot | It cannot see professionals pushing routine work down into support occupations |
| US labor market only | The task list, the wages, the employment counts and the education requirements are all US data. They do not map cleanly onto other countries' occupational classifications, and no AAI has been computed on a non-US sample. Nothing in this paper transfers directly to another labor market |
| Preprint | An arXiv submission dated 19 August 2026, with no publication information |
One factual point to correct at the end. The paper describes its marketplace as "the one and only publicly accessible repository" of its kind, but at the time of submission several other indexes already existed, including one cataloguing more than 1.6 million public skill files. Bridge tools that port skills from one index into another format are circulating too, so the same skill is listed in several places. The paper's deduplication happened within a single index. Less that the authors were wrong, more that the ecosystem branched while they were writing.
Why This Matters to Pebblous
A disclosure first. Of the two branches in the previous section, the one Pebblous is drawn to is constraint, because whether work can be written down in advance is a data question. The paper holds the choice branch open just as widely and says the data cannot decide between them. What follows accepts that openness and asks only what is visible from the data side.
7.1Specifiability is another name for AI-Ready Data
The Pebblous thesis is simple. Before a model can use something, it has to become data. This paper writes the same sentence on the labor side. Before an agent can take work on, the work has to be written as a specification.
One agent configuration file is, in effect, a schema for a piece of work. It has a goal, a procedure, designated tools and inputs, and a statement of when it gets invoked. Being able to write one means the work already has structure. Not being able to write one is not a deficit of skill; it means the work has not yet taken a shape.
The first way around Polanyi's paradox, in Autor's account, is to make the environment regular.
"The first path circumvents Polanyi's paradox by regularizing the environment, so that comparatively inflexible machines can function semi-autonomously."
Writing a configuration file is exactly that, performed in software. You tidy the work into a regular form in advance so that an inflexible machine can run semi-autonomously. Factories built assembly lines to bring in robots; knowledge work writes specifications to bring in agents. Seen that way, the delegation map is not a map of jobs AI has eaten but a boundary between work that has already become data and work that has not.
7.2How an index is built decides what it can see
For a data practitioner, the part of this paper worth the longest look is not the result but the construction. The AAI averages the similarity between one task statement and all 53,515 items in the corpus. That single line of design fixes everything about the index. It compresses the range to between 0.04 and 0.19, buries the one perfectly matched agent in the mean, and means that as the corpus grows, individual task scores can actually be diluted.
This is not fault-finding. It is the observation that for any index, the aggregation rule is the point of view. Data quality does not live only in the source; it lives in the aggregation rule as well. We covered the same class of problem in a case where a single filter over a conversation corpus removed half of it.
7.3A procedure for separating specifiable work from the rest
The question an organization actually runs into when adopting agents is not whether AI can do this work. It is whether this work can be written down in advance. Those are different questions, and the hole at the top of this paper is what the difference looks like. Translated into practice, three things follow.
- You need a unit of description for the work. This measurement was possible because O*NET had already cut occupations into 18,000 task statements. Inside most organizations no such list exists.
- Specifiability is a matter of degree, not a binary. Within one task, some parts can be written in advance and some must remain judgment. Drawing that line should be the first step of an adoption plan, not an afterthought.
- Work you cannot specify is not a failure; it is the next thing to turn into data. Converting work that resists specification today into something observable is the same kind of problem Pebblous has worked on with robot demonstrations and industrial site data.
Engineering research has arrived at the same conclusion independently. A paper arguing that institutional knowledge in companies is trapped in human-readable formats puts it this way: "The bottleneck to effective agentic software development is not model capability but knowledge architecture." The bottleneck is not what the model can do but how the knowledge is arranged.
7.4Somebody has to maintain the data that observes automation
The authors did not choose this data because it was easy to get. The marketplace keeps growing, so running the same procedure again captures how what people choose to automate shifts over time. A measure anchored in expert ratings ages from the day it is built; this one updates. And a configuration file is not somebody's judgment about what could be done. It is an object someone actually built for their own work, which is why the authors describe it as close to revealed preference. If agent configurations accumulate before the change shows up in employment statistics, this stops being a record that confirms change after the fact and becomes one that runs ahead of it.
A problem sits quietly at the end of the paper. Conversational usage data is held by a handful of platform companies, and expert annotation is expensive and slow. Only publicly shared artifacts can be observed and refreshed without a platform's cooperation. The authors add immediately that there is no guarantee the norm of public sharing survives commercialization.
That worry was not abstract. The recent history of the company operating the marketplace this corpus came from runs as follows.
| Date | Event |
|---|---|
| 2022 | Founded in Beijing and Wuhan |
| Mid-2025 | Headquarters moved to Singapore after a Series B |
| 2025-12 | Meta agrees to acquire the company for more than $2 billion |
| 2026-04-27 | China's National Development and Reform Commission blocks the acquisition and demands the deal be withdrawn |
| 2026-06-15 | Meta formalizes the end of the relationship |
| 2026-08-11 | The company announces it will operate independently |
| 2026-08-19 | This paper is submitted to arXiv |
| 2026-08-25 | Some access blocked by data deletion for jurisdictional compliance |
Six days after the paper was submitted, the service's own notice said it was processing scheduled data deletion to meet regulatory requirements in certain jurisdictions so that it could resume operating as an independent company.
Only what is confirmed. That the marketplace index has disappeared is not a confirmed fact. What is confirmed is blocked access in some jurisdictions, scheduled data deletion, and a fight over ownership. That is enough. One of the public windows onto how far automation has come is standing on a public good nobody is responsible for maintaining.
Keeping data in an observable state, keeping lineage and revision history attached to it. The set of problems Pebblous has worked on with datasets lands squarely here. Drawing a map of automation turns out to need the same conditions, which is why this paper held our attention as long as it did.
Pebblous Data Communication Team
25 August 2026
References
Every figure in the body was checked against a primary source. For the paper itself that means the public arXiv version; for the three comparison measures, each original paper or published report; for wages and employment, the underlying Bureau of Labor Statistics tables. Where an item rests on a secondary summary, the body says so at that point. What follows groups the primary source, the comparison measures, the literature behind our interpretation, material on the skill ecosystem, and adjacent Pebblous pieces on the same problem.
Primary Source
- 1.Lee, H., Cheon, J., & Kim, L. (2026-08-19). Who Delegates to AI? Evidence from 53,000 Agent Configurations. arXiv:2608.20425v1 [cs.AI, cs.CY]. KAIST.
Comparison Measures
- 2.Tomei, P. M., & Klein Teeselink, B. (2026). What Jobs Can AI Learn? Measuring Exposure by Reinforcement Learning. arXiv:2605.02598v1 [econ.GN]. CC BY 4.0.
- 3.Eloundou, T., Manning, S., Mishkin, P., & Rock, D. (2024). GPTs are GPTs: Labor Market Impact Potential of LLMs. Science, 384(6702), 1306–1308.
- 4.Massenkoff, M., & McCrory, P. (2026-03-05). Labor Market Impacts of AI: A New Measure and Early Evidence. Anthropic Economic Research.
- 5.Frey, C. B., & Osborne, M. A. (2017). The Future of Employment: How Susceptible Are Jobs to Computerisation? Technological Forecasting and Social Change, 114, 254–280.
Basis for the Interpretation
- 6.Autor, D. H. (2015). Why Are There Still So Many Jobs? The History and Future of Workplace Automation. Journal of Economic Perspectives, 29(3), 3–30. Source of the windshield example and the environmental regularization quote.
- 7.Abbott, A. (1988). The System of Professions: An Essay on the Division of Expert Labor. University of Chicago Press. Jurisdictional control and the asymmetry of routinization.
- 8.Acemoglu, D., & Restrepo, P. (2019). Automation and New Tasks. Journal of Economic Perspectives, 33(2), 3–30.
- 9.Arntz, M., Gregory, T., & Zierahn, U. (2016). The Risk of Automation for Jobs in OECD Countries. OECD Social, Employment and Migration Working Papers No. 189. Cited secondhand.
- 10.Information Technology and Innovation Foundation (2022). Technology and the Future of Work: The Overlooked History of Job Displacement. The 2013 predictions checked against realized employment. A think tank report.
The Agent Skill Ecosystem
- 11.Anthropic (2025). Agent Skills open specification. Published 2025-12-18.
- 12.Chen et al. (2026-03-22). SkillProbe: Security Auditing for Emerging Agent Skill Marketplaces via Multi-Agent Collaboration. arXiv:2603.21019.
- 13.(2026-06-04). Knowledge Activation: AI Skills as the Institutional Knowledge Primitive for Agentic Software Development. arXiv:2603.14805v2.
- 14.(2026-03-17). Automating Skill Acquisition through Large-Scale Mining of Open-Source Agentic Repositories. arXiv:2603.11808v2.
Method and Data
- 15.Reimers, N., & Gurevych, I. (2019). Sentence-BERT: Sentence Embeddings using Siamese BERT-Networks. EMNLP-IJCNLP, 3982–3992.
- 16.National Center for O*NET Development (2025). O*NET 30.2 Database. U.S. Department of Labor/ETA.
- 17.Bureau of Labor Statistics (2025). Occupational Employment and Wage Statistics, May 2025. Primary source for the wage and employment figures in section 3.
- 18.Thomson Reuters Institute (2026). 2026 AI in Professional Services Report. Survey of more than 1,500 respondents across 27 countries.
Adjacent Pebblous Pieces
- 19.A Work Filter Cut Half the Conversations Out of AI Use Statistics — the same measurement problem on a different corpus.
- 20.Six in Ten Documents a Coding Agent Opened Were Written for the Agent — background on specification infrastructure and the skill ecosystem.
- 21.AI Agents Now Finish One in Six Real Freelance Jobs — another version of the observed-use layer.
- 22.When the Labels Vanished, What Was Left Was Choosing People — a discussion that connects to the hole at the top.
- 23.On Three of Seven Tasks, AI Guidance Made the Work Worse — the distinction underlying the composite measure's weighting scheme.