Executive Summary
This article reads OlmoEarth v1.3, released by the Allen Institute for AI (Ai2) on October 22, 2026. What the institute put out is not only a model. It summarized a full year of radar and multispectral satellite observation into 128 numbers for every 10-meter square, computed those summaries for the entire planet in advance, and made them downloadable. The work of fetching satellite imagery and running a model over it arrives already finished.
In 27 evaluations across six continents, first place went to the 128-dimension version 20 times and to the lighter 64-dimension version 18 times. The comparisons were against Google's AlphaEarth Foundations and Tessera v2. The years filled in for the whole planet, though, run from 2023 to 2025, and the stretch from 2017 to 2022 covers only some countries.
Sections 1 through 4 follow what the institute's announcement and outside coverage say. Section 5, which reads this release against the decision to prepare data ahead of time, is this article's own interpretation.
Key Numbers
The first two say what this release puts in your hands; the last two say what it cost to make and which parts are still empty.
Sources: Ai2 announcement · Unite.ai (October 22, 2026)
128
numbers per 10-meter square
A year of satellite observation shrinks to this much. The first 64 can be used on their own
20 / 27
evaluations where it placed first
Out of 27 evaluations on six continents, for the 128-dimension version. The 64-dimension version led on 18
53%
training time against the previous version
53% of v1.2 and 18% of the original v1. Rerunning the final training costs about $2,720 at H100 rental rates
2017–2022
the stretch that is not global
Only some countries are covered here. Worldwide coverage picks up at 2023 and runs to 2025
128 Numbers for a Single 10-Meter Square
Satellite imagery of Earth is already public in more volume than anyone can use. The European Space Agency's Sentinel satellites and America's Landsat satellites pass over the same ground every few days and have been stacking up records for decades, free for anyone to download. The difficulty starts after the download. Raw imagery for an area the size of one country runs to several terabytes, and finding anything in it means running a model that reads the whole stack. Only those with the storage and the GPUs got to ask questions.
What OlmoEarth v1.3 changes is that earlier step. The institute pushed a year of observation from Sentinel-1, which images with radar, and from Sentinel-2 and Landsat, which split light into many bands, through the model first, and pulled out a set of 128 numbers for each 10-meter square. A bundle of numbers like that is called an embedding. It is closer to a fingerprint the model has written down for that spot: color, texture and the way the place shifts with the seasons are all pressed in together. No person can read it, but for machines comparing one place against another it is far easier to handle than the original imagery.
The volume comes to roughly 150 terabytes per year. Only three years are covered worldwide: 2023, 2024 and 2025. Across the six years from 2017 to 2022, some countries have data and others do not. Which satellite imagery each value was computed from is written in provenance tables kept per 20-kilometer tile and per year. They list the Sentinel-1, Sentinel-2 and Landsat scenes the model read, with links to the public catalogs. Anyone who takes only the summarized numbers can still trace them back to the imagery underneath. The institute gave its reason for releasing all of it: foundation models and global embeddings are expensive to build, and it computed the planet on everyone's behalf so that the benefit would reach beyond the few who can afford the compute.
A Few Labels and You Have a Map
Once the precomputed numbers are in hand, the nature of the job changes. Building a crop map, classifying land cover, finding which stretch of ground has shifted: all of it becomes, in the institute's phrasing, a lightweight modeling problem. Instead of reading time series imagery with dozens of bands, you train one small classifier that takes 128 numbers as its input.
The OlmoEarth Embeddings Explorer, opened alongside the release, moves that process into the browser. No account, no installation. You can pan the map anywhere and flip between years to see how a piece of land has changed in between, and clicking one spot turns up other places that look like it. Drop a few labeled points and it trains a small classifier right there, then exports the result as a GeoTIFF file. The institute wrote that a handful of labels is enough to analyze an entire region, and that no GPU is required.
Computing the whole planet in advance is not free either. How did the institute drive that cost down? It separated the resolution it reads at from the resolution it writes out at. By the figures Unite.ai read off the model card, a setup that ingests imagery at 20 meters but emits results at 10 meters is 7.7 times cheaper than running the model end to end at 10 meters. The compute per window drops from 2,378 GMACs to 308. The model itself is a vision transformer with 128 million parameters, and the 768-dimension tokens it produces are squeezed down to 128 dimensions by a 14.3-million-parameter Perceiver and a 100,000-parameter linear layer.
What moved here is not performance but the threshold. The equipment needed to ask the same question came down from a data center to a single laptop. For anyone without a GPU budget, a provincial government officer or an analyst at an environmental group, the list of questions that satellite data can answer gets that much longer.
La Pampa, Peru: Gold Mines Spotted Without Being Taught
The case the institute showed in its announcement is La Pampa, in Peru's Madre de Dios region. Illegal gold mining there peaked in 2017 and 2018, stripping more than 1,200 hectares of forest from the buffer zone of the Tambopata National Reserve. In February 2019 the Peruvian government pushed most of it out with Operation Mercurio, and one question was left behind. Did it really stay pushed out?
In answering that, the institute trained no new model. It used no labels telling the model what a gold mine looks like. All it did was pull out the vectors already computed for each pixel for each year and compare them against each other. Where two years' bundles of numbers diverge sharply is where the ground changed sharply. The institute put it this way: compare each pixel's vector across years, no model training required.
The announcement sets out two pairs of years. Compare 2017 against 2020 and the places where the mining was spreading to the southeast light up. Shift the same comparison to 2020 against 2025 and the signal changes. The effect of the crackdown shows up directly in the embeddings, is how the institute describes it.
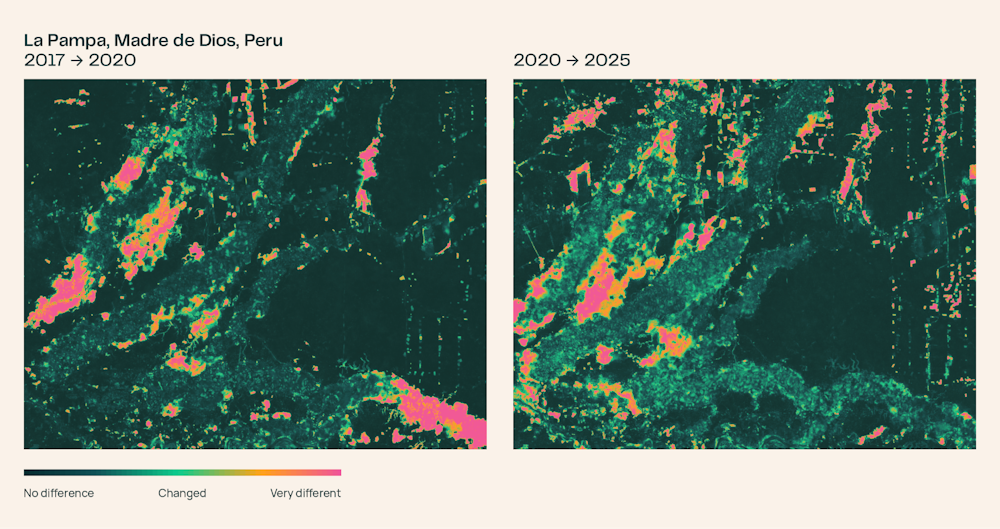
SiliconANGLE is the source that put an area figure on that change. It reported that between 2016 and 2020 the ground that changed significantly amounted to 34 square kilometers, pushing eastward within the southern mining belt, and that between 2020 and 2024 the same area fell to 9 square kilometers. The year labels on the two records, though, sit one year apart at each end. The 34 and the 9 are safer to read as the difference in scale before and after the crackdown than as exact measurements.
A smaller number does not mean the situation is over. The institute wrote the sequel into the announcement as well. According to an August 2026 Associated Press report, Peru sent naval patrols back in after prosecutors confirmed that mining had crossed the reserve boundary into Tambopata. What the embeddings show is which ground has changed. What that change is, and where it stands now, is still told by people on the ground and by records of other kinds.
Best on 20 of 27 Benchmarks, at Half the Previous Training Cost
Ai2 is not the first to put out global embeddings. Google's AlphaEarth Foundations occupies the same ground, and Tessera v2 came out of academia. The institute set both up as comparisons and ran 27 evaluations spanning six continents. The 128-dimension version scored highest on 20 of them, and the half-size 64-dimension version led on 18. What does halving the storage cost you? Two places in the ranking. Anyone short on disk space can take the lighter one.
One of the evaluations is new, built by the institute for this release. It is PLANTEUR, which tells apart the crop types grown in tropical agriculture. Staged on the islands of Overseas France, it is measured leave-one-island-out: a classifier is trained on the rest with one island held out entirely, then tested on the island that was withheld. Measured that way, you see how well the model holds up on ground it has never seen. The 128-dimension embeddings scored 24.9 mIoU. Under the same conditions Tessera v2 scored 19.1 and AlphaEarth Foundations 15.8. Tropical farmland is among the harder subjects for satellite data, since the plots are small and clouds sit over them often.
| Model | PLANTEUR (mIoU) | First place in 27 evaluations |
|---|---|---|
| OlmoEarth v1.3 (128-dim) | 24.9 | 20 |
| OlmoEarth v1.3 (64-dim) | — | 18 |
| Tessera v2 | 19.1 | — |
| AlphaEarth Foundations | 15.8 | — |
The tally of first places across 27 evaluations is in the Ai2 announcement. The three PLANTEUR scores are not in the body of that announcement; they are figures Unite.ai pulled from the model card. A blank cell means that source does not report the value.
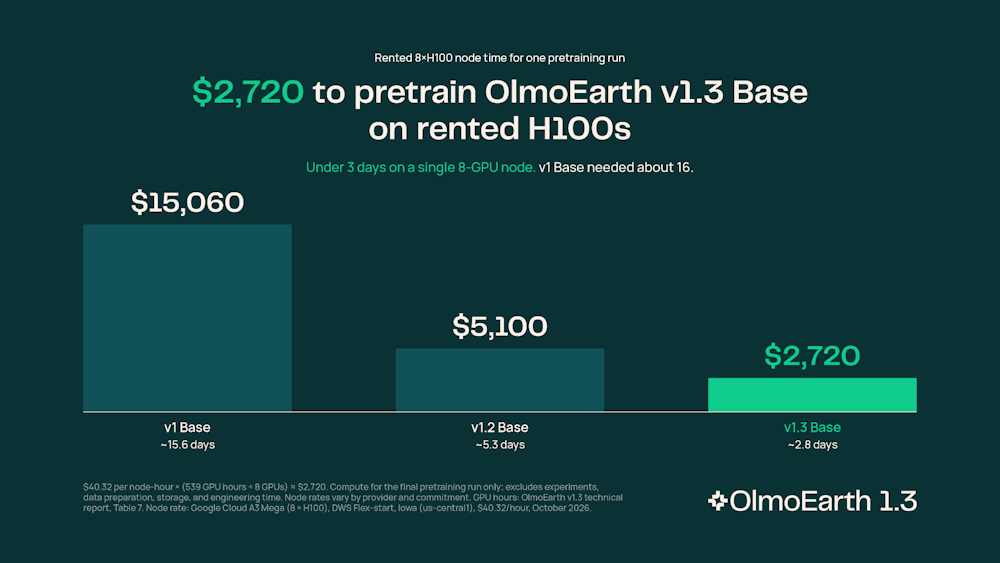
The cost of training was published too. Version 1.3 is the cheapest of the line to train. It used 53% of the compute time that the preceding v1.2 used and 18% of what the first v1 used, with carbon emissions at 50% and 22% respectively. Rerunning the final training run from scratch costs about $2,720 at H100 rental rates, the announcement says. That is a small sum for a model covering the planet, though the cost of actually computing and storing the global embeddings sits on top of it. That is the part the institute paid for out of its own pocket.
What you are allowed to do with it comes with conditions. The released artifacts fall under the OlmoEarth Artifact License, which the announcement describes as the same license that applied to v1 and v1.2. Which uses are blocked? The announcement does not spell that out; by Unite.ai's summary, military and defense purposes and extractive industry uses are restricted. It is worth checking whether your intended use runs into that before you download anything.
Why Pebblous Is Watching This Release
AI-Ready Data usually points at data that has been cleaned and tidied. This release pushes the phrase one step further. If you do not stop at tidying but also build the result of one pass through a model in advance, the next person does not start where the model run starts. The Peru case shows it. The answer did not come from beginning to train once a question arrived; it came from pulling out summaries that had already been computed and holding them against each other.
So which of the data we hold is worth computing in advance? Not everything can be treated that way, so some test is needed. Take apart why satellite embeddings earn their keep and three conditions overlap.
- Different questions keep arriving against the same data. The person asking about crop maps and the person asking about deforestation use the same imagery, which means there is a shared stretch of work that does not have to be redone for each question
- The summary outlives the question. Numbers written down for the state of the land in 2023 serve a question that arrives next year just as well. Where the summary has to be rebuilt every time the question changes, the reason to compute it in advance shrinks
- Some of the questions are answered by comparing summaries alone. Change detection is one. If every question requires training a classifier before an answer appears, the gain from the precomputed values is that much smaller
The empty years are the other side of the same story. What you can download for free runs to three years only, and for the six years before that it varies country by country. The Peru case could reach back to 2017 because that country sits on the filled-in side of the earlier stretch. That the floor of the published data is 2017 also bears on the mismatch in year labels seen in Section 3: the 2016 that SiliconANGLE cites sits one year below that floor, and the year the announcement cites is 2017. Ask the same question somewhere else and there may be no answer. Whoever uses precomputed data has to check first how far it reaches, and whoever builds it has to write the uncovered stretches down in the same place as the data. When the gaps are not written down, the person using the data reads them not as missing but as unchanged.
Editor's Note
The number that lasts longest out of this release may not be the score across 27 evaluations. Benchmark rankings turn over with the next version. The structure does not. Lay precomputed summaries down as a shared asset and the cost of asking anything on top of them falls across the board. The next question for an organization holding data is not whether to publish it, but how far along to compute it before handing it over.
Thank you for reading this far. The figures in this article were checked directly against the Ai2 announcement and the SiliconANGLE and Unite.ai reports. If there is a stretch of your own data that would pay for itself many times over by being computed in advance, and something is standing in the way of that, we would be glad to hear about it.
Pebblous Data Communication Team
October 23, 2026
References
- 1.Ai2 (The Allen Institute for Artificial Intelligence). (2026). "OlmoEarth v1.3: State-of-the-art embeddings for the whole planet." Ai2 Blog.
- 2.Dotson, K. (2026). "Ai2 releases OlmoEarth v1.3 state-of-the-art AI-ready satellite embeddings for the whole planet." SiliconANGLE.
- 3.Reeve, J. (2026). "Ai2 Releases OlmoEarth V1.3 With Global 10M Satellite Embeddings." Unite.ai.