Executive Summary
This article looks at a case where records that piled up on their own while daycare centers served lunch ended up as the analysis data of an academic paper. The study is joint work by the team of Professor Ham Sunny of the Department of Food and Nutrition at Yonsei University and the foodtech company Nuvilab, announced on September 15. Using 136,517 food records from 170 children at 12 daycare centers in Changwon, South Gyeongsang Province, the researchers compared each child's first weeks in the service with the same child about a year later, and the results appeared in Culinary Science & Hospitality Research, volume 32, issue 8, a journal indexed by the National Research Foundation of Korea. The paper had been out since August 31, two weeks ahead of the announcement.
The most widely quoted figure is 8.8 percentage points. Among the children who had eaten less than half of what they were first served, the average intake rate rose by that much over the year. The abstract leads with a different number. Across all the children, the average intake rate went from 63.9% to 68.5%. The research team stated that this is an observational study with no control group, and the AI Times report on the announcement also wrote that establishing causation was not the focus of the study. The new thing here is not evidence of an effect. It is a body of data that measured the same children against the same yardstick for a year.
Sections 1 through 3 follow only what the reporting on the announcement, the earlier Nuvilab press releases, and the paper's abstract establish. The turn toward data quality in sections 4 and 5 is this article's reading and is not in those documents. Every quotation below is our translation from the Korean original.
Key Figures
Sources: Money Today and AI Times, September 15, 2026. The overall average intake rate comes from the paper's abstract.
136,517
Food records analyzed
Records from 170 children at 12 daycare centers in Changwon, stitched together per child
8.8 points
Gain in the low-intake group
The one-year average for children who had eaten less than half of what they were first served
68.5%
Average intake rate a year on
Up from 63.9% early in the service. The abstract leads with this value, and the 8.8 points belong to the low-intake group inside it
0
Control groups
A limit the research team disclosed. Before and after, with no group to compare against over the same period
What the Announcement Said
YumYumKids, Nuvilab's AI food scanner for children, analyzes images of the tray before and after a meal, estimates how much of each food was served and how much was left, and computes an intake rate from the two. The records accumulate while the center sets out lunch and clears it away. The research team did not collect them anew. They pulled out what had already piled up and paired each child's first weeks in the service with the same child about a year later. By the company's own count, Nuvilab holds more than 100 million food records gathered for model development, and roughly 136,000 of them went into this paper.
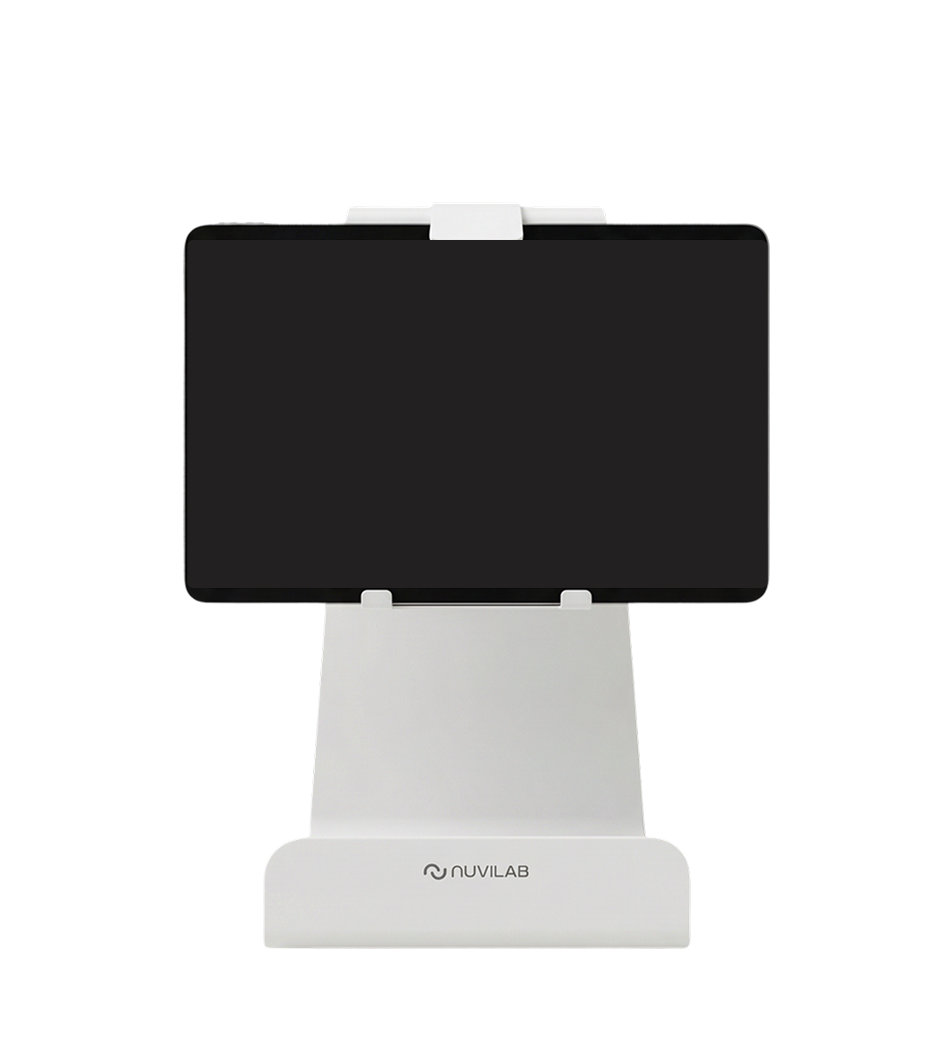
The change showed up most clearly among the children who had not eaten much to begin with. Intake rose more visibly in the groups whose initial intake was low or middling, and children who had eaten less than half of what they were first served averaged 8.8 percentage points higher a year later. The share of records showing almost no vegetables eaten also fell. The researchers put their emphasis somewhere else.
“Direct observation, actual measurement, dietary recall and other methods have been used to track over long periods how much young children really eat, but increasing the sample and the observation period at the same time has been difficult in practice.” Ham Sunny, professor of food and nutrition at Yonsei University, quoted by Money Today on September 15, 2026
Ham described the study as “a methodological step forward in research on the diets of young children,” on the grounds that it “secured more than 130,000 actual foodservice records under a single standard through the AI food scanner and observed a year of change in the same children.” Ru Jeyyoon, a director at Nuvilab, said it had been “hard to confirm, over long periods and at scale, what a single child in daycare foodservice actually eats and how much.” Both named one achievement. A year of records, all of it kept to one standard, is now on hand to weigh this change against.
Two uses were put forward. Daycare centers and other foodservice institutions can identify the food groups and menu items whose intake rates stay low, then take that into menu planning and conversations with parents. Local governments can add actual eating patterns to participation counts and satisfaction surveys when they review childcare and foodservice programs. The team announced its next steps as a study with a control group, field validation using weighing, and expansion across regions and institutions.
The abstract says more
The announcement and the reports that carried it named only the journal and the issue. No paper title, no author list. Following that issue through to the bibliographic record and the abstract turns up the rest. The paper is titled “Changes in Meal Intake Rates and Picky-Eating-Like Record Rates among Preschool Children in Childcare Centers: A Retrospective Observational Analysis using AI Food-Scanner Data.” Five authors are listed: Ham Sunny and Baek Seonyeong of Yonsei University, and Ru Jeyyoon, Noh Jinyeong and Shin Heetae of Nuvilab, matching the joint research the announcement described. It runs in English on pages 121 to 133 of volume 32, issue 8, published on August 31.
Several things in the abstract never reached the reporting. The comparison windows are given in days, the average across all the children is there, and the indicator called a picky-eating-like record is defined. The caveat the authors attached sits in the abstract as well.
| Item | What the abstract records |
|---|---|
| Comparison windows | An introduction period of 0 to 60 days and a follow-up period of 300 to 360 days, about 12 months apart |
| Overall average intake rate | Up from 63.9% to 68.5% (Wilcoxon signed-rank test, p = .002, dz = 0.31) |
| Definition of a picky-eating-like record | A food record whose intake rate falls below 10%. The abstract calls this an operational rather than a clinical indicator |
| Picky-eating-like record rate | Down from 22.9% to 19.2% (p < .001, dz = −0.32) |
| By food group | The rate fell for vegetables, legumes, meat and grains. For fish it did not fall |
| Trend over time | With each additional month, the odds of a picky-eating-like record went down (adjusted odds ratio 0.970, 95% CI 0.957 to 0.984) |
| The caveat the authors attached | A single-group observational analysis without a control group cannot speak to causation, and the larger change in the low- and middle-intake groups has to be read alongside the possibility of regression to the mean |
Every value in this table comes from the paper's abstract. p indicates how unlikely the difference between the two windows would be by chance, and dz indicates the size of that difference. The odds ratio of 0.970 is a ratio of odds rather than of rates, so reading it as “3% less every month” changes its meaning.
The 8.8 percentage points that led the coverage are absent from the abstract. The abstract records only that the change was clearer in the groups whose initial intake was low or middling, and puts no number on that group. The 8.8 percentage points come from the September 15 announcement. The reverse holds too: the rise from 63.9% to 68.5% is the first result the abstract states, and we did not find it in the Korean coverage of the announcement.
The bibliographic record and the abstract were checked against the DBpia entry for the paper (DOI 10.20878/cshr.2026.32.8.011). At the time of writing, the issue has not yet appeared in the KCI index, and the journal's own publication notices stop at the May issue. We have not read the 13 pages of the paper itself, so every figure outside the abstract comes from the September 15 announcement and the reporting on it.
What Surveys Built on Memory Could Not Do
One long-standing method for surveying dietary intake in nutrition research is the 24-hour dietary recall. A surveyor asks the person, or a caregiver, what and how much was eaten over the past day. The method works on adults. Young children cannot report their own intake accurately, so the source of the record shifts from the child to an adult. A teacher's memory of lunch and a parent's memory of dinner get added together into one child's day.
Repetition is the bigger obstacle. Asking once and asking the same child for a year are different undertakings. The AI Times report noted that recording each food a single child eats, repeatedly over several months to a year, drives up staffing and time. This is also why Ham said that raising the sample size and the length of observation together has been hard. Longitudinal data stays scarce in research on the diets of young children for that reason.
The abstract's own summary of earlier work lands in the same spot. Prior studies relied largely on questionnaires and measured at a single point in time. Dependence on memory and measurement at one point are separate problems. However accurate a single measurement is, it says nothing about how that child changed over the past year.
| Method | Who leaves the record | Obstacle to repeating it for a year |
|---|---|---|
| 24-hour dietary recall | A caregiver or surveyor recalls the previous day and answers | Young children cannot report accurately on their own, so the record rests on someone else's memory |
| Food records and weighing | A surveyor or caregiver writes down or weighs each meal as it happens | Repeating this per food for the same child over months to a year drives up staffing and time |
| Direct observation | A surveyor watches and measures on site | Raising the sample size and the observation period together is hard |
| AI food scanner | The device leaves images of the tray before and after the meal during ordinary service | The record is a byproduct of the work, so repeating it adds no further human labor |
The first three rows follow the AI Times report and the quotations from Professor Ham. The last cell of the fourth row is this article's one-sentence summary of the contrast.
This study built no new measuring instrument. The measuring was already running inside a product. This announcement reports one event: a number that used to appear on a foodservice screen took a seat as an observation in a longitudinal analysis.
Why the Numbers in the Press Release and in the Paper Differ
Intake figures from this same device have gone public before. On December 16, 2024, Nuvilab announced that YumYumKids had reached 400 daycare centers and kindergartens nationwide, and released alongside it the results of a smart social service pilot run with the Ministry of Health and Welfare at 12 daycare centers in Andong, North Gyeongsang Province: overall intake up 5.6%, kimchi up 9.2%, vegetables up 11.9%. Kim Dae-hoon, Nuvilab's chief executive, said at the time that YumYumKids had “proven changes in children's eating habits with data for the first time.” A year later, in December 2025, the company reported passing 1,100 cumulative installations.
The Andong pilot and this Changwon study differ in region and in program, and stringing the two figures together gets the facts wrong. The two are still worth placing side by side. That view brings out what stands written next to each number.
| Item | December 2024 press release | September 2026 paper announcement |
|---|---|---|
| Subjects | 12 daycare centers in Andong, North Gyeongsang, in a Ministry of Health and Welfare smart social service pilot | 12 daycare centers in Changwon, South Gyeongsang, 170 children |
| Records | Not stated | 136,517 |
| Period | Not stated | Each child's first weeks in the service and about a year later |
| Figures | Overall intake up 5.6%, kimchi up 9.2%, vegetables up 11.9% | Average intake in the group that ate less than half rose 8.8 percentage points |
| Unit | Percent increase | Percentage points |
| Where it appeared | A company press release | Volume 32, issue 8 of a journal indexed by the National Research Foundation of Korea |
| Statement of limits | None | Disclosed as an observational study without a control group |
The left column comes from the Nuvilab press release of December 16, 2024, the right from the three outlets that covered the September 15, 2026 announcement. “Not stated” means the item does not appear in that press release.
The split starts with the units. 5.6% is a rate of increase, and 8.8 percentage points is a difference. A figure given only as a rate of increase leaves out what it rose from. The same 5.6% points at an entirely different change depending on whether the baseline was 30% or 70%. A figure given in percentage points carries with it the group and the value it was measured against. In this announcement that group is named: children who had eaten less than half of what they were first served.
The name of the indicator this paper uses comes with its counting rule attached. The abstract uses the phrase picky-eating-like record, defines it as a food record with an intake rate below 10%, and pins it down as an operational rather than a clinical indicator. The words picky eating stay in the name, and no child has been judged a picky eater. Those two lines together let the next person count the same way. The phrase the reporting carried, “the share of records showing almost no vegetables eaten,” is that indicator in plain words.
The data did not change. The same device measured the same way. The values now travel with their subjects, their span, their group breakdown and their limits, and that is the line between a press release and a paper in a journal.
Three Thresholds Cleared, Two Not
From here the article leaves the announcement behind and holds this case up against what it takes to turn records accumulated during operations into material for research or training. The framing as thresholds belongs to this article, not to the announcement.
Start with the side this case cleared. First, the measuring used one yardstick. If the records had been written by different people in different ways at each institution, the before and the after could not be set against each other. Here one device produced the values under one set of rules. Ham named this part in the phrase about securing records under a single standard. Second, the same child could be found again. A longitudinal analysis does not follow from a large pile of records. It requires that one child at the start and that same child a year later be linked as one person. Third, the scale and the span fit the question. The 136,000-odd records make an impression, but the structure that let the question be answered is that they accumulated for 170 children across a year.
Two thresholds remain, and the research team named both first. One is the absence of anything to compare against. With no control group, ordinary growth over the same period or an improvement in the center's menus could raise intake on its own. The other is whether the measured value is the actual value. Intake is estimated from tray images, so validation against direct weighing is still outstanding.
The absence of anything to compare against has one more branch, and the authors wrote it into the abstract themselves. A value that comes out unusually low the first time tends to move back toward the average on a second measurement even when the child has not changed. So the clearer change in the low- and middle-intake groups has to be read alongside that possibility, the authors wrote. The 8.8 percentage points that led the coverage is the value for exactly that group.
The control-group problem carries a complication particular to this case. The instrument doing the measuring is at the same time a product that talks to the child. YumYumKids is not a camera that only photographs a tray. Among the features the company introduced in its December 2025 press release are English-learning and puzzle content the child can play with while interacting with the scanner, and a report on the child's eating habits that goes to the parent. An observation device that watches quietly and a coaching tool that intervenes in behavior sit in one body.
Interpretation. Beyond the regression to the mean the authors noted, at least three more things are mixed into that year's 8.8 percentage points: the change that comes with a child growing up, the effect of foodservice staff revising menus after seeing the data, and the share contributed by the scanning and the reports altering how children and adults behave. This design cannot separate their portions. Gathering more data will not separate them either, because a control group comes from the design rather than from the volume of records. The refusal to claim causation reads less like modesty than like the only statement this structure allows. And whether a measuring instrument observes or intervenes is a question its makers find hard to answer about themselves. Three of the five authors work for that company.
Why Pebblous Is Watching This Study
Pebblous works on getting data that has already accumulated into a state where AI can use it, and material of this kind comes up most often in that work. Nobody designed it for research or training. It fell out of the business while the business ran. Logs, inspection records, support histories, approval trails all sit in that same place. The volume is there, and then the question of what can actually be asked of it turns vague.
The five thresholds in section 4 differ in kind. The first three depend on how records accumulate, so acting now can clear them later. The last two do not work that way. A control group is already settled by when a feature was switched on and for whom, and a gap between an estimate and a real measurement cannot be recovered after the fact if nobody ever measured. The question to put to reused data is therefore closer to “what is hardening right now into something we will not be able to ask?” than to “how much has piled up?”
Six checks to run first when you look at your organization's logs through the same lens.
- Did the measuring rule hold steady across the whole period? If the device or the model version changed midway, the values on either side were not measured by the same yardstick.
- Is the counting rule written next to the number? Without the definition alongside it, an indicator keeps its name while what it counts drifts from one quarter to the next.
- Can the same subject be linked across time? If the identifier breaks midway, the result is a run of daily snapshots rather than longitudinal data.
- Is the record an observation or an intervention? Logs from a system that returns feedback to its users already have the effect of that feedback mixed in.
- Has any group been left aside for comparison? Switch a feature on for everyone at once and the chance to build a control group disappears at that moment.
- Has the estimate ever been checked against a real measurement? Using a model's output as an observation calls for measuring the size of the gap on its own.
Thank you for reading this far. The announcement quoted in this article can be read at the source in the AI Times and Money Today reports, both in Korean. If some of the records your organization has accumulated as a byproduct of its work look usable for research or training, and if one of the six checks above is where they stop, we would like to hear about it.
References
Academic Paper
- 1.Ham, S., Ru, J., Noh, J., Shin, H., Baek, S. (2026). "Changes in Meal Intake Rates and Picky-Eating-Like Record Rates among Preschool Children in Childcare Centers: A Retrospective Observational Analysis using AI Food-Scanner Data." Culinary Science & Hospitality Research, 32(8), 121–133.
Announcement Coverage (September 15, 2026)
- 2.AI Times. (2026). "AI Tackles a Long-Standing Measurement Problem in Nutrition — A Year of Children's Meals Becomes Research Data." (Korean.)
- 3.Money Today. (2026). ""Mom, I Want More Rice" — The Surprising Change After a Year of Daycare Meals." (Korean.)
- 4.Siminilbo. (2026). "Nuvilab and Yonsei University Announce Results from an Analysis of 136,517 Child Meal Records." (Korean.)
- 5.Food Today. (2026). "Yonsei University and Nuvilab Analyze 136,000 Daycare Meal Records with AI." (Korean.)
Earlier Press Releases
- 6.AI Times. (2024). "Nuvilab's AI Food Scanner for Children Reaches 400 Sites — "Kimchi and Vegetable Intake Up 10%"." (Korean.)
- 7.AI Times. (2025). "Nuvilab's AI Food Scanner "YumYumKids" Passes 1,100 Cumulative Installations." (Korean.)