Executive Summary
When people use LLMs to pull numbers out of papers and turn them into a dataset, the question asked so far has been how accurate a single pass is. A paper posted to arXiv on 19 August by researchers at Imperial College London, the University of Cambridge and Stanford asks the next one. Give the same model the same paper again, and does the same value come back?
Seven frontier models each read eighteen papers five times. Items that were correct in all five runs came to roughly three in four. Another 19.2% flipped between right and wrong across the five, and one model that hit 95.2% in a single run stayed below 80% in the other four. The fix the authors landed on was not picking a stronger model. It was spending the runs on different models instead of on more repeats of one.
The team ran four experiments in order, stripping away one layer of human involvement at each step. Where the handover was safe and where it collapsed shows up in that sequence. The boundary it draws lines up with how a data curation team divides its own work.
Key Numbers
The first two numbers are the wobble that showed up when the same model was run five times. The last two show where the researchers hit a limit as they raised autonomy, and what worked against it.
Source: arXiv 2608.19025 (2026-08-19) · 7 frontier models, 18 papers, 5 repeats per extraction
76.4%
Items correct in all five runs
19.2% flipped between correct and incorrect across the five runs, and 4.4% were wrong every time
95.2 vs 78.4
One model's best and worst run
Kimi K2.6 scored 95.2% once and 78.4–80.2% in the remaining four runs
53.7%
Primary sources autonomous search recovered
Even the best agent found only about half of the 19 references an expert had curated
89.2 → 93.3
Repeating one model vs crossing several
Agreement with the human reviewer consensus; repeating a single model stalled at 89.2%
The Numbers Were Right, the Context Was Not
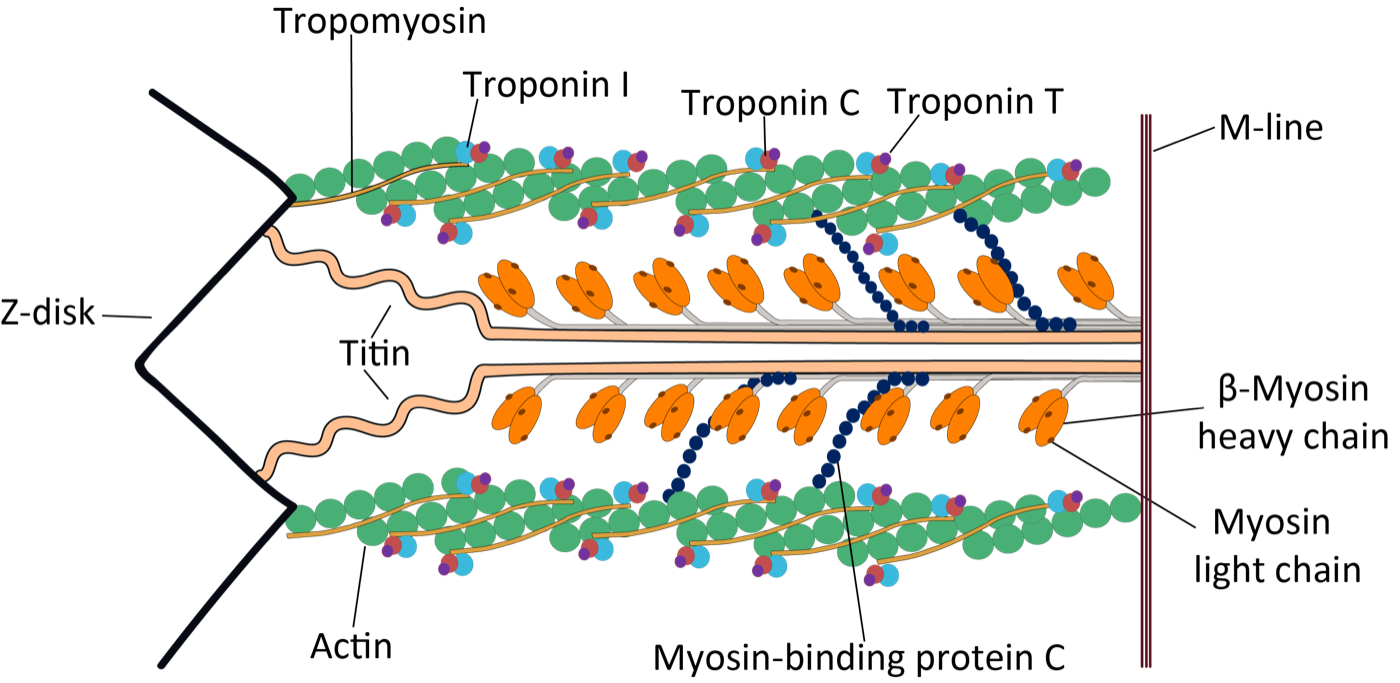
The study needed an answer key. The researchers chose a 2006 review that collated, from many experimental papers, how tightly calcium ions bind to cardiac troponin C. One of the authors of that review is Steven Niederer, the corresponding author of this new paper, so the test could be designed by people who already knew the quirks of both the primary sources and the answer key. The review's table held nineteen papers and forty experimental conditions. Eighteen of those papers and thirty-nine conditions were accessible and became the final corpus.
The first experiment is the one with the most human involvement. An expert-written prompt was pasted into the browser window of each of the seven models along with one paper at a time, and every extraction was repeated five times. Seven fields were scored: species, temperature, troponin preparation, the calcium measurement method, magnesium concentration and the two affinity values.
| Model | Accuracy across all seven fields |
|---|---|
| GPT-5.5 | 95.7% |
| Gemini 3.1 Pro | 91.4% |
| Claude Opus 4.7 | 90.6% |
| Top three, average | 92.6 ± 2.7% |
| Remaining four, average | 86.4 ± 3.1% |
The other four models were Qwen3.7-Plus, Kimi K2.6, GLM-5.1 and DeepSeek V4. GLM-5.1 was the strongest open-source model of the group, and DeepSeek V4 came in 17.6 percentage points above its predecessor V3.2.
On the averages this reads as a successful experiment. The split shows up field by field. The two affinity values were recovered at 99.0% and 99.8%, essentially every time, while identifying which troponin preparation a value had been measured in came to only 80.7%. Locating a number and deciding which experimental condition that number belongs to were two very different problems for these models.
The averages hide something else. The spread across the eighteen papers is wide. The three hardest were Hofmann and Fuchs (1987) at 62.4 ± 30.1%, Pan and Solaro (1987) at 66.1 ± 29.8% and Parsons et al. (1997) at 75.5 ± 8.0%. The first two carry standard deviations close to 30 percentage points: on Hofmann and Fuchs, Opus 4.7 scored 0% while Kimi K2.6 scored 94.3%, and on Pan and Solaro, Gemini 3.1 Pro scored 17.1% while GPT-5.5 scored 100%. Which paper a model was handed shaped the score more than which model was doing the reading.
The difficulty lived in the documents. These papers report measurements made in skinned fibres or native myofilaments, put conditions with different magnesium concentrations side by side, and leave some values to be worked out from the methods section because no table lists them. Some report the same affinity by two different methods. In others the reference value sits in the body text while the tables list different, sometimes contradictory constants. Two of the downloaded papers existed only as images, and optical character recognition corrupted the exponents. Parsons et al. was evenly hard rather than erratic, with every model landing between 60.0% and 82.9%.
More output was not better output. Kimi K2.6 returned an average of 3.6 additional entries for every expected result yet recovered only 89.2% of them. Opus 4.7 produced the fewest extras at 1.9 and recovered 95.4%, and GPT-5.5 recovered almost everything at 99.5% while still adding 2.7. In practice the extra material mostly meant more rows for a human to check by hand.
While extracting, the models also turned up several errors in the answer key itself: a wrong conversion factor between the two affinity values, a 25°C measurement recorded as room temperature, and magnesium values attached to the wrong conditions. The authors note that these were easy to spot precisely because nearly every model deviated from the ground truth at the same places. Cross-checking, it turns out, was not only auditing the models.
1.1One Run in Five Changed Its Answer
Across all seven models, items that came out correct in all five runs of the same prompt on the same paper accounted for 76.4%. Items wrong in all five were a small 4.4%. The problem sits in the 19.2% in between. Those items flipped between correct and incorrect, which means a single run can make them look either way.
▲ Pebblous original diagram. The 19.2% that flipped is the band a single run cannot show you.
Split by model, the gap widens. The top three models were correct in all five runs on 87.7% of items, the other four on 67.9%. Kimi K2.6 recorded 95.2% in one run and 78.4–80.2% in the other four. Anyone who had seen only that one run would have concluded they were looking at a top-tier model. This is why the authors recommend running each prompt at least five times and reporting the majority answer across those runs.
The Models' Own Prompts Got Them to the Starting Line
The second experiment removes one layer of human work. Each model was told only what to look for, asked to first search for prompt-writing techniques and domain terminology, and then to write three candidate prompts of its own. Those three were merged into a single master prompt. How closely each master prompt resembled the expert version was scored against a 38-component rubric covering task definition, source prioritization, required columns and quotations, calculations, special cases, worked examples and conflict resolution instructions.
Merging the three candidates raised the score for every model. GPT-5.5 went from an average of 82.9% across its individual prompts to 88.2% for its master prompt, the highest of the group, while Gemini 3.1 Pro and Kimi K2.6 gained the most from merging at 11.4 and 10.5 percentage points. Applied to eight papers, that master prompt gave GPT-5.5 90.3% and Opus 4.8 85.5%, with the remaining five models scattered between 57.8% and 74.5%. GPT-5.5's five runs clustered between 90.1% and 90.7%, a standard deviation of 0.3 percentage points, which stands in contrast to the model in the previous experiment that hit 95.2% once and stayed under 80% otherwise.
Compared with the expert prompt, accuracy fell for every model. GPT-5.5 dropped 5.3 points from 95.6% to 90.3%, and Opus 4.8 dropped 4.8 points. For a starting point built without a human, that is not a bad loss. Gemini 3.1 Pro, on the other hand, lost 32.5 points, and the cause was not the quality of its prompt: despite repeated instructions it never actually performed the web search.
It is also possible to see where the loss occurred. Broken out by field, the measurement method field fell the furthest, by 27.5 points on average. Magnesium concentration, species, temperature and the two affinity values fell between 13.8 and 16.4 points, while classifying the troponin complex barely moved at 2.1 points. Looking at the affinity values alone, GPT-5.5 went from 99.2% under the expert prompt to 98.1% under the master prompt, a loss of just 1.1 points. What the expert prompt had really been doing was not telling the model what to extract, but telling it how to read the experimental methods.
One observation here lands directly on practice. The ranking by rubric score and the ranking by actual extraction accuracy did not move together. The correlation between them was weak and not statistically significant (Spearman r=0.36, P=0.43). DeepSeek V4 had the second-highest master prompt score but ranked fifth on extraction accuracy, and Opus 4.8 ranked fourth on the prompt and second on accuracy.
Judging how closely a prompt resembles an expert's did not tell you how accurate the results from that prompt would be. However carefully you build a review process for prompts, it does not substitute for scoring the output against an answer key.
Finding the Literature Was Where It Broke
The third experiment hands over no papers at all. Seven Deep Research agents were told to find up to twenty pieces of primary literature published before 2005 on their own and extract the data from them, and the whole task was repeated five times. The target was to reassemble the answer key, the nineteen references cited in that 2006 review.
The citation counts diverged first. Opus 4.8 brought back the most at an average of 20.6 ± 1.4 per run, while Mistral 3.5, the only European model in the group, brought back the fewest at 4.4 ± 1.6. The count was not the issue. How many of the original sources were among them was.
| Agent | Recall of the 19 primary references |
|---|---|
| Claude Opus 4.8 | 53.7 ± 14.7pp |
| GPT-5.5 | 38.9 ± 2.6pp |
| Edison QA3 (dedicated literature search) | 29.5 ± 2.6pp |
Of the real papers actually cited, 63% were publicly accessible while 37% were closed or paywalled. Opus 4.8 had the highest recall but also the widest spread, recovering 37–74% depending on the run.
Even the best agent missed roughly half of the references an expert had curated. Edison QA3, built specifically for literature search, was no exception. Access explains part of the gap, but 37% paywalled papers does not close the rest of it. The share of open-access papers differed by agent as well: 91% of what Edison QA3 cited was publicly available, against 72% for GLM-5.2 and 67% for Gemini 3.1 Pro.
The spread between five runs of the same instruction was wide too. Opus 4.8 recovered 37–74% depending on the run and Gemini 3.1 Pro 5–37%. That is too wide a band to run once and conclude the reference list is complete. Nor is this specific to this paper. In a 2025 study by Clark and colleagues, cited by the authors, LLM search workflows missed 68–96% of relevant studies and extracted 4–31% of items incorrectly.
There was a problem worse than missing things. The authors verified every unique citation and sorted them into three groups: real and accurate, real papers with errors in the authors, year or journal, and papers that do not exist. Of Qwen3.7-Plus's 60 unique citations, 27 were fabricated, which is 45%, and only 2 were verified without any error. GLM-5.2 fabricated 20 of its 69. The remaining five agents produced no hallucinated citations at all.
Volume was no guide to quality either. Edison QA3 wrote the longest reports at an average of 10,035 ± 2,466 words, reaching 14,441 words in one run, roughly twice the length of the Opus 4.8 and GPT-5.5 reports. Across all seven models, report length and field accuracy were only moderately correlated. In the end, the accuracy of values extracted from these autonomous reports came to 39.9% for Opus 4.8, 37.1% for GPT-5.5 and 34.6% for Edison QA3, and no model cleared 60% on any single field.
It is worth being precise about what broke, though. When an agent did pin down an experimental condition and report an affinity value for it, that value was usually close to the truth. Of the association constants, 89% fell within a factor of two of the real value, as did 84% of the dissociation constants. The failure was not in reading numbers but in the earlier step of choosing which literature to read and pinning down which condition a value came from. The distance between the first experiment, where the papers were handed over, and this one, where the agent had to find them, sits right there.
Switching Models Beat Rerunning One
The last experiment changes fields entirely. Moving from cardiac physiology to brain organoid research, the team turned a standard reporting guideline for quantitative organoid analysis into 23 assessment criteria. Each of the seven models wrote its own master prompt, then assessed ten papers five times each, and two PhD-level human reviewers assessed the same papers.
The 23 criteria cover items that apply to every method plus four groups: morphology and lineage, transcriptomics, functional and metabolic. Under morphology and lineage, for example, a researcher should sample at least three to five organoids from each differentiation batch, and ideally should set the sample size from prior experiments and a power analysis. The models had to answer yes or no on each criterion and attach the quotation from the paper that supported the call.
The first thing that stood out was on the answer key side. The two reviewers reached the same verdict on 79.1% of criteria and differed on the other 20.9%. Model agreement with humans came to 83.9% against reviewer 1 and 78.2% against reviewer 2, an average of 81.1%. Put another way, the same model's score moved by as much as 7.8 percentage points depending on which reviewer you treated as the reference.
Nor was the disagreement spread evenly. Reviewer agreement was 86.7% on morphology and lineage and 85.0% on transcriptomics, but fell to 50.0% on the functional criteria. Functional disagreements also leaned one way: in half of those assessments, reviewer 2 counted the criterion as reported and reviewer 1 did not. Seven of the 23 criteria accounted for 66.7% of all disagreements. Which criteria divide humans is knowable in advance, which means where review time should go is knowable in advance too.
Running the same model five times, the share of assessments that came out identical every time was highest for GPT-5.5 at 92.6 ± 7.7pp, followed by Kimi K2.6 at 87.8% and Opus 4.7 at 87.0%, with Gemini 3.1 Pro lowest at 81.7%. That means 18.3% of its assessments differed at least once across five runs. Yet Gemini 3.1 Pro's five-run majority verdict matched the reviewer consensus 91.8% of the time. How consistent a model is with itself and how close it lands to human judgement were measuring different things.
At this point the authors ask the question a practitioner actually faces. When several models are available, should you ask the same model for the same assessment repeatedly, or ask different models and combine their answers?
▲ Pebblous original diagram. Agreement with the human reviewer consensus, with bars drawn from a baseline of 85%.
Asking the same model to repeat the same assessment topped out at 89.2% even with five runs. Majority voting across different models, by contrast, reached 92.1% with three models and 93.3% with five. If the budget for runs is fixed, that budget did better spread across several models than concentrated on one.
An observation about using the disagreement itself follows. Looking only at cases where both reviewers agreed, a unanimous 5–0 verdict across the five runs matched the reviewer consensus 93.2% of the time. A 4–1 split fell to 65.0%, and a 3–2 split to 55.2%. The models were, in effect, flagging which of their own answers were shaky, and that is where the reading list for a human comes from.
One of the ten papers being assessed was a concept paper rather than an experimental one. Only Opus 4.7 pointed this out without being asked. The rest carried out the assessment even though the context did not fit the request. Verifying that a source is the right kind of material for the question in the first place, the authors write, remains the researcher's job.
A Division of Labour That Leaves a Record Earns Trust
The four experiments do not point in one direction. The first, where a human set the standard, worked in the low nineties. The second, which handed prompt writing to the models, followed a few points behind. The third, which also handed over finding the literature, lost half the references. The fourth, which built a new dataset, came close to human reviewers but could not do without them. Which job was handed over mattered more than how much of the work was.
The picture the authors draw in their conclusion is therefore not a leaderboard but a division of labour. Experts define the question, the sources and the evidence standard. Models perform repeated extractions across several systems. Human review concentrates on the contested cases, the ones where context matters and the ones with the largest consequences.
▲ Pebblous original diagram. The division of labour the paper proposes, and the rule for choosing where a human steps in.
Translated into practice, it comes down to a handful of rules. Run every prompt at least five times and report the majority answer. When the run budget is fixed, spread it across models instead of piling it onto one. Collect the items where the verdicts split into a separate list for a human to read. And check first, as a human, whether the source is the right material for the question at all. All four come straight out of the experiments in this paper, and all four were established with nothing more than browser-based models.
What makes this structure meaningful on the data quality side is not that it saves human time. It is that every judgement leaves a trace. Once you record which item split and how far, and who decided what as a result, a finished dataset can be reopened later and its low-confidence regions picked out. A dataset produced by one model in one pass carries no such record.
The moment in the first experiment when the models caught errors in the 2006 review worked on the same principle. That several models deviated from the answer key at the same place was itself the signal. Cross-checking is not only a device for auditing model output. It also puts the standard you have been treating as the truth back under review.
Editor's Note: This overlaps with a scene we keep meeting in data quality diagnostics at Pebblous. Ask how trustworthy a dataset is and the answer usually comes back as a single final accuracy number. How that number was produced, which items the verdicts split on, and who resolved the splits and how, are often nowhere in the record. The experimental design in this paper shows exactly how to leave that record: run it more than once, run it on a different model too, and count where the answers diverge.
The Pebblous blog has covered the reproducibility problem of doing science with closed models and a science AI workbench that treats reproducibility as a first-class feature. This paper adds measurements to that conversation. The paper itself and the repository holding the prompts, raw data and tutorials are at arXiv 2608.19025 and on GitHub.
Pebblous Data Communication Team
August 22, 2026
References
Academic Papers
- 1.Romanov, V., Bax, M. & Niederer, S. A. (2026). "Self-prompting and cross-model consensus enable reproducible data extraction from scientific literature with large language models." arXiv:2608.19025.
- 2.Niederer, S. A., Hunter, P. J. & Smith, N. P. (2006). "A Quantitative Analysis of Cardiac Myocyte Relaxation: A Simulation Study." Biophys. J. 90, 1697–1722. DOI: 10.1529/biophysj.105.069534.
- 3.Clark, J. et al. (2025). "Generative artificial intelligence use in evidence synthesis: A systematic review." Res. Synth. Methods 16, 601–619. DOI: 10.1017/rsm.2025.16.
- 4.Sandoval, S. O. et al. (2024). "Rigor and reproducibility in human brain organoid research: Where we are and where we need to go." Stem Cell Rep. 19, 796–816. DOI: 10.1016/j.stemcr.2024.04.008.
Data & Code
- 5.Romanov, V. (2026). "romanov-2026-llm-extraction." GitHub. Repository of prompts, raw/curated data, and tutorials.