Executive Summary
Researchers at the National Astronomical Observatories of the Chinese Academy of Sciences have released a system that reads an astronomy paper and works out whether it actually used a given telescope's data. It is called FacilityAudit-Agent, and its verdict comes back on a six-level scale running from non-use through mention-only to auxiliary, major, and exclusive data support. This article looks at what those six levels separate, and at why separating them reaches all the way to a telescope's budget.
The score the paper puts forward is 89.1% accuracy. The exam was 39,358 paper-facility pairs that people had graded by hand, and the system came out ahead of feeding whole papers to a language model, of the common retrieval-augmented approach, and of an earlier purpose-built system. Judging one paper costs somewhere between 142,000 and 455,000 tokens, though, and ambiguous cases still go up to a person. The place the authors give the system is not a replacement for bibliographers but a screening layer set in front of them.
Sections 1 through 5 follow what the paper records and the figures it published. Section 6, which carries the distinction over to AI training data and public data, is this article's interpretation and not something the paper claims.
Key Numbers
All four numbers are values the paper published. The accuracy was measured in the mode that audits one named facility, and the token figure is an average over the papers used in testing.
Source: arXiv:2610.32135, posted October 23, 2026.
89.1%
Accuracy in single-facility audit mode
Measured against the levels people assigned, taken as the answer key. Feeding whole papers to a model stopped at 83.3%
39,358
Paper-facility pairs used in testing
The share set aside for testing out of 79,407 pairs, covering 4,093 papers. Each level here was assigned by two people reading separately
12.1 points
Accuracy gap over the earlier purpose-built system
The narrowest gap is 5.8 points. Of the six levels, the distance from the compared approaches ran largest at L2 and L5
142K–455K
Tokens to judge one paper
An average over the papers used in testing, varying with the model. It is one of the limitations the paper records about itself
A Name in the Paper Counted as Use
A large observing facility, once built, runs for decades. Decades of operating budget, the upkeep of the archive, and the decision whether to build the next instrument all hang on one question. How much has this facility actually contributed to peer-reviewed papers? That is the motive the researchers give for building the system. These are among the most expensive scientific installations humanity has ever put up, and the indicator that speaks for what they produced is, in practice, a literature tally and nothing else.
The way it is taken, though, is plain. If a facility's name appears somewhere in a paper, the paper counts toward that facility. The title of the paper aims at exactly this habit. The original reads Beyond Mention-as-Usage, which is to say: get past the arithmetic that treats a mention as a use.
Under that arithmetic, a paper whose introduction notes once that such a survey exists and a paper that drew every observation behind its conclusion from that facility are both a single count. What the two papers owe the facility is nothing alike. And then budgets are divided by that number.
What the Six Levels Separate
The scale the system assigns has six levels. There is one criterion: how far the data out of that facility holds up the paper's scientific argument. It does not count how many times the name appears. It asks whether the conclusion still stands without that data.
| Level | What it points to |
|---|---|
| L0 Non-use | The facility is not even mentioned, or the abbreviation is ambiguous enough that no particular facility can be pinned down |
| L1 Mention-only | Only the name turns up, in background discussion. None of the facility's observational data is used |
| L2 Instrument and engineering discussion | The paper deals with the facility's design or calibration itself. It does not scientifically analyze the facility's observational data |
| L3 Auxiliary contribution | The data is used for calibration or comparison. It is not the core evidence holding up the final conclusion |
| L4 Major contribution | The core conclusion leans on this facility's data together with data from other observing facilities |
| L5 Exclusive contribution | The data the conclusion rests on came from this facility and no other |
Source: the L0 through L5 definitions in arXiv:2610.32135.
What the old tally counted as one splits five ways on this scale. L1 and L5 were the same single line in the ledger, but measured by what the facility contributed to the paper, they sit at opposite ends.
How the Machine Reads a Paper
Assigning these levels by hand means reading the full text. Whether the name written in the introduction comes back in the data section, whether the figure carrying the result was drawn from that data: you have to follow all of it before the level is settled. Set against the number of papers a single observatory has to comb through in a year, no team of hands can keep up.
The route the system takes is to not push the whole paper into the model. It first cuts the PDF into a page-bounded outline and tags each section with a role, such as background, method, or result, and with whether a facility is mentioned there. A tool-calling model then pulls out only the passages it needs, when it needs them. The evidence gathered that way goes into an explicit decision tree, which settles the level. It is a structure that leaves a record of which sentence in which section was the basis for that level.
Which part of that structure carries the performance is something the paper shows by stripping the components out one at a time. Remove the ability to go back and read passages over several passes and macro-F1 falls from 79.8% to 62.9%; remove the tree-structured index over the outline and it lands at 66.6%. Those drops, 16.9 and 13.2 points, are the two largest among the four components tested. The paper records that these two were decisive above all for telling L3 through L5 apart. The stretch where you have to judge whether the conclusion genuinely rests on that data is exactly where the structure was needed.
The last step shows what kind of system this is. Every verdict carries a coverage-calibrated confidence score, and cases with a low score are routed to human review. There are two modes. One names a single facility and assigns only its level in that paper; the other first finds every facility the paper names and then assigns a level to each. The first is where 89.1% came from.
Measured Against 39,358 Human Labels
People built the exam first. From 8,184 papers published in ten journals between 2022 and 2025, they paired ten facilities against those papers to draw 79,407 paper-facility pairs. The facility list is not only LAMOST, FAST, and EP. The Hubble Space Telescope, Keck, the VLT, Subaru, Gemini, the GTC, and SDSS are in there as well. This is not a scale built around Chinese facilities alone.
Two people read each full text separately and assigned the levels, and a third adjudicator decided the cases where they split. Taking 2,000 of the pairs aside and measuring how often the two picked the same level gave a Cohen's kappa of 0.87. On a six-way split, that is how far people agreed with each other. Of the 79,407 pairs, 39,358, covering 4,093 papers, were used for testing.
The result is 89.1% accuracy and 79.8% macro-F1. Set beside the three approaches compared on the same exam, it reads like this.
| Approach | Accuracy | Macro-F1 |
|---|---|---|
| FacilityAudit-Agent | 89.1% | 79.8% |
| Feeding the whole paper to a model | 83.3% | 71.1% |
| Chunking the document and retrieving (chunk-RAG) | 80.8% | 66.9% |
| The earlier purpose-built system (TRACS-AMC) | 77.0% | 63.4% |
Source: arXiv:2610.32135. The accuracy gaps are 5.8, 8.3, and 12.1 points respectively.
The paper points to L2 and L5 as the places where the gap opens widest. A paper that only talks about the instrument, and a paper that leaned on that one facility and nothing else: these are the two ends that even people cannot sort out without reading the full text. The paper does attach a caveat alongside, that L2 cases are rare enough on their own that no statistically firm conclusion can be drawn about them.
The values at those two ends run as follows. At L5 the F1 is 63.9%, where the best of the three compared approaches reached 50.0%. At L2 it is 62.3% against 48.5%. Ahead is the right word, but the fact that both values sit well below the overall macro-F1 of 79.8% has to be read alongside it. Splitting the call six ways is still on the hard side for machines too.
Two modes mean two scorecards. In the mode that first finds every facility a paper names, picking them all out is itself the test. Precision at that step is 86.5%, recall 80.4%, and F1 83.3%. That is the same number as the 83.3% in the table above, and it is not a typo. That one is the accuracy of feeding the whole paper to a model; this one is the F1 for listing facilities without missing any. Macro-F1 for assigning levels among only the pairs it listed correctly was 78.6%. In this mode too it came out ahead of all three compared approaches.
Already Inside Three Facilities' Counts
The system has not stayed a prototype built for a paper. It has been deployed at the National Astronomical Data Center, where it handles literature data for three facilities: LAMOST, FAST, and the Einstein Probe (EP). All three are large observing facilities China operates.
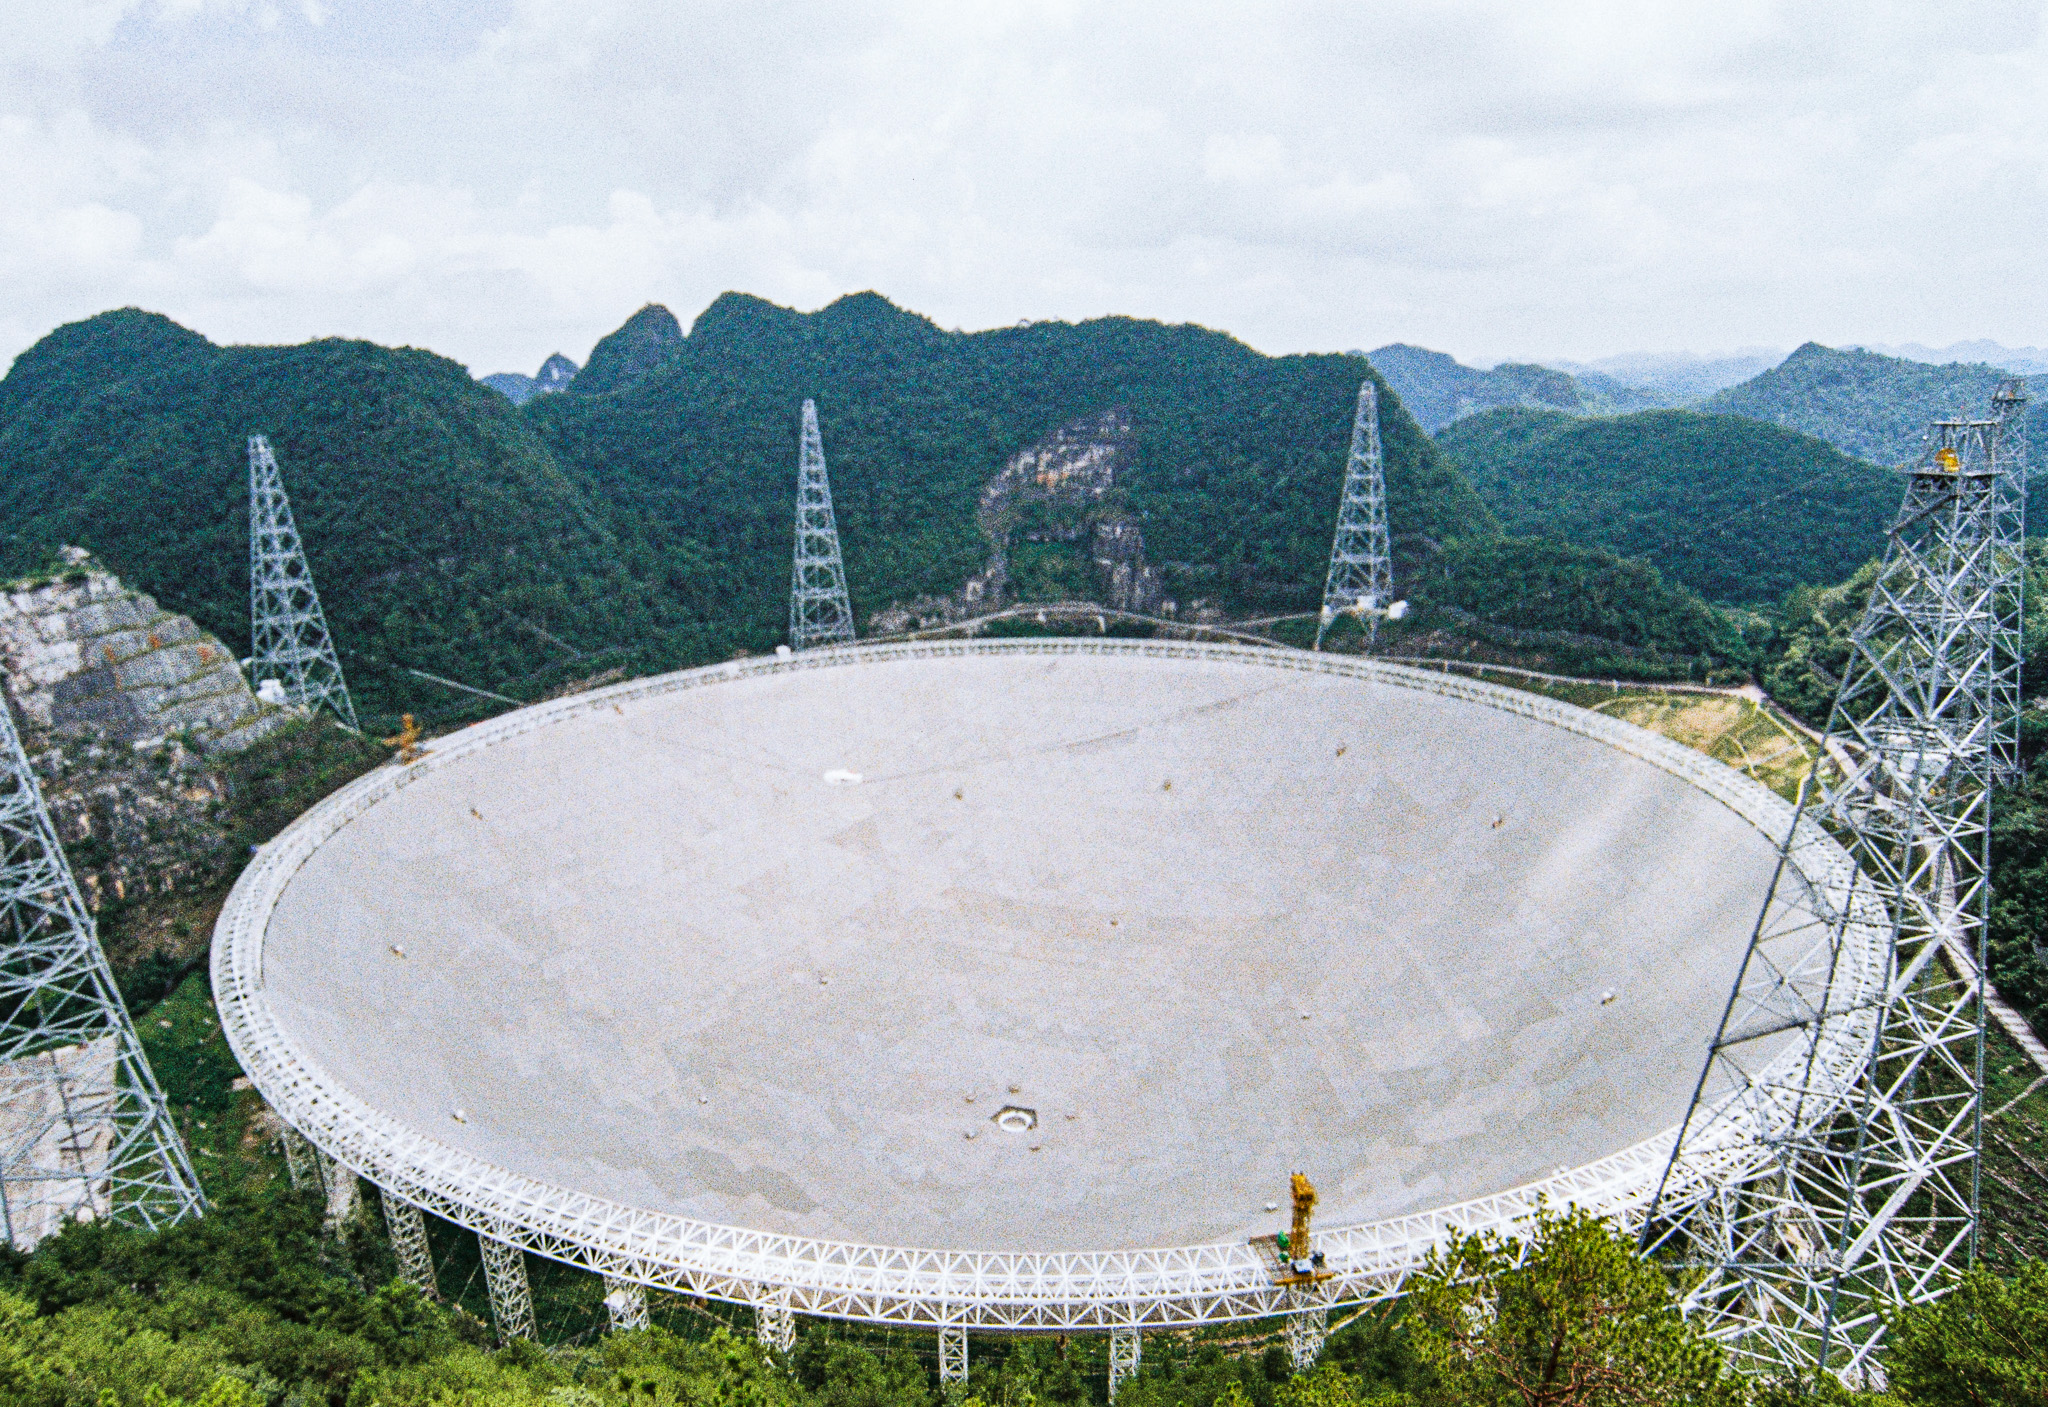
That does not mean people have taken their hands off it. Filtering once, before a bibliographer reviews the case, is all this system is asked to do. Verdicts that come back with low confidence go up to a person.
One design advantage the paper puts forward is that moving the system to a new facility calls for no retraining. It judges by level definitions and a decision tree rather than by a classifier tamed on data, so there is nothing to train in the first place. The limitations section of the same paper, though, records that this transfer has not yet been tested. What has been confirmed so far is performance within those ten facilities.
The paper wrote down its limitations itself. Judging one paper runs to an average of 142,000 to 455,000 tokens depending on the model. The structure leans on stable tool calls and on output in a fixed format, so when the model underneath wavers, the verdicts waver with it. The validation scope is likewise tied to ten facilities and to particular journals and years, and if the PDF is not clean, the first step of building the outline already goes wrong. Among the items listed as future work is measuring how much review time this screening actually saved a person. Which is to say it has not been measured yet.
Why Pebblous Is Watching This Paper
The same ledger exists outside astronomy. Anywhere that how much a resource was used gets counted by how many times its name was written down.
Provenance in AI training data is one such place. That a dataset's name sits in a model card or a datasheet says almost nothing about which of the model's abilities that data grew, and by how much. A small corpus that got mixed in once and the corpus that decided the model's character are the same single line on the list. Records of public data use look much the same. Count use by page views and downloads, and opening a file once and closing it counts as much as building a service on top of it.
Look again at what FacilityAudit-Agent did, and the larger part is less that it built a new model than that it redefined how to count. It put grades between a name on the page and a conclusion that stands on the data, and it got a machine to assign those grades consistently. What is worth taking from the astronomy case is that order.
- • Define the levels first. If what counts as L1 and what counts as L5 is not written down, neither a person nor a machine can repeat the same verdict
- • Have people label an exam set. The procedure in which two read separately and an adjudicator decides where they split, and the step of putting their agreement out as a number, belong here
- • Publish how far the machine's verdicts and people's verdicts agree. 89.1% is useful not because it is high but because which exam it came out of is written next to it
- • Settle in advance where ambiguous cases go. Without a route that sends low-confidence verdicts up to a person, even a six-slot scale ends up used like a one-slot ledger
When Pebblous talks about AI-Ready Data, what it puts next to quality is provenance and lineage. The state in which you can trace back which data contributed how much to which result. This paper shows, against 39,358 labels that people assigned, that once you turn that tracing into a graded scale, a machine can assign it on your behalf. Without the grades, all that is left is the fact that a name appeared.
Editor's Note
The number from this paper that will last longest is probably not 89.1% but six. Accuracy climbs along with the models, and in a few months another team will come out holding a higher figure. The decision to split contribution into six grades cannot be swapped out that way. It has to be there before the word accuracy means anything at all. Where there is no way of counting, you cannot even say that something is wrong, and the telescope ledger has been exactly that kind of place.
Thank you for reading this far. The facts in this article were checked against arXiv:2610.32135, posted on October 23, 2026, and the deployment and the center's name were checked against the National Astronomical Data Center's own site. The analogy in Section 6 is not something the paper says; it is this article's reading from the side that works with data. We would be glad to hear how many slots your own organization counts data use in.
Pebblous Data Communication Team
October 28, 2026