Executive Summary
This article reads one paper posted to arXiv on October 5, 2026. It introduces BRAHMa, a public tool that looks at an image of a galaxy, finds the straight bar running through the centre, and measures how long it is. The tool handles an image in tens of milliseconds, so the speed is not the surprising part. The part worth looking at is what the authors measured their model's accuracy against.
There is no answer key for bar length that everyone accepts. Two catalogues built by people exist, they disagree with each other, and on the 586 galaxies they share the average gap is 0.99 kpc. Rather than crown one of them as the truth, the authors declared that gap the floor of the measurement. Their own model stands 1.14 kpc from the same reference. The difference is 0.15 kpc, and they wrote it down as the apparent price of replacing the volunteers with a network.
Sections 1 through 3 are facts from the paper (arXiv:2610.07410). Sections 4 and 5 are this article's reading of those facts through the eyes of people who work with labels.
Key Numbers
The paper narrows to four numbers. The first two are the gap between the human answer keys and the error of the model. The last two are the distance between those two figures, and the spread among the people who built one of the catalogues.
Source: Shrivastava, Patra & K (2026), arXiv:2610.07410.
0.99 kpc
Average gap between the two human answer keys
Bar lengths compared on the 586 galaxies common to both catalogues
1.14 kpc
BRAHMa's average error
Measured on the 3,150 galaxies of the Hoyle catalogue after a correction was applied
0.15 kpc
What swapping people for a model costs
The gap the authors call the apparent price of replacing the volunteers by the network
20%
How closely different volunteers agreed on a bar length
The same volunteer measuring the same bar again came within 3 per cent
Why Anyone Measures the Bar Across a Galaxy
Look at pictures of spiral galaxies and some have a round centre, while others have a straight bar across the middle with the spiral arms starting at its ends. The second kind is called a barred spiral, and our own galaxy is one. In the near-infrared, the paper says, about two out of every three nearby disc galaxies turn out to be barred. At optical wavelengths the figure lands somewhere between a quarter and a half, and the paper puts that spread down to how a bar is defined and at what resolution the galaxies are examined. Change the definition and the same galaxy moves in or out of the count. That is the first sign that the edges of this structure are not settled.
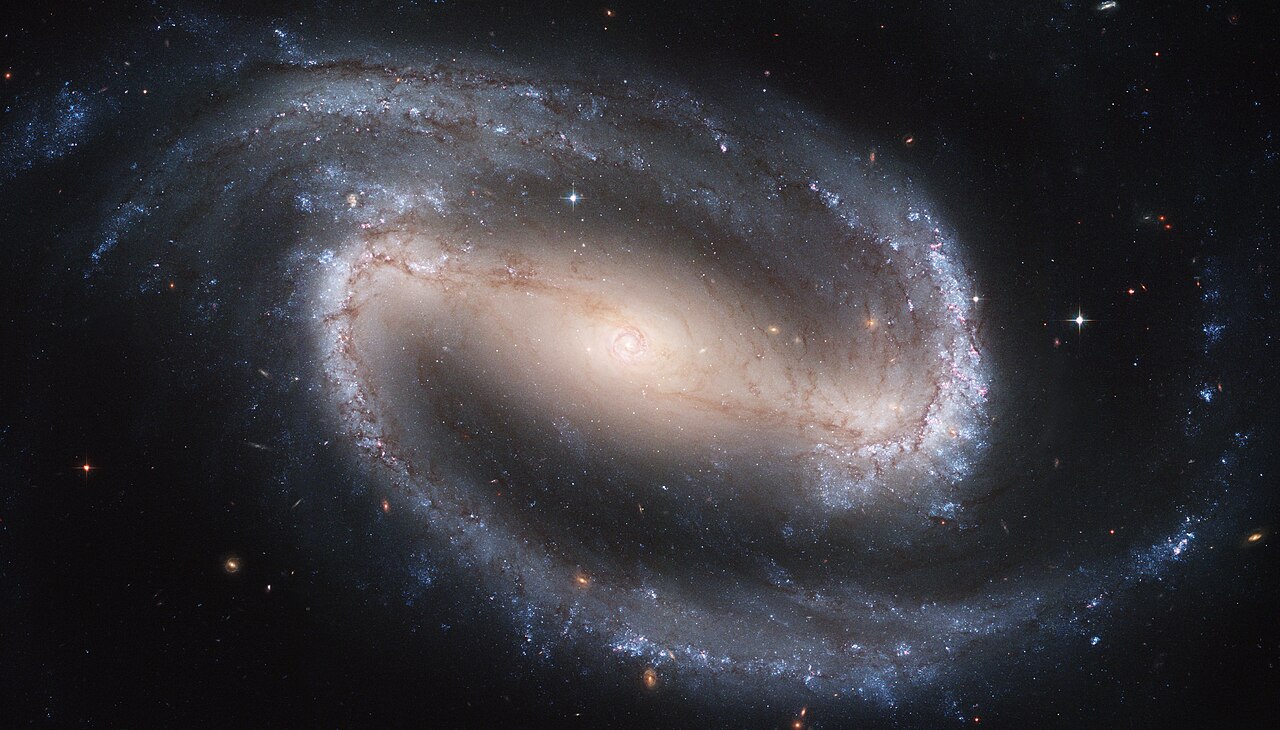
A bar is not decoration on a photograph. It changes the galaxy it sits in. The lopsided gravity of a bar puts a torque on gas, drives that gas inward, and new stars form there. The bar also turns slowly and trades angular momentum with the dark matter halo around it. So the length of a bar is rarely the conclusion of a study. It is an input to the next calculation, used when the rotation speed of the bar is estimated and when the dark matter density in the inner galaxy is constrained. Get the length wrong by 1 kpc and everything built on it shifts. One kiloparsec is about 3,260 light years, and in the comparison scatter plot the paper shows, bar lengths run mostly between about 2 and 12 kpc.
Until now this measurement has been a human job, done either by specialists or by volunteers in citizen science projects. The problem is volume. The surveys coming online will deliver galaxies in the hundreds of millions to billions, and looking at them one at a time does not reach that far. The paper names the targets it has in mind: the full DESI Legacy Surveys footprint, the Euclid space telescope, LSST imaging, and the deeper JWST imaging that reaches further back. Recent machine learning work has approached the task by painting the bar region pixel by pixel, which is heavy to compute and still needs post-processing before a physical length comes out of the painted region.
BRAHMa aims at the gap between hand measurement and pixel painting. The authors took YOLO11x-OBB, pretrained on the aerial imagery benchmark DOTA, with 58.8 million parameters. Unlike the upright boxes a standard detector draws, an oriented box can rotate, so a single box carries the position, the length and the tilt of the bar at once. Before going near real galaxies the method was tried on synthetic images to see whether it worked at all, and then it was fine-tuned on 3,091 galaxies taken from the bar masks of Galaxy Zoo 3D, split 80:10:10. The images the model saw were DESI Legacy Survey frames. The Hoyle catalogue it is later scored against was built on SDSS photographs, so the sky the model learned from and the sky its answer key came from are not the same survey. Another feature is that contrast was tuned per galaxy. The authors generated 50 local histogram equalisation settings for each one and kept the setting that maximised the m=2 Fourier amplitude, the component that corresponds to a bar.
The detection itself works well. On the validation set the precision is 0.972 and the recall 0.984, and on the test set the precision is 0.968. The speed matches the reason for doing this at all. At about 30 ms for a 1024-pixel image, the authors calculate, 100 million galaxies would take roughly five weeks on a single GPU of that class.
None of that is unusual. A model does a human measurement far faster. Where the paper parts company with the rest comes next. Having built the thing, what do you hold its accuracy up against?
There Are Two Answer Keys, and They Disagree
Two large catalogues of human-measured bar lengths exist, and they were built in different ways. Seeing how they differ makes the numbers that follow easier to read.
| Catalogue | What the people did | Size |
|---|---|---|
| Hoyle et al. (2011) | Drew a single line along the bar in a Google Maps style interface | 3,150 low-redshift (z<0.06) SDSS disc galaxies |
| Galaxy Zoo 3D (2021) | Fifteen volunteers per galaxy drew polygons around the bar and the spiral arms | 29,831 MaNGA target galaxies |
▲ Source: the two catalogues as described in arXiv:2610.07410.
What the Hoyle catalogue holds is a line. The two ends of the line are the two ends of the bar. Every bar in it was drawn at least three times, which is why the paper can quote how much the measurement moves. Repeat measurements by a single volunteer scattered by only 3 per cent, while measurements by different volunteers agreed within 20 per cent. One pair of hands is remarkably steady. Change the hands and the spread widens by nearly a factor of seven.
Galaxy Zoo 3D leaves behind something else. Fifteen volunteers each drew their own polygon, and what was published is a mask counting how many polygons overlap on every pixel. Some pixels were called bar by all fifteen people, others by only four. The spread of opinion was never flattened out of the data. To train on these masks BRAHMa binarised them at an overlap fraction of 0.4, a value chosen after sweeping from 0.10 to 0.90 and checking each result against the Hoyle catalogue.
▲ Original Pebblous diagram (reinterpretation) — what separates the two ways of measuring the same bar. This difference in convention is what the catalogue-to-catalogue fit's slope of 0.545 reflects. Source: reconstructed from the catalogue construction described in arXiv:2610.07410.
586 galaxies appear in both catalogues. Lay the two sets of measurements of the same bars side by side and the mean absolute error is 0.99 kpc, with a root-mean-square error of 1.40 kpc. The correlation is high at 0.94. The two catalogues point the same way, and their rulers are offset.
The character of that offset shows up in the fit the authors made between the two catalogues. Hoyle length = 0.545 × GZ3D length + 0.152 kpc. A slope of 0.545 means the GZ3D side wrote down nearly twice the length for the same bar. Drawing a polygon carries the hand out into the faint outer region where the bar fades away, while drawing a line tends to stop where the structure is still clear. This is a systematic offset leaning one way, not noise scattering in both directions.
So 0.99 kpc is not a pile of human mistakes. Two groups answered the question of where a bar ends differently, and the number is what that difference in definition comes to in kiloparsecs. Nothing in the data says which group was wrong.
An Error of 1.14 kpc Sits 0.15 kpc Above the Floor
BRAHMa learned from Galaxy Zoo 3D masks, so it comes into the world carrying the habits of GZ3D. The authors say as much. Any model trained on GZ3D should be expected to inherit the 0.99 kpc disagreement between the two catalogues.
The evaluation ran the model over all 3,150 galaxies of the Hoyle catalogue. A correction is applied here too, and it is a different equation from the catalogue-to-catalogue fit in the previous section. The one applied to the model's output is calibrated length = 0.570 × model length + 0.550 kpc. After that correction the mean absolute error is 1.14 kpc, the root-mean-square error 1.59 kpc, the Pearson correlation 0.91 and the Spearman correlation 0.92. The abstract rounds this figure to 1.1 kpc while the table in the body gives 1.14 kpc. They are the same number.
Put the two figures next to each other and the argument of the paper fits on one line. Two groups of people stand 0.99 kpc apart when measured against the Hoyle catalogue, and the model stands 1.14 kpc from the same reference.
▲ Both figures are mean absolute errors measured against the Hoyle catalogue. Source: arXiv:2610.07410, Table 2.
This is what the authors call that 0.15 kpc gap.
The extra 0.15 kpc is the apparent price of replacing the volunteers by the network.
They add one more line to it. The comparison is dominated by the disagreement between the human conventions, not by the model.
Set that against the frame most model evaluations use and the difference is plain. The usual approach lays one answer key on the floor and reports how far the model stands from it. Then 1.14 kpc is simply 1.14 kpc, with no coordinate for judging whether it is large or small. These authors brought in a second answer key, measured how far apart the two stood, and made that distance the origin of the coordinate system. The same number now reads differently.
3.1The Limits the Paper Sets Out Itself
Before taking that frame on board, read the conditions the authors attach to it. Of the caveats the paper lists, five bear directly on how these two numbers should be read.
- • The binarisation threshold of 0.4 and the correction equations were both chosen on the very galaxies used in the evaluation. The paper says this makes the figures optimistic
- • Up to 586 of the 3,150 Hoyle galaxies are also GZ3D galaxies, and many of them were probably in the training split. The remaining galaxies were not evaluated separately, so a contribution from training-set overlap cannot be excluded
- • The training sample leans towards MaNGA target galaxies above a billion solar masses at z<0.15. Weak bars, dwarf galaxies and highly inclined discs are under-represented
- • The lengths that come out are projected on the sky. No correction for how far the galaxy is tilted was applied, so these are not true three-dimensional lengths
- • One class, one box. Double bars and ansae, the bright clumps that sit at the ends of some bars, are beyond it, and a bright foreground star can pull the centre to the wrong place
Whether it holds up on material outside the training data was checked separately. With no retraining, the model was run on WISE mid-infrared images of NGC 1300 and NGC 3627, and the box followed the bar in both. What the authors want this check to show is clear enough: the model learned the shape of a bar rather than the appearance of Legacy pixels. The verdict they attach to it is short and honest. Two galaxies are not a statistic.
They also wrote down what is left to do. A quantitative test against bar catalogues built in the near-infrared, and feeding the bar geometry this tool produces into the classical method for measuring how fast a bar turns, the Tremaine–Weinberg method. The second of those puts the bar length back where section 1 left it, as an input to another calculation instead of a conclusion.
The Labels Come Out of Human Hands Outside Astronomy Too
This structure is not peculiar to galaxies. Medical imaging documents it well, in the form of specialists who read identical material and write down different findings. In a 2022 study in the journal Diagnostics, six radiologists with between one and sixteen years of experience each read 100 chest X-rays on two separate occasions. Agreement per finding, measured with Randolph's kappa, spread from 0.40 to 0.99. The lowest was atelectasis at 0.40. Same images, same finding, six trained specialists.
Ordinary data work treats this point differently. Whether the material is a radiology finding, a photograph of a defect on a production line or a box around an object in driving footage, several people label it, a vote or an adjudicator picks one answer, that answer is fixed as the truth, and then model evaluation begins. At the moment of fixing, the fact that people disagreed leaves the data. Model scores are then managed to three decimal places while how much the answer key underneath them moves is written down nowhere.
▲ Original Pebblous diagram — the moment several labellers' boundaries are fixed into one answer key by majority vote, the very fact that they disagreed disappears from the data.
The BRAHMa paper did close to the opposite. It neither merged the two catalogues nor discarded one, keeping both alive to the end and writing down the distance between them. That gave the model error something to be compared against. Galaxy Zoo 3D publishing the count of overlapping polygons per pixel, instead of voting the spread of opinion away, is a choice of the same kind.
Measure the disagreement in the answer key and the floor on the error becomes a ceiling on the score. If a model turned up claiming an error of 0.1 kpc in a place where people stand 0.99 kpc apart, the likely explanation is not that it got more accurate but that it memorised the habits of one group. Without the ceiling, there is no way to tell those two apart.
Why Pebblous Is Watching This Paper
Say a report lands on your desk with a model accuracy of 99 per cent. That figure is calculated with the answer key as its denominator. So without knowing how solid the answer key is, you do not know what 99 per cent means. On a task where two labellers give the same answer only 90 per cent of the time, a model claiming 99 per cent may not have become better than people. It may be pointing at a place where measurement is no longer possible.
A team working with data has three things worth checking before the work of raising model performance begins.
- • Do you have a number for how far two people diverge when the same data is handed to each of them separately? Without it there is no baseline yet to compare a model score against
- • Is that divergence a mistake or a difference in definition? If one side consistently marks longer or consistently marks wider, the thing to fix is the guideline rather than the training of the people
- • Is there a report that writes the model error and the human disagreement in the same unit, side by side? Only with both numbers in hand can you say whether the model has reached the floor or still has distance to cover
There is a premise Pebblous repeats whenever it talks about AI-Ready Data. The quality of data cannot be read off the data alone, and how that data came to be has to be recorded alongside it. Labels are no different. Who applied them, under which guideline, and how far they diverged from one another has to survive, before an accuracy calculated on top of those labels means anything. A paper about bars in galaxies has shown the same premise again from the direction of astronomy.
Thank you for reading this far. Every figure and quotation here was checked against the original text of arXiv:2610.07410, and the tool itself can be tried through the web interface the paper released. If your team holds a number for how much its answer key moves, we would be glad to hear what that number is.
References
- 1.Shrivastava, R., Patra, N. N., K, Keerthi. (2026). "BRAHMa: Bar Recognition And Hatching using Machine learning." arXiv:2610.07410.
- 2.Hoyle, B., Masters, K. L., Nichol, R. C. et al. (2011). "Galaxy Zoo: bar lengths in local disc galaxies." Monthly Notices of the Royal Astronomical Society, 415, 3627-3640.
- 3.Masters, K. L., Krawczyk, C., Shamsi, S. et al. (2021). "Galaxy Zoo: 3D -- Crowd-sourced Bar, Spiral and Foreground Star Masks for MaNGA Target Galaxies." Monthly Notices of the Royal Astronomical Society, 507(3), 3923-3935.
- 4.Li, D., Pehrson, L. M., Tøttrup, L. et al. (2022). "Inter- and Intra-Observer Agreement When Using a Diagnostic Labeling Scheme for Annotating Findings on Chest X-rays." Diagnostics, 12(12), 3112.